AWS Open Source Blog
Implementing CloudWatch-centric observability for Kubernetes-native developers in Amazon Elastic Kubernetes Service
This post was written by Seth Dobson (Southwest Airlines), Paul Ramsey, and Sheetal Joshi.
The solution presented in this blog shows how large enterprise organizations such as Southwest Airlines can implement an end-to-end, Amazon CloudWatch-centric observability solution for Kubernetes clusters running on Amazon Elastic Kubernetes Service (Amazon EKS) in a way that feels natural for Kubernetes-native developers. It addresses key challenges related to integrating CloudWatch with Kubernetes, such as creating CloudWatch Alarms in a Kubernetes manifest and integrating CloudWatch metrics with the Kubernetes Horizontal Pod Autoscaler (HPA). By using CloudWatch to solve for the three pillars of observability—logs, metrics, and tracing—developers can spend more time innovating for their customers and less time configuring, operating, and upgrading multiple open source tools or licensed third-party observability products.
Introduction
At Southwest Airlines, we manage a large Amazon EKS environment that hosts mission-critical applications required to run our business. Amazon EKS gives us secure, highly available Kubernetes clusters to run our applications, and it does the heavy lifting of control plane management for us.
In addition to these containerized workloads, we also run serverless workloads on AWS Lambda and AWS Fargate for Amazon Elastic Container Services (Amazon ECS), and we run traditional server-based workloads on Amazon Elastic Compute Cloud (Amazon EC2). Each of these applications uses its own backend datastore (Amazon Aurora, Amazon DynamoDB), messaging layer (Amazon Simple Queue Service [Amazon SQS], Amazon Simple Notification Service [Amazon SNS]) ingress and API management (Elastic Load Balancing [ELB], Amazon API Gateway) and a host of other Amazon services that help us keep our environment secure, available, and responsive for our customers.
When something inevitably goes wrong with one of our workloads, we need an observability solution to detect the event, alert the right people, and expose logs and trace data in an easily consumable format so that our operations teams can quickly pinpoint and resolve the issue.
We need the platform to work across all of our application stacks (containerized, serverless, and server-based), and we need to minimize the management overhead of the solution so that our engineers can focus on work that matters to our business. We also must make sure that the platform we select provides an end-to-end solution that covers all three pillars of observability (logs, metrics, and tracing).
After evaluating various open source and third-party observability tools, we chose Amazon CloudWatch as our standard observability solution because it provides a single pane of glass that gives us visibility into all of our application architectures. It requires zero infrastructure, zero licensing, natively integrates with all Amazon Web Services (AWS), and is available to Amazon customers by default.
Because CloudWatch services are serverless, we don’t have to worry about performing version upgrades or sizing instances. Amazon also provides CloudWatch Container Insights, which generates metrics and visualizations for containerized applications running on Amazon EKS.
When implementing Amazon CloudWatch for EKS, however, we faced the following challenges related to CloudWatch metrics and alarms:
- There is no native integration between CloudWatch metrics and the Kubernetes Metrics Server, so applications cannot use the Kubernetes Horizontal Pod Autoscaler (HPA) to scale based on metrics stored in CloudWatch.
- The CloudWatch API is not available to developers through the Kubernetes API, so defining resources such as CloudWatch alarms in a Kubernetes manifest is not supported. Instead, you must define those alarms outside of the manifest via AWS CloudFormation or some other automation tool, which is not an ideal Kubernetes-native development experience.
In this post, we will walk through how we solved these two challenges at Southwest Airlines. We also will show how we fit those solutions into a CloudWatch-centric observability solution for our enterprise in a Kubernetes-native way.
Architecture
The architecture used to implement this solution comprises the following elements (Figure 1):
- A Kubernetes CustomResourceDefinition and Operator for CloudWatch alarms to allow Kubernetes developers to define alarms in their Kubernetes manifests.
- The K8s-CloudWatch-Adapter to ingest metrics from CloudWatch into the Kubernetes Metrics Server so that we can scale pods based on CloudWatch metrics natively via the Kubernetes Horizontal Pod Autoscaler (HPA).
- A Fluent Bit daemon set to forward logs from Amazon EKS to CloudWatch so that we can search and visualize our logs in CloudWatch Logs Insights.
- The AWS Distro for Open Telemetry (OTEL) Collector daemon set to forward traces to AWS X-Ray and to forward metrics to CloudWatch metrics. In this example, we use OTEL to forward Prometheus metrics, StatsD metrics, and any other custom metrics developers might create in their Kubernetes manifests. Centralizing all of these traces and metrics in CloudWatch allows us to monitor and visualize end-to-end application health through CloudWatch ServiceLens.
- The CloudWatch agent to collect CloudWatch Container Insights metrics.

Figure 1: Solution architecture.
Defining alarms in the Kubernetes manifest
At Southwest, our Kubernetes developers want to define their entire application in a single manifest, including the metrics and alarms they use to keep tabs on their application health. This capability is fairly straightforward using Prometheus, but creating alarms with Prometheus would require us to provision, run, and maintain a Prometheus Server environment, which can be complex and time-consuming. It would also mean keeping Prometheus metrics in two places (Prometheus Server and CloudWatch), as we want to centralize our metrics in CloudWatch for end-to-end visibility alongside metrics from other sources.
Another option was to define the alarms in CloudFormation. However, this solution was less intuitive for our Kubernetes developers because they had to define their metrics in one place (their manifest) and their alarms in another (a separate CloudFormation template).
We wanted to provide a Kubernetes-native development experience without the additional complexity, cost, and management of deploying Prometheus Server, so we created a Kubernetes Custom Resource Definition (CRD) and Operator for creating, updating, and deleting CloudWatch Alarms directly in the Kubernetes manifest.
Part of the Helm chart deployed in the following sample application contains the controller and all the necessary Kubernetes configurations for it to operate. An example configuration for a CloudWatch Metric Alarm defined using this controller is shown in the following sample. We use alarm actions to notify our ticketing system for alarm scenarios that require human intervention, such as when an HPA configuration nears its maximum number of pods.
Scaling pods with CloudWatch metrics
The challenge related to scaling Kubernetes pods based on CloudWatch metrics is not new, and there are at least two different approaches to solving this problem described in previous Amazon blog posts. One option, outlined in “Autoscaling Amazon EKS services based on custom Prometheus metrics using CloudWatch Container Insights”, is to initiate a Lambda function that runs scaling commands against the Amazon EKS cluster when a metric breaches a defined threshold. The drawback to this approach is that we can’t define the scaling policies declaratively in the Kubernetes manifest. Additionally, this approach runs the scaling commands from outside the Amazon EKS cluster, which introduces additional layers of complexity.
The second option is the K8s CloudWatch Adapter, which is covered in “Scaling Kubernetes deployments with Amazon CloudWatch metrics”. We chose this solution because it provides a more Kubernetes-native approach by using the HPA, which is an out-of-box Kubernetes capability. The adapter provides CloudWatch metrics to the Kubernetes Metrics Server so that the HPA can use it in scaling policies. This approach aligns with our desire to define an entire application within the Kubernetes manifest, rather than relying on an outside resource like Lambda to launch the scaling function.
Sample application
We have provided a sample application to show how we put all of these pieces together to define an application in a Kubernetes manifest and instrument it with end-to-end observability via CloudWatch, including custom metrics, alarms, and scaling policies based on CloudWatch Metrics (Figure 2).
A producer process writes one message per second to an Amazon SQS queue, and consumer processes consume one message every five seconds. An HPA policy is configured to scale the application when the SQS queue depth exceeds 30 messages, and a CloudWatch alarm will alert a human when the application reaches eight pods out of the defined maximum of 10.
The application emits Prometheus metrics (both standard and custom) and a custom StatsD metric for the number of messages sent by the producer. It uses the OTEL Collector to forward traces for both the producer and consumer to AWS X-Ray, and it sends all logs to Amazon CloudWatch Logs.
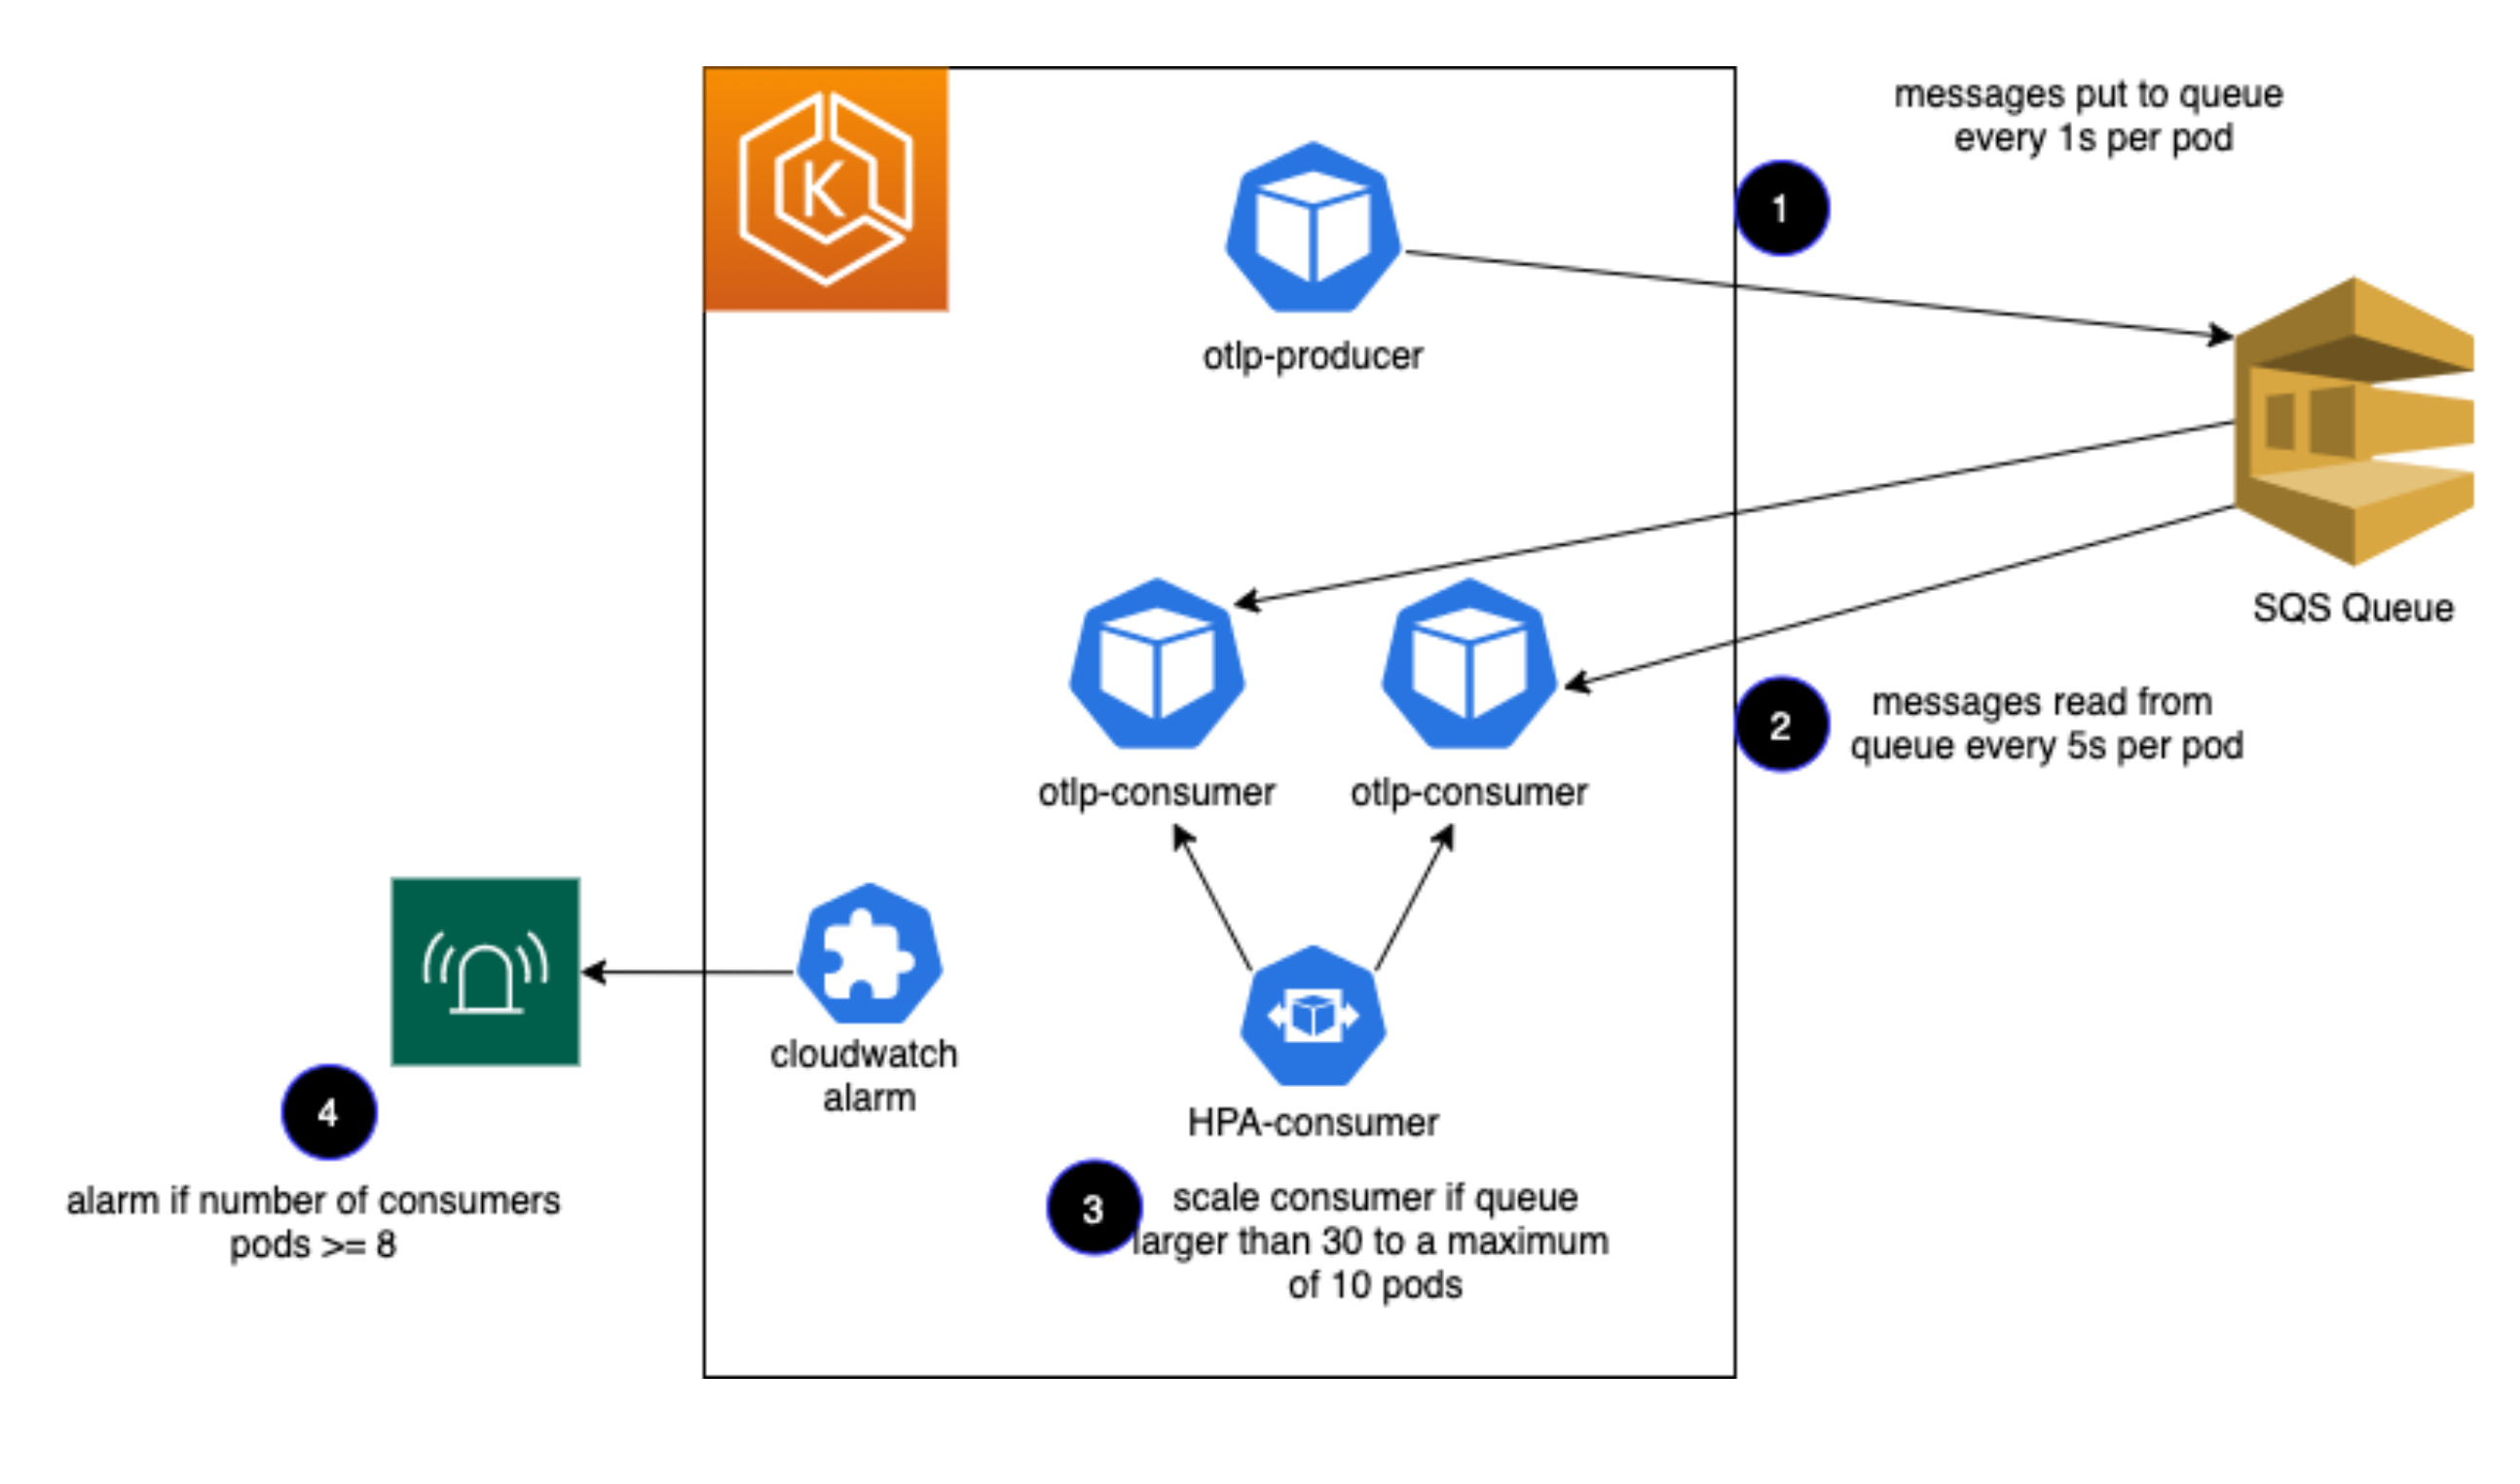
Figure 2: Sample application.
Prerequisites
For this walkthrough, you should have the following prerequisites installed and upgraded to the latest version:
Setup
- Clone the repo amazon-cloudwatch-alarms-controller-for-kubernetes:
- Create an EKS cluster:
- Build and publish the docker files. (Note: You may need to log in to Docker first to avoid Docker’s rate limiting of anonymous sessions.)
- Ensure the build script sets the environment variables necessary for subsequent steps:
- Deploy the Helm chart:
- Deploy the example application:
Metrics
Now that the sample application is deployed and generating custom metrics in CloudWatch, you can visualize them in the EKS/AWSOTel/Application CloudWatch Metrics custom namespace.
- In the AWS Management Console, navigate to the CloudWatch service.
- From the left navigation panel, select Metrics, All Metrics.
- Select the namespace EKS/AWSOTel/Application.
- Select Metrics with no dimensions.
- Select the box next to the messages metric.
- You should be shown a graph like the one in Figure 3, displaying the number of messages produced by the sample application. This is a custom metric emitted by StatsD and forwarded to CloudWatch via the OTEL Collector.

Figure 3: Number of messages produced.
The Amazon OTEL Collector deployed with the Helm chart is also configured to scrape pods and services for Prometheus metrics. The sample application emits custom Prometheus metrics, which can be visualized in the same EKS/AWSOTel/Application CloudWatch Metrics namespace as the StatsD metric.
- Still in CloudWatch, select Metrics, All Metrics from the left navigation panel.
- Select the namespace EKS/AWSOTel/Application.
- Select the Service dimension.
- Check the box next to the message_producing_seconds metric.
- You should be shown a graph like the one in Figure 4, displaying the amount of time it takes to generate the message that it puts on the queue.


Figure 4: Time to generate message.
Scaling
The example application is producing messages to the SQS queue faster than the consumers can consume them. Thus, the queue will grow exponentially. The queue depth is monitored with an Amazon SQS metric, and we can now use this metric to autoscale our application thanks to the K8s CloudWatch Adapter we deployed as part of the Helm chart.
- Allow the application to run for about 15 minutes.
- Run the following command to view the HPA configuration. The configuration shows that it is scaling out additional consumer pods based on the increasing number of visible messages in the queue:
kubectl describe hpa
Figure 5: HPA scales deployment to 5 pods.
- In Figure 5, the HPA scaled the number of consumers up to five within 15 minutes of running the application. The HPA will eventually scale the consumers to their maximum size of 10.


Figure 6: HPA scales deployment to configured maximum of 10 pods.
Alarms
At this point, usually human intervention is needed to investigate the cause of the surge in messages. We can then either increase the maximum allowable pods for the HPA or we can fix the underlying cause of the message surge.
In this case, we will define a CloudWatch Alarm to alert us when more than eight consumer pods are launched. Thanks to the CloudWatch Alarms CRD we created earlier, we can define both the custom metric (service_number_of_running_pods) and an alarm for that metric within the same manifest as the application definition and HPA configuration.
- Navigate to CloudWatch, Alarms, All alarms to view the custom alarm we defined in our manifest. Depending on when you look, the alarm may or may not be in the In Alarm status, as it will take time for the queue depth to grow to the point where the alarm will be triggered.

Figure 7: Custom alarm configured in Kubernetes manifest.
You can respond to this alarm by paging a human, running an automation via Lambda, or with any other action. Once the alarm is triggered, you also will be able to see the alarm from the Container Insights tab of CloudWatch.
- Navigate to CloudWatch, Insights, Container Insights. Container Insights collects, aggregates, and summarizes metrics and logs from our containerized applications and microservices. The graphs and visualizations shown here are provided by enabling the feature on our cluster.


Figure 8: CloudWatch Container Insights dashboard.
Logs
Now that the logs are forwarded, parsed, and indexed into CloudWatch logs, you can search, visualize, generate metrics, and even create dashboards from the logs with Amazon CloudWatch Logs Insights. The example application writes a log entry every time it sends a message or processes a message from the SQS queue. The application logs are written to the /aws/containerinsights/cloudwatch-example-cluster/application log group.
- Navigate to CloudWatch, Logs, Log Insights.
- Run this example query to look at the logs from every pod consuming messages from the queue:

Figure 9: CloudWatch Logs Insights query results.
Tracing
Finally, you can view end-to-end application health for the sample application in the ServiceLens tab of CloudWatch. ServiceLens integrates traces, metrics, logs, alarms, and other resource health information in one place, allowing us to more efficiently pinpoint performance bottlenecks and identify impacted users.
- Navigate to CloudWatch, Application monitoring, ServiceLens map.

Figure 10: CloudWatch ServiceLens Map showing traces for the sample application.
- Drill into either the producer or the consumer stack to see traces for a given application.

Figure 11: Trace details.


Cleanup
To avoid ongoing charges to your account, run the following commands, which will clean up the objects you created:
Also, you will want to clean up the Amazon ECR repos that you created to host the images you built previously:
- In the AWS Console, navigate to the Elastic Container Registry service.
- Select the Public tab.
- Delete the three repos you created:
cw-alarm-operator,otlp-test-consumer, andotlp-test-producer.
Conclusion
Building an end-to-end, CloudWatch-centric observability solution on AWS allows us to achieve the three pillars of observability without configuring and operating several open source tools, without purchasing additional licensed products, and without having to upgrade our observability platform version.
This solution allows our platform developers to focus more on delivering business value and less on tool upgrades and maintenance. There are a few challenges related to integrating CloudWatch metrics and alarms with Kubernetes, and the examples provided in this blog post show one way of overcoming those challenges in the real world for a large organization like Southwest Airlines.

Seth Dobson
Seth Dobson is a Principal Cloud Engineer at Southwest Airlines based out of Dallas, Texas. His interests and experience include serverless technology, containers, and pretty much anything AWS. Outside of work, you can find Seth traveling with his wife and friends, smoking meats on one of his BBQs, or relaxing on the couch streaming shows.