AWS Partner Network (APN) Blog
AI-Driven Analytics on AWS Using Tableau and Amazon SageMaker
By Dylan Tong, Global Segment Lead Architect, AI Augmented Analytics – AWS
By Holt Calder, Data Architect – InterWorks
By Madeleine Corneli, Sr. Product Manager – Tableau Software
 |
Organizations that have foresight into their business have a competitive advantage.
Foresight can enable demand forecasting to optimize the supply chain, inventory, and avoid lost opportunities. It also enables customer churn or employee attrition prediction to help drive proactive action.
Yet, analysts like Gartner report that “87 percent of organizations have low business intelligence (BI) and analytics maturity,” as they are limited to hindsight. Similarly, TDWI’s Analytics Maturity Model defines “The Chasm” as challenges organizations must overcome to benefit from advanced analytics.
Among the leading challenges that stymie analytics maturity is a skill deficit—a problem affirmed by surveys conducted by Gartner, Deloitte, and McKinsey & Company.
Advanced analytics that enable foresight have historically required scarce resources to develop predictive models using techniques like machine learning (ML). The process requires collaboration between data scientists to train and tune models, and data engineers for data preparation and integrating model predictions into analytics.
TDWI research reaffirms the majority of organizations are challenged with the scarcity of data scientists, and they plan to “upskill their business analysts to build [models].”
Traditionally, this is a difficult endeavor, but recent progress in ML automation has made democratization of ML a possibility, creating the opportunity for many Amazon Web Services (AWS) customers who are running their analytics on Tableau Software, an AWS Partner and market leader in BI.
In this post, we will discuss industry trends and the value of augmenting analytics with ML. We’ll introduce you to the Amazon SageMaker for Tableau Quick Start, and guide you through a solution built on this integration.
Our goal is to set you up for success. We’ll leave you with a playbook and resources you can use to create your own artificial intelligence-driven analytics solution.
Amazon SageMaker for Tableau
Tableau and AWS envision a world where all of our customers can benefit from AI-driven analytics. As a first step, we integrated Tableau and Amazon SageMaker to allow customers to blend real-time predictions from AWS-managed models into Tableau visualizations.
We enlisted our mutual partner, InterWorks—an AWS Advanced Consulting Partner with a history of creating commercial products for Tableau—to implement this solution that is production-ready and open-sourced as an AWS Quick Start.
The architecture is as follows:
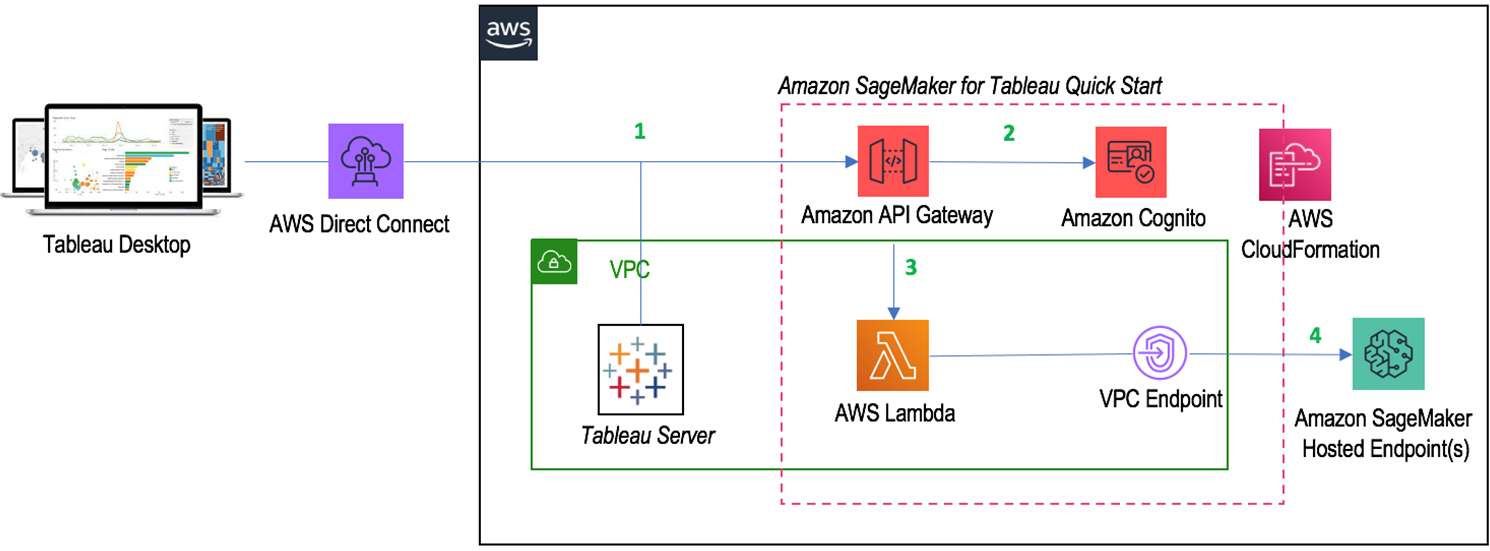
Figure 1 – Amazon SageMaker for Tableau architecture.
- Tableau connects to the solution through APIs managed on Amazon API Gateway.
- API calls are authenticated against user profiles managed by Amazon Cognito.
- As data streams from Tableau, transformations are executed on AWS Lambda. The request format is transformed into CSV, so that Amazon SageMaker Autopilot models can be used without customizations.
- Communication with model endpoints is secured and run through a virtual private cloud (VPC) endpoint. The endpoints respond and predictions are returned to Tableau. Situationally, additional transformations are performed by the hosted endpoints as inference pipelines.
Example Solution
In this post, we’ll guide you through the process of turning data into predictive insights.
This integration allows you to create predictive analytics to support a wide range of use cases, as any ML model can be integrated into Tableau using this solution. However, this post uses a customer propensity solution as an example for you to learn from. Here’s a preview of what you will build.
Our example uses the Bank Marketing Dataset from the UCI Machine Learning Repository. This data was collected by a bank during a marketing campaign.
Let’s imagine you’re a member of this bank’s marketing team, and the team is tasked to run another campaign to acquire more term deposits.
The last campaign was over budget and your team needs to deliver better ROI. You recognize an opportunity to use ML to elevate campaign planning, and you refer to your playbook.
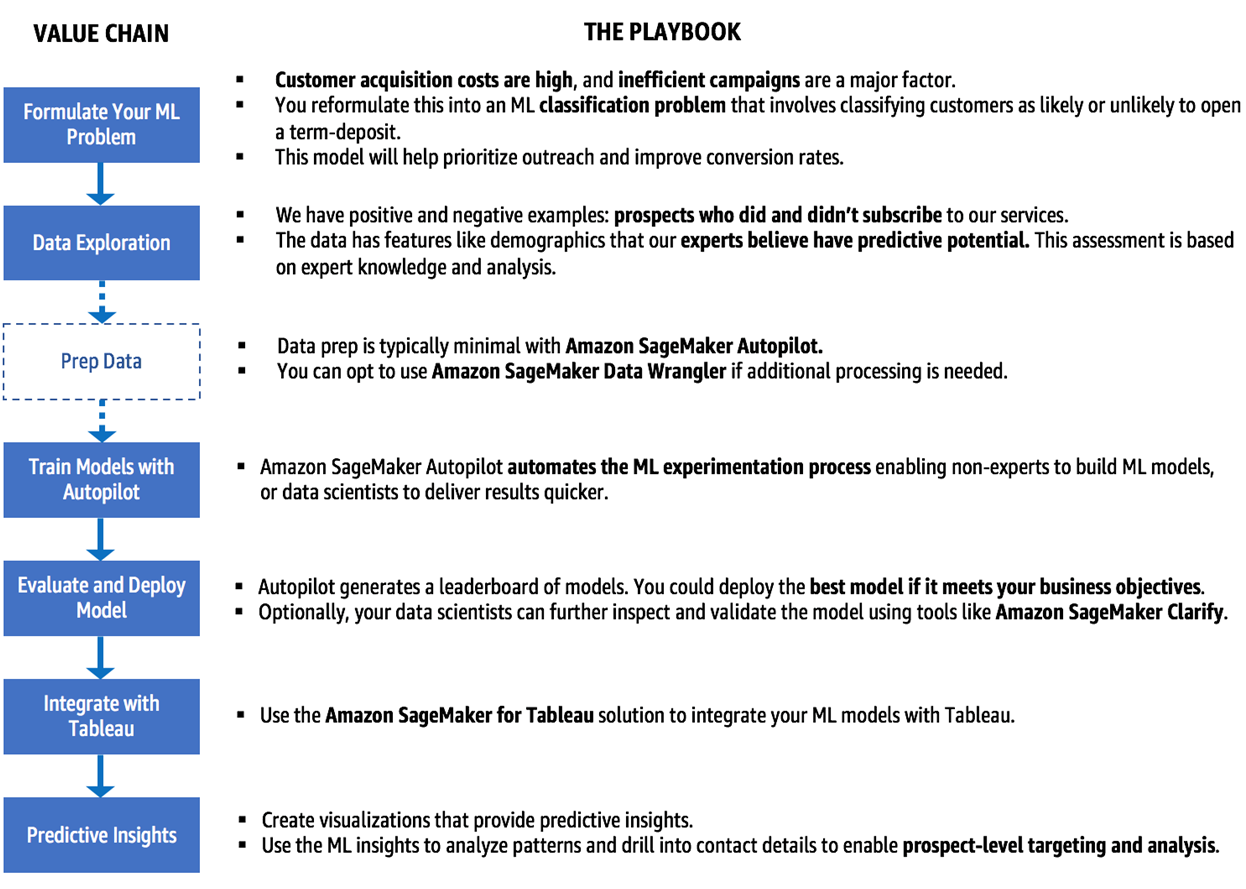
Figure 2 – Value chain for the Amazon SageMaker for Tableau solution.
Formulate Your ML Problem
Your last campaign was inefficient. The conversion rate was low, and too many resources were required to achieve customer acquisition targets. You’ve learnt the basics of ML and understand how to translate this business problem into a regression or classification problem.
Given some features like income and credit history, regression models can predict a continuous numerical value, such as estimating optimal credit limits for borrowers. Classification models, on the other hand, predict the likelihood of a pre-defined category.
For instance, your problem can be translated into a classification problem that predicts whether a prospect will open a term deposit. A classification model, which predicts customer propensity, could help your team improve conversion rates.
You then assemble a team consisting of you as the domain expert, an ML engineer, and representation from cloud IT.
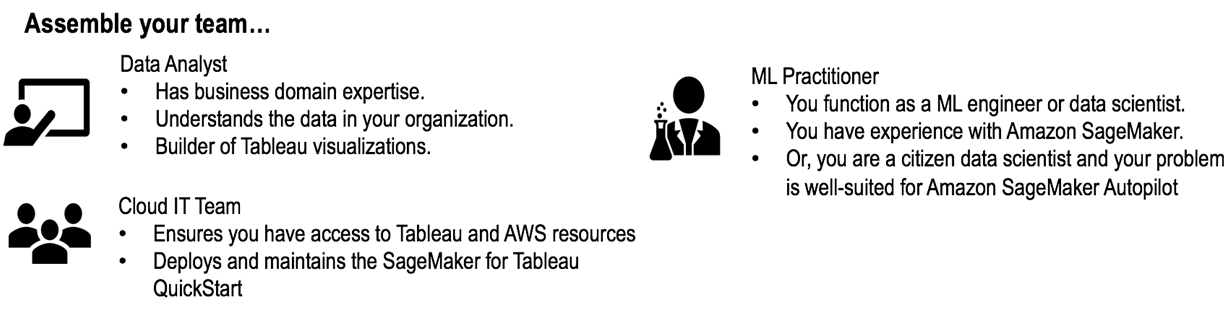
Figure 3 – Skills required by your team.
Data Exploration
As an industry veteran, you possess an intuition for features—such as employment and credit ratings—that could potentially predict a customer’s likelihood of opening a term deposit.
Thinking ahead, you had your team survey customers during the last campaign to augment existing records. This data corresponds to the input variables in the example dataset. Your company has also recorded which prospects opened a term deposit, and this corresponds to the target variable “y” in this dataset.
In short, you have positive and negative examples: customers who did and did not open a term deposit.
Train Models Using Amazon SageMaker Autopilot
Your ML engineer is aware this dataset is prime for Amazon SageMaker Autopilot, a fully-managed service that can create machine learning regression and classification models from tabular data.
Without Autopilot, your team would require data science skills such as data profiling, feature engineering, algorithm selection, model tuning and evaluation, and programming skills. Using Autopilot, your team automates ML experimentation and is only responsible for model inspection.
Although your team has the skillset to deliver a model without AutoML, your engineer opts to use Autopilot to accelerate delivery, and proceeds to configure an Autopilot job by selecting your dataset, target variable, and a model output directory.
Autopilot executes numerous ML workflows for exploring relevant combinations of feature engineering steps, algorithms, and for hyperparameter optimization. Once the job completes, your engineer will deploy the best model from a leaderboard.
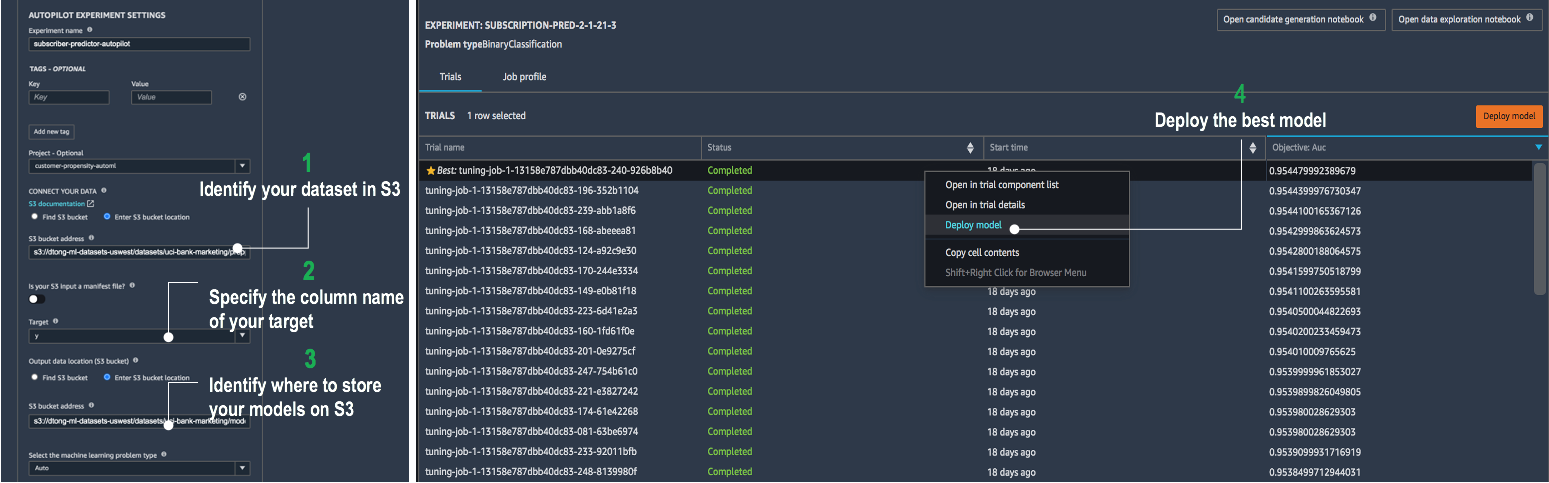
Figure 4 – Amazon SageMaker Autopilot workflow.
Evaluate and Deploy Model
At this point, your team could integrate your Autopilot-trained model into Tableau and create predictive insights. Sometimes, your team may elect to perform additional inspection and improvement steps.
Data Preparation and Analysis
Autopilot automates a great deal of data preparation and feature engineering. However, sometimes manual data pre-processing is beneficial.
For instance, your dataset may have columns that have no predictive value, such as a unique attribute like a phone number. These attributes are ideally removed from the dataset because they may reduce model quality.
Your engineer could use Amazon SageMaker Data Wrangler to perform data exploration and preparation. Upon exploring the dataset, your engineer should discover that missing values are entered as “unknown.”
Autopilot automatically evaluates strategies like imputation to mitigate missing data, but it expects missing values to be blank. Your engineer could create a workflow to correct this, and you should see incremental improvements to predictive performance.
Your team may also opt to practice responsible AI by adding bias detection into your workflow. For instance, your team could decide it’s important the model isn’t biased towards older clientele, as it could influence promotional benefits that younger clients should receive a fair share of. Your engineer can learn how to perform this analysis from this notebook.
Your engineer will also learn how to analyze target leakage risk from the notebook. This analysis helps detect whether your data contains information that won’t be available at prediction time—a model trained on this data will be deceptively effective in development, but will perform poorly in production.
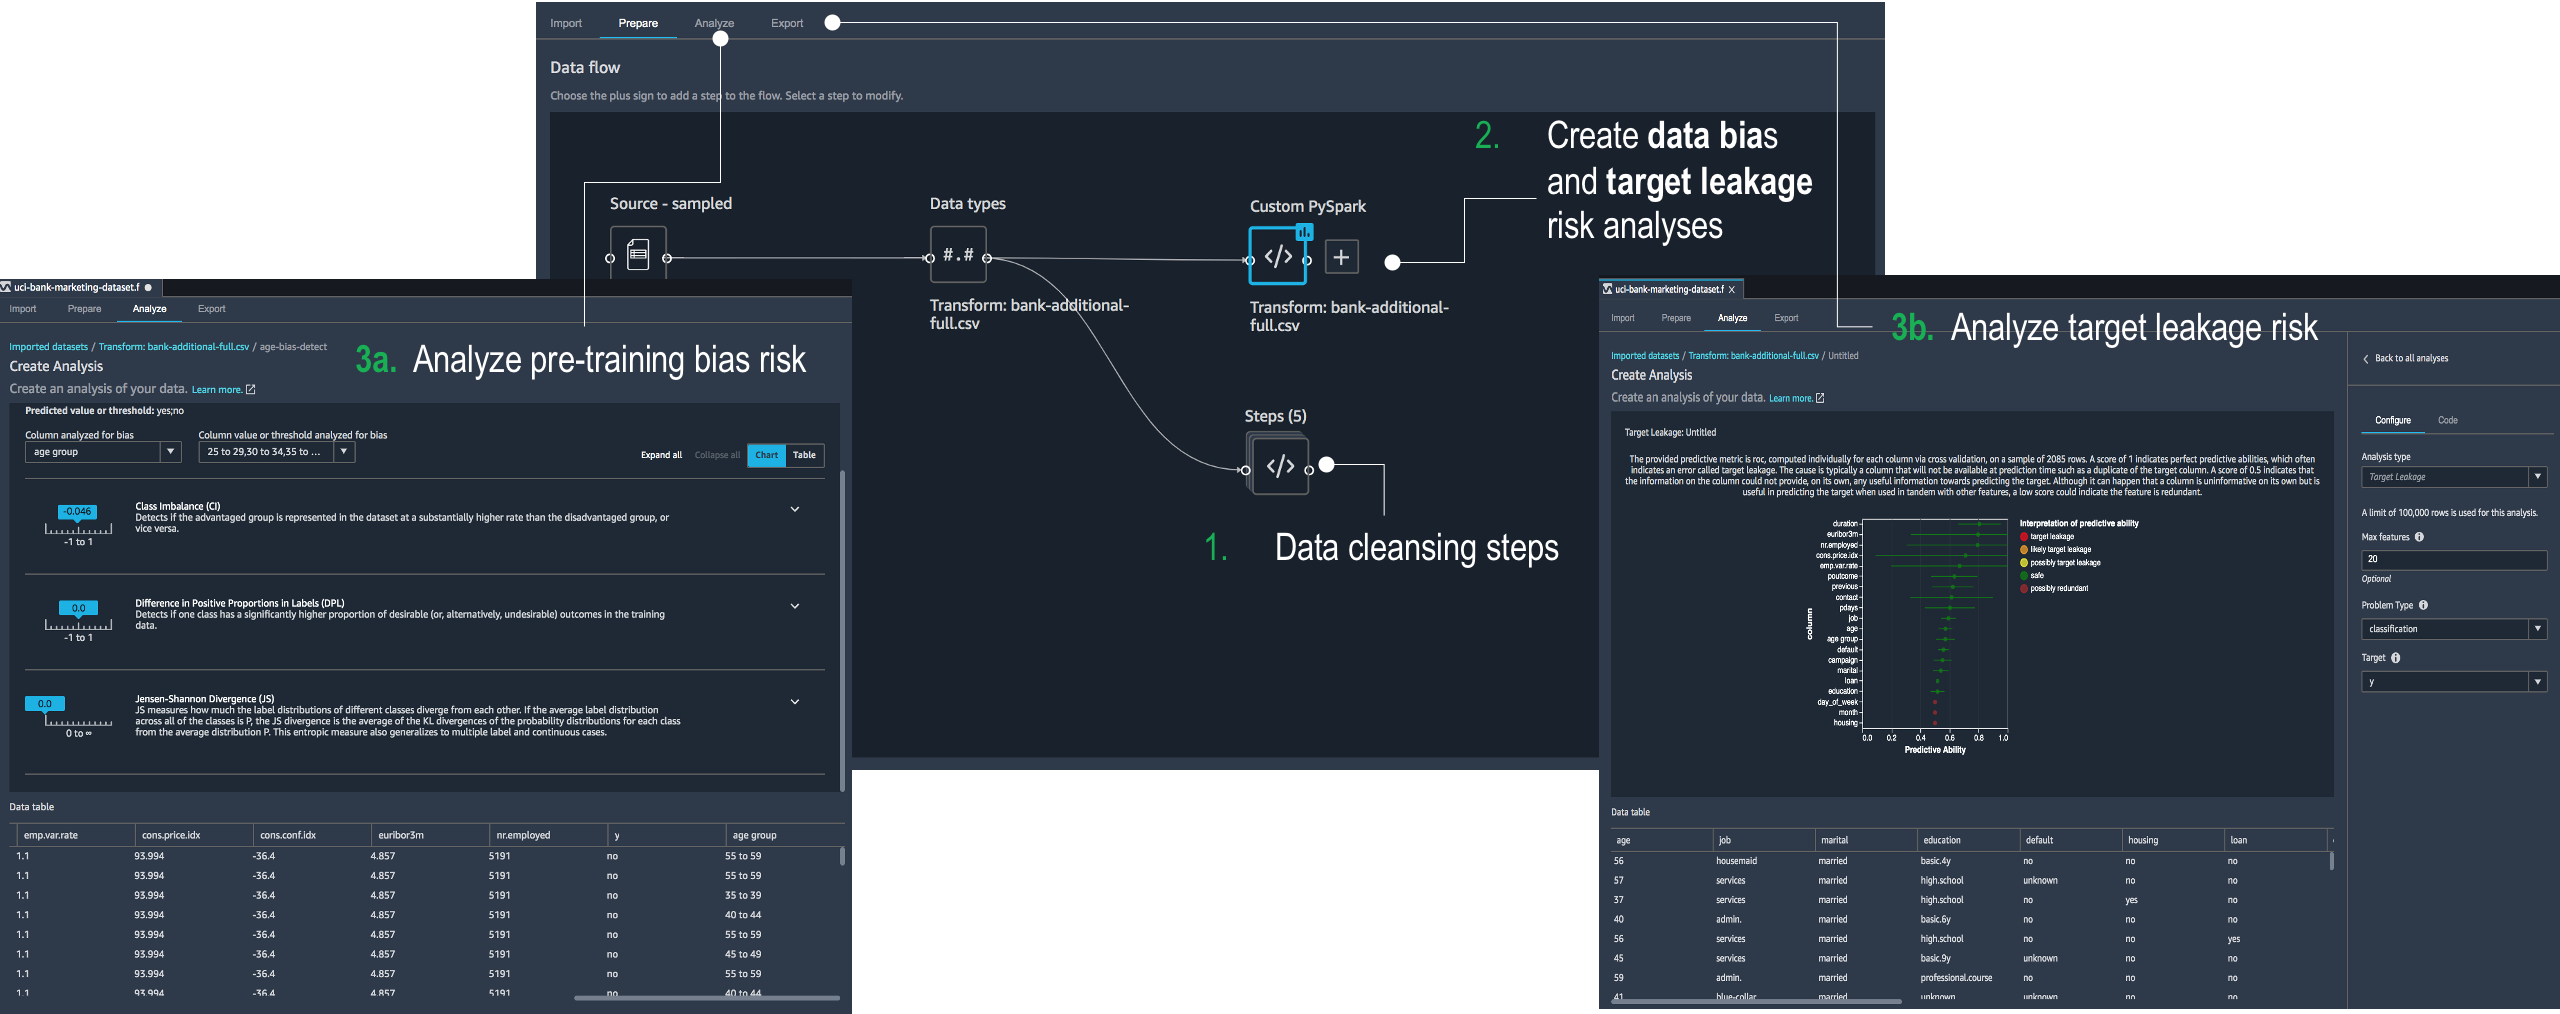
Figure 5 – Improve data quality: inspect for bias and target leakage risk.
Finally, your engineer can export the Data Wrangler workflow and execute it on your preferred processing platform. You can use this workflow to process the example dataset.
Build Trust with Model Insights
Using your prepped dataset, your Autopilot-trained model should have an area under the curve (AUC) score above 0.95. Autopilot provides you with a choice for metrics like accuracy and AUC to optimize your model on.
AUC is a robust option for binary-classification problems, as it represents a probability curve that describes the trade-off between the true-positive-rate and the false-positive-rate. A score of 1.0 represents a perfect model.
Your model may meet your performance expectations. However, your stakeholders may desire more insights into your model before they are willing to trust its predictions.
For instance, your data scientists might desire transparency into your training process. Autopilot can generate notebooks that provide details of the model search space. From these notebooks, your team will learn about the feature processing steps applied to your winning XGBoost model, as well as the competing algorithms that were explored.
Your engineer can reference this notebook to learn how to acquire additional model insights for our example solution. The notebook contains sample queries to analyze the performance of competing algorithms to serve as a comparative performance baseline.
Additionally, examples of granular error analysis and visualizations like the following are provided. Granular insights will help you determine whether the model performs exceptionally in some cases or poorly in others.
These types of insights provide your team with direction on furthering model improvement, and providing users with guidance on how to apply your model.

Figure 6 – Evaluate your model in Amazon SageMaker Studio.
Following the notebook, your team will also learn how to apply Amazon SageMaker Clarify to our example to perform further bias analysis. Additional post-training bias metrics can be used to further mitigate legal risk and enable fair-model-driven decisions.
Model explainability reports could also be generated to analyze overall feature impact based on Shapley values. The report will reveal that employment status has an outsized influence on predictions.
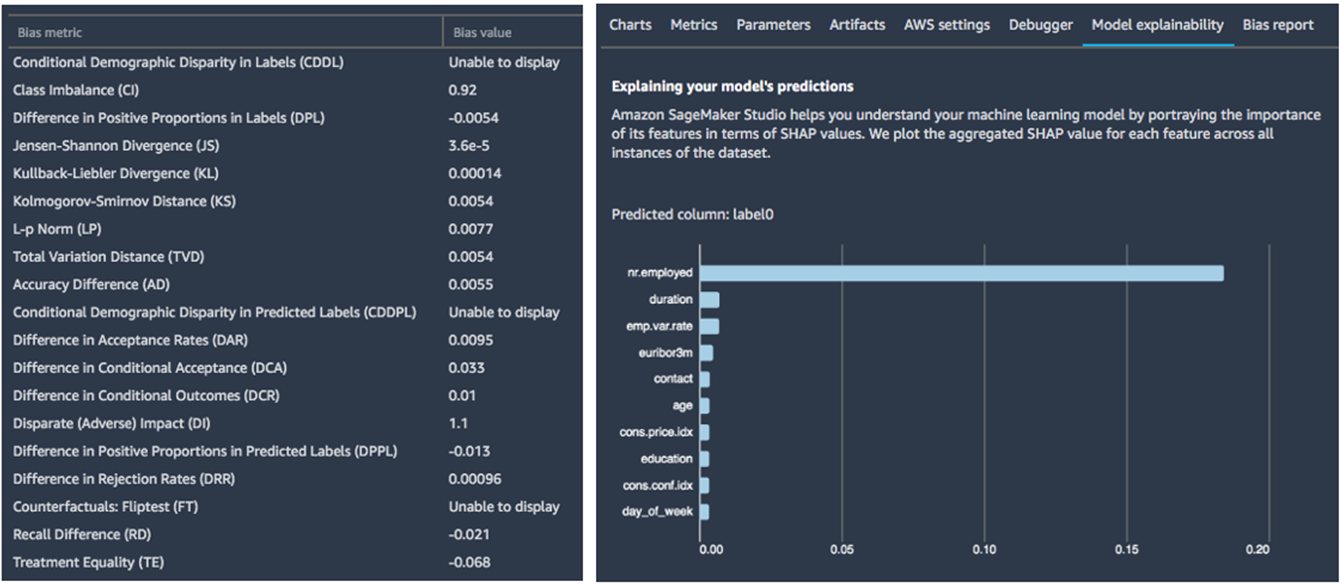
Figure 7 – Amazon SageMaker Clarify enables bias and feature importance analysis.
Clarify generates Shapley values for individual predictions as well. The graph below is an example from the notebook, which provides a visualization of how features influence a single prediction.
The prediction is greatly impacted by the size of the client’s employer, which outweighs the many attributes (like their education attainment) that have an opposing impact.
As a result, the model predicts a 2 percent chance this individual will open a term deposit. With these insights, you can help your users understand the predictions and earn their trust.
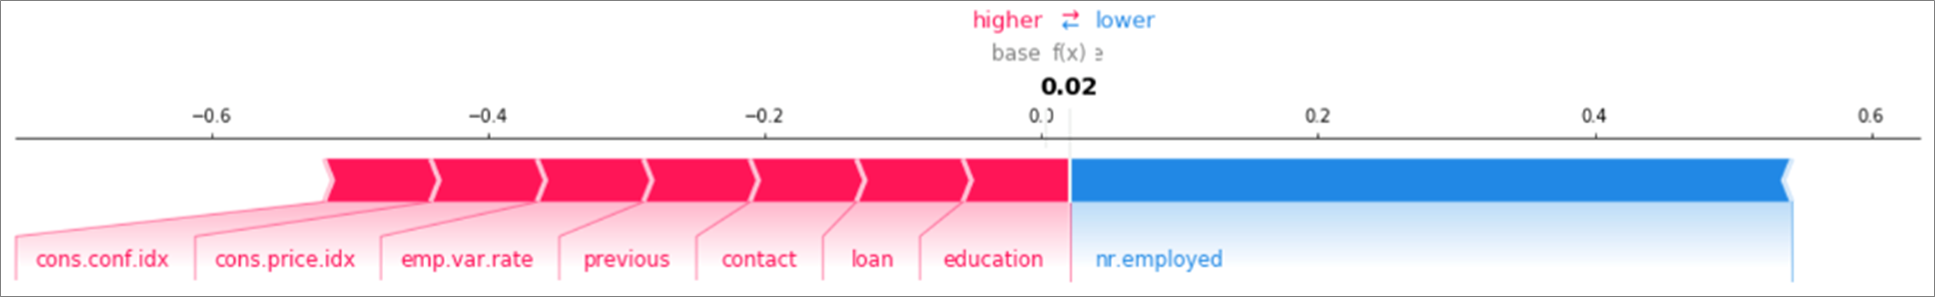
Figure 8 – Understand what influences your model’s predictions.
Through an understanding of bias, feature importance and model error, your team will build a mechanism for navigating continuous improvement efforts. These processes can be automated as part of a workflow as demonstrated in the notebook.
Integrate with Tableau
As your engineer works on building your model, your cloud team will set up your Tableau environment and the Amazon SageMaker for Tableau solution if it hasn’t been done previously.
The solution was built using the Tableau Analytics Extensions API. Thus, it supports any Tableau product supported by the API, including Tableau Desktop, Tableau Server, and Tableau Online.
Your team can create a Tableau environment on AWS using the Tableau Server on AWS Quick Start, or simply use Tableau Online.
Now that your team is ready to integrate Tableau and Amazon SageMaker, familiarize yourself with this deployment guide. In particular, take inventory of the prerequisites, permissions, and deployment options before you deploy the solution. If you need to run in AWS GovCloud (US), refer to the instructions in the FAQ.
When ready, your operations team can one-click-deploy the solution:
In New VPC:
![]()
In Existing VPC:
![]()
The buttons above will deploy the solution in us-east-1 by default, but you use the region selector to change the target region. Ensure that your solution, Tableau environment, and model endpoints are running in the same region.
Once the template deploys successfully, you need to establish connectivity between Tableau and the solution’s managed API as depicted by Step 1 of Figure 1 at the top of this post.
The one-time configuration involves creating users in the provisioned Amazon Cognito user pool to support authenticated API calls, and then configuring an analytics extension connection from Tableau. The deployment guide includes step-by-step instructions.
At last, your cloud IT team has provided you with everything you need to integrate SageMaker hosted models into Tableau.
Predictive Insights
Your predictive solutions will consist of three key ingredients: one or more ML models hosted on Amazon SageMaker; Tableau data sources that correspond to your models; and calculated fields that map your data sources to your models.
At this stage, your engineer has delivered the first ingredient: an ML model. Next, you’ll publish a data source that contains the same features as your training data, and connect to it from Tableau.
Your goal is to augment the raw data with your model results—the likelihood that a prospect will sign up for a term deposit. You can do this by creating a calculated field in Tableau that uses a function to call your model.

Figure 9 – Map your data source to your model endpoint.
The integration expects a SCRIPT_STR expression with two parameters: the name of your hosted endpoint, and the inputs required by your model.
It’s critical that all of the inputs required by your model are included in the calculated field. When you build your visualizations using this calculated field, Tableau will call the model in real-time and pass the data at the granularity you set in the view. If you have more models to integrate, repeat these steps.
The mappings in your calculated field inform the Tableau Analytics Extension about what data to send to your API endpoint, which then redirects the data to the appropriate model to obtain predictions.
The AWS Lambda function in Figure 1 transforms the data sent from Tableau into a CSV format that’s accepted by your Autopilot-trained model. If you choose to integrate models that weren’t trained by Autopilot, you need to package pre-processing logic with your model as an inference pipeline. The deployment guide outlines these requirements.
You can now create powerful visualizations that allow users to consume Amazon SageMaker model results in real-time using Tableau. You can build comprehensive dashboards using these model results.
Tableau makes it easy to scale these dashboards and enhance data across your organization, empowering more users with business-critical information.
Tableau dashboards offer powerful interactivity that makes them both easy-to-use and invaluable for communicating information. The dashboard in Figure 10 below is an example of what you can create with datasets enhanced by the Amazon SageMaker for Tableau solution.
You can summarize customer demographics and offer the ability to drill down into details. In this example, the predictions displayed on the right side of the dashboard are calculated in real-time as the user clicks and filters on the visualizations.
Through the dashboard, your team will gain insights into the most promising prospects allowing your team to take actions to improve your campaigns.
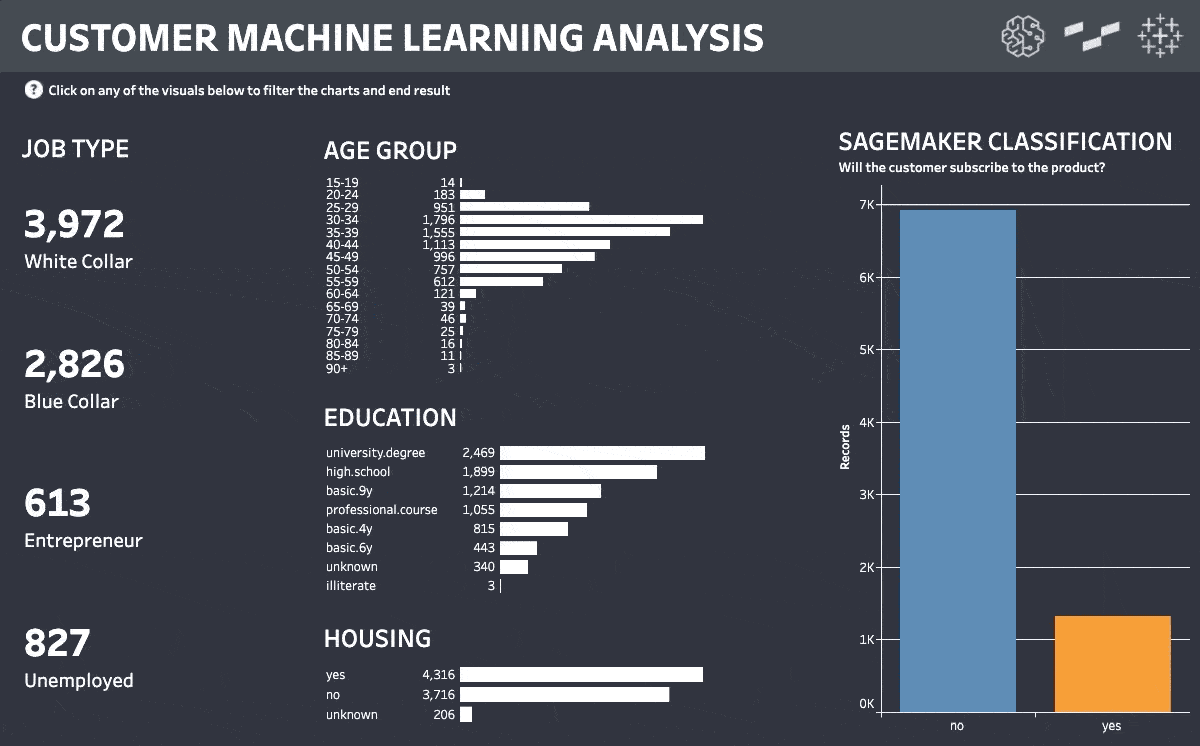
Figure 10 – Real-time predictions are blended into Tableau visualizations.
Summary
Foresight will empower your business with a competitive advantage. In this post, we introduced you to Amazon SageMaker for Tableau to help your organization take a step towards democratizing AI-driven analytics.
We guided you through a solution-building playbook, which you can replicate in your initiatives, and we’ve armed you with tools to automate ML, build trust, and accelerate success.
Amazon SageMaker for Tableau is our first step towards empowering you with self-service predictive insights that are tailored to your business. We look forward to hearing stories about the innovations you create with this integration.
.

.
Tableau Software – AWS Partner Spotlight
Tableau Software is an AWS Competency Partner that helps people see and understand data. Tableau helps anyone quickly analyze, visualize and share information.
Contact Tableau | Partner Overview | AWS Marketplace
*Already worked with Tableau? Rate the Partner
*To review an AWS Partner, you must be a customer that has worked with them directly on a project.