- Industry›
- AWS for Sports
THE DEVELOPMENT OF BUNDESLIGA MATCH FACTS, POWERED BY AWS
Most Pressed Player
A Blog by Simon Rolfes
Simon Rolfes, Bundesliga legend and Sporting Director at Bayer 04 Leverkusen, details the new Bundesliga Match Fact
Between 2005 and 2015 Simon Rolfes played 288 Bundesliga games as a central midfielder, scored 41 goals and won 26 caps for Germany. Currently Rolfes serves as Sporting Director at Bayer 04 Leverkusen where he oversees and develops the pro player roster, the scouting department and the club’s youth development. Simon also writes weekly columns on Bundesliga.com about the latest Bundesliga Match Facts powered by AWS. There he offers his expertise as a former player, captain, and TV analyst to highlight the impact of advanced statistics and machine learning into the world of football. Here, Rolfes, together with Bundesliga data scientist Gabriel Anzer, will analyze the importance of some of the new Bundesliga Match Facts powered by AWS that fans can see during the 20/21 season, and Luuk Figdor of the AWS Professional Services team then details the AWS technology used behind these advanced stats.
Modern football is getting faster and defenses are increasingly using pressure as a tactic. But for coaches or TV analysts, it is hard to support the decision when or against whom to press, with data, especially in real-time. Until now, it was not possible to quantify the pressure received by a player. That is all changing now, thanks to the work of AWS and Bundesliga.
The latest Bundesliga Match Fact powered by AWS, “Most Pressed Player,” quantifies defensive pressure encountered by players in real-time. This allows commentators, football analysts, fans, and teams to compare how some players receive pressure vs. others and the ways this is impacting the game. We can now see how often a player in possession is being pressured by opponents. We can compare this to the average number of pressure situations faced by his teammates. So we can tell which players have to escape pressure situations most often and which players are mostly left alone on the pitch. Most Pressed Player shows how often a player is receiving significant pressure by his opponents by measuring the number of opposing players, their distance to the player in possession, as well as the direction of every players’ movement.
Another angle to look at the new Most Pressed Player insight is that analysis in matches – data driven or not – mostly focuses on strategies when a team has ball possession. But teams behave drastically different from each other when they don’t have possession. With the introduction of the numeric pressure framework behind Most Pressed Player, we can start to measure defensive off-ball actions. This will deliver new information to fans and help them to better understand defensive strategies.
The Most Pressed Player is created using an algorithm which estimates pressure on the player in ball possession as a number based on data points such as the position of this player, his orientation and the position of his opponents. AWS uses cloud computing technologies such as AWS Fargate, AWS Lambda and AWS DynamoDB to compute this number during every moment of the match. If the calculated pressure value exceeds a certain threshold, fans will see it on-screen during a match. Every ball action of a player in which he is under significant pressure is counted. Every player then has a pressure count containing the number of pressure situations he faced.
While this particular blog goes deeper into how the AWS team worked with Bundesliga to bring the Most Pressed Player to life, let’s not forget the other two Match Facts also being released now – “Attacking Zones” and “Average Positions: Trends.” We’ll dive deeper into each of these in the coming weeks, but as a sneak peek: check out each of these videos on the main Bundesliga page to get an overview about these new insights.
Bundesliga Match Facts powered by AWS: Most Pressed Player
Luuk Figdor, data scientist and a member of the AWS Professional Services team who worked with Bundesliga to bring these Match Facts to life, will now explain how this advanced stat came to fruition.
- Simon Rolfes
Most Pressed Player explained
Julian Nagelmann’s RB Leipzig are known for their prowess when applying pressure. Take for example Yussuf Poulsen’s goal against FC Augsburg on Matchday 4. In the events leading up to the goal, Leipzig applies increasingly higher pressure during Augsburg’s supposedly safe build-up play. This directs Augsburg towards the sideline, and as soon as Raphael Framberger receives the ball, he is put under immediate pressure. He barely manages to pass the ball to his teammate, putting him in a bad position, which results in a turnover. Leipzig strikes quickly from the turnover – within two passes and a magnificent finish they extend their lead to 2-0. All because of increased pressure.
A coach’s match plan has many of considerations that can lead to victory, including which player to pressure, or when and where to pressure. Now, with the new Most Pressed Player we can see exactly which player is being targeted and being put under pressure most frequently. For the above-mentioned match, we see that Raphael Framberger was among the top three most-pressed players on his team with 30 pressed ball possessions, about 7% more than his teammates.
The pressure mechanism
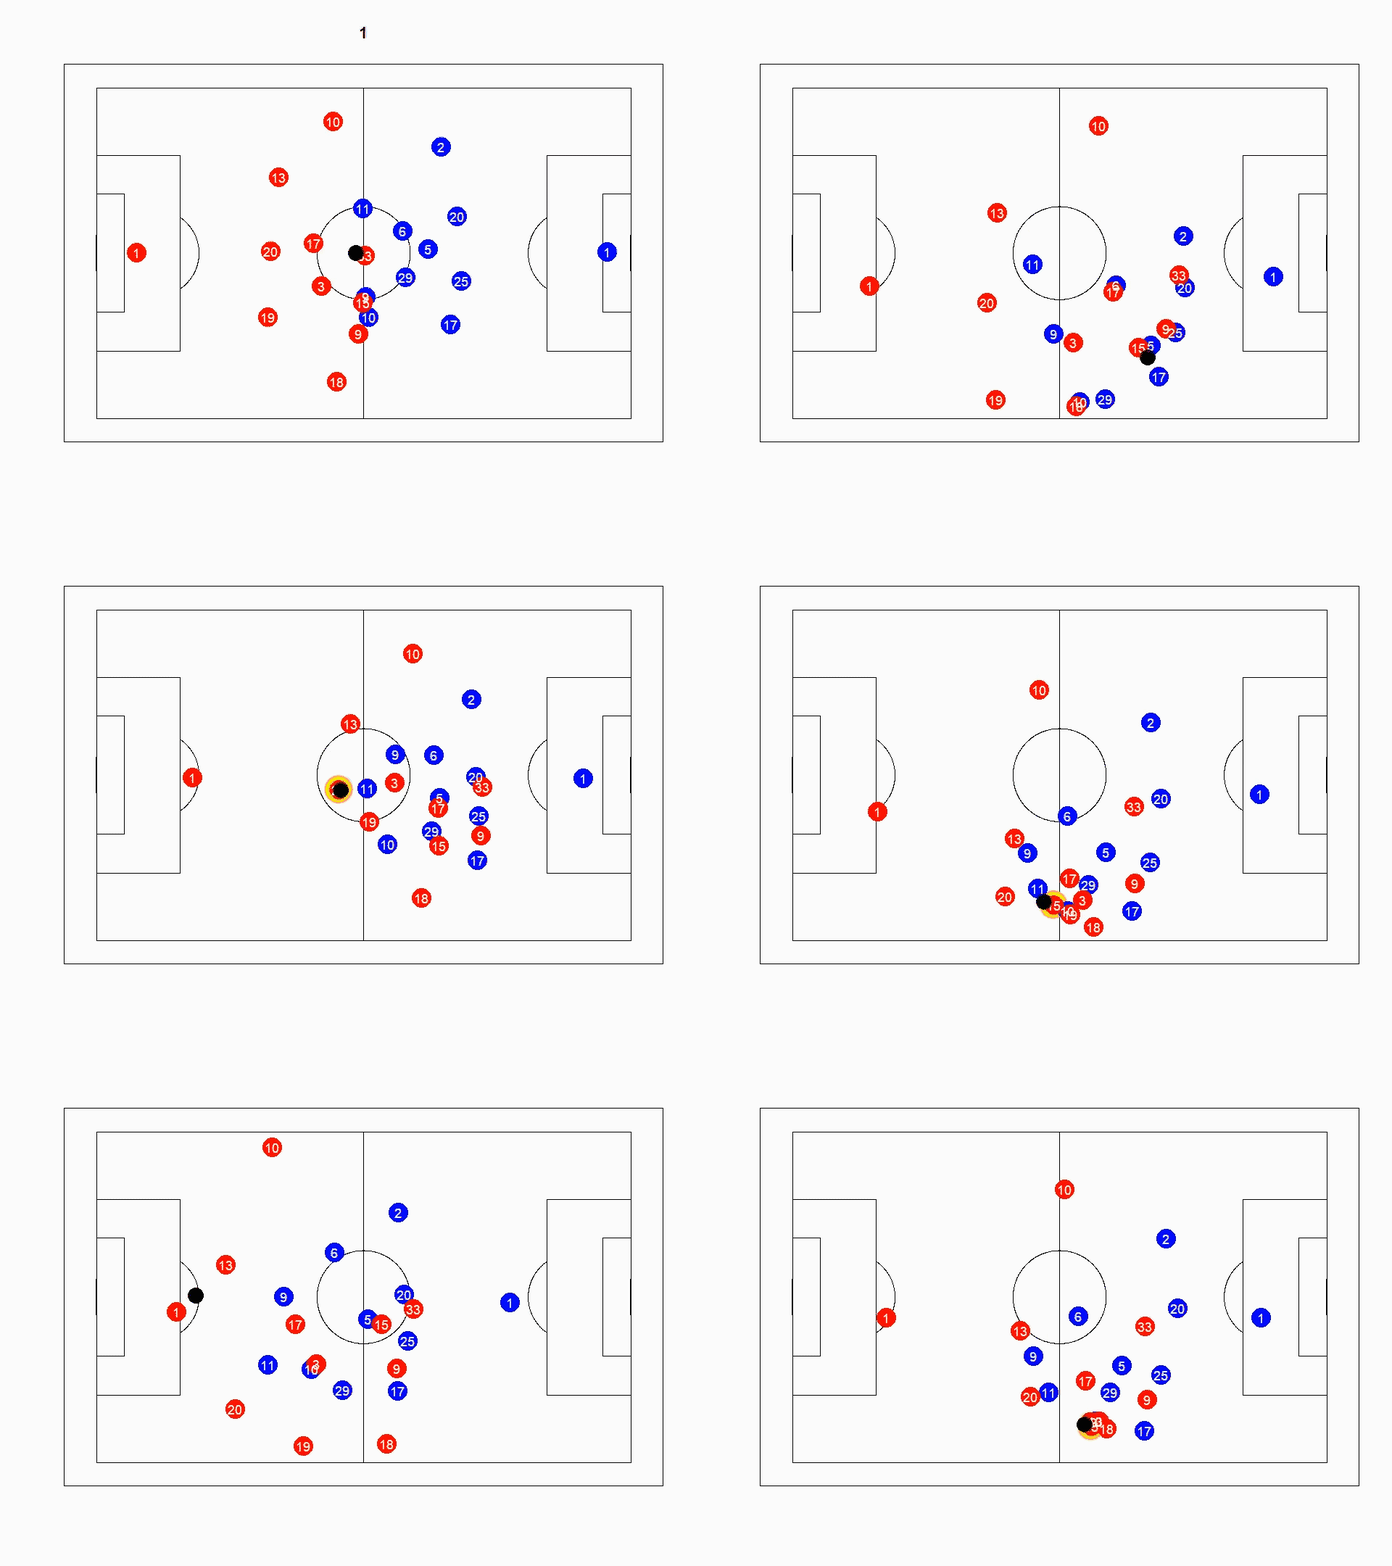
Now that we’ve seen how pressure can be used to understand the game at a deeper level, we can go one step further and explain how it is calculated. Recent advances in technology have enabled high quality tracking of positional data. Positions of players, referees, and the ball are tracked through the entire match at a high temporal resolution (25 Hz). This allows us to evaluate the positions of all players 25 times every second, resulting in approximately 3.2 million to 3.5 million positions that are evaluated each match. These positional packages can be used to construct a map of all players and the ball on the pitch of any given moment in time.
Once we have this positional map the next step to calculate pressure is to determine which player is in possession of the ball. Individual ball possession (IBP) is calculated using an adapted version of the algorithm first proposed by Link et al. It roughly works as follows, a player is in ball possession if he is the closest player to the ball, the distance between the ball and the player is less than 2 meters, and the ball is no more than 2.5 meters from the ground. These constraints must be satisfied for at least 3 consecutive frames (120ms) and within this possession a ball contact must have occurred. This is defined as a change in direction of the ball trajectory by at least 15 degrees. Using the IBP algorithm, we can add ball possession to the positional map to view which player is in ball possession at which point in time.
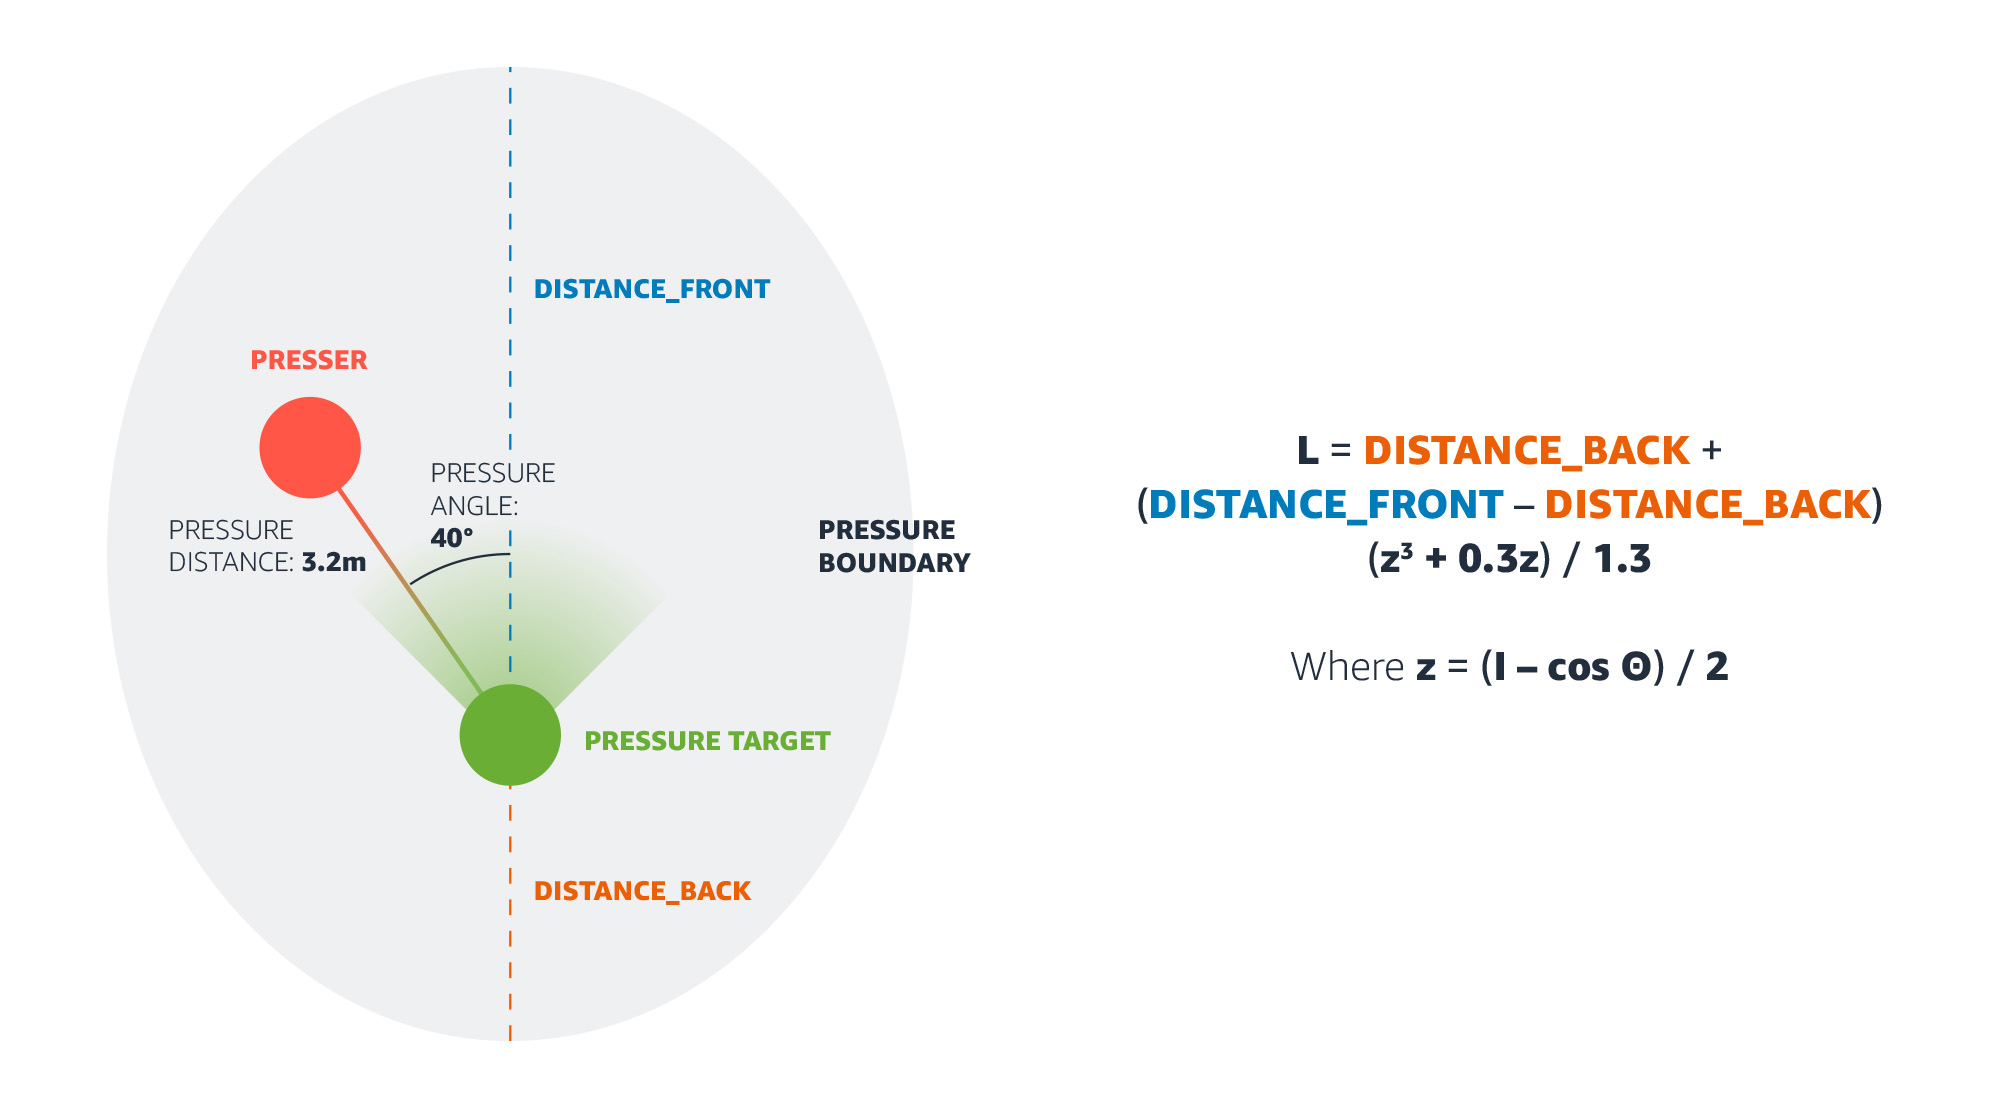
Once we know which player is in ball possession in a given frame, we can compute the frame based pressure on that player exerted by players of the opposing team. To compute pressure on a frame-by-frame basis we adopted an approach similar to the work by Andrienko et. al. Pressure in this approach is based on the location of the player in ball possession, the locations of the players direct opponent(s) and the direction he is facing. This is done by computing a so-called pressure zone around the player in ball possession. The pressure zone is the area around a player target in which he can receive pressure. The boundary of this pressure zone is based on the orientation of the player and can be specified as a parametric curve with 2 parameters: distance_front and distance_back. The parameter distance_front refers to the maximum distance on which a pressure target can be pressed in the direction he is facing. A player applying pressure can approach the pressure target from multiple angles. As the absolute angle (Θ) increases with respect to the pressure target’s orientation, the maximal distance for pressure decreases and reaches a minimum when Θ = ±180◦. For example, when the presser is behind the pressure target, which in turn is equal to the distance_back parameter. The distance limits for the pressure zone are determined by a formula which approximates an oval shape in polar coordinates (Θ, L).

Figure 1: x,y player and ball coordinates visualized on a football field for a sequence of timestamps. Player in ball possession is highlighted in yellow.
The maximum pressure that can be exerted by a player pressing on his intended target is 100%. This is applied if the pressing player is precisely on the location of the pressure target. Once the pressure zone is quantified, we can compute the pressure for any point in the pressure zone. For this we need two more parameters: d that resembles the distance from the presser to the pressure target, and q is the exponent that regulates how fast the pressure decay’s with distance. Using these parameters, we can establish the following formula to compute pressure applied to the pressure target for a given frame.

Pressure target
The formula above provides a way to calculate the pressure applied by one player on a pressure target for one frame (40ms). However, players may be pressured by more than just one presser. In these instances, we sum the pressure applied by all players applying pressure to get a total pressure score at a given moment in time. Thus, pressure values may exceed 1.
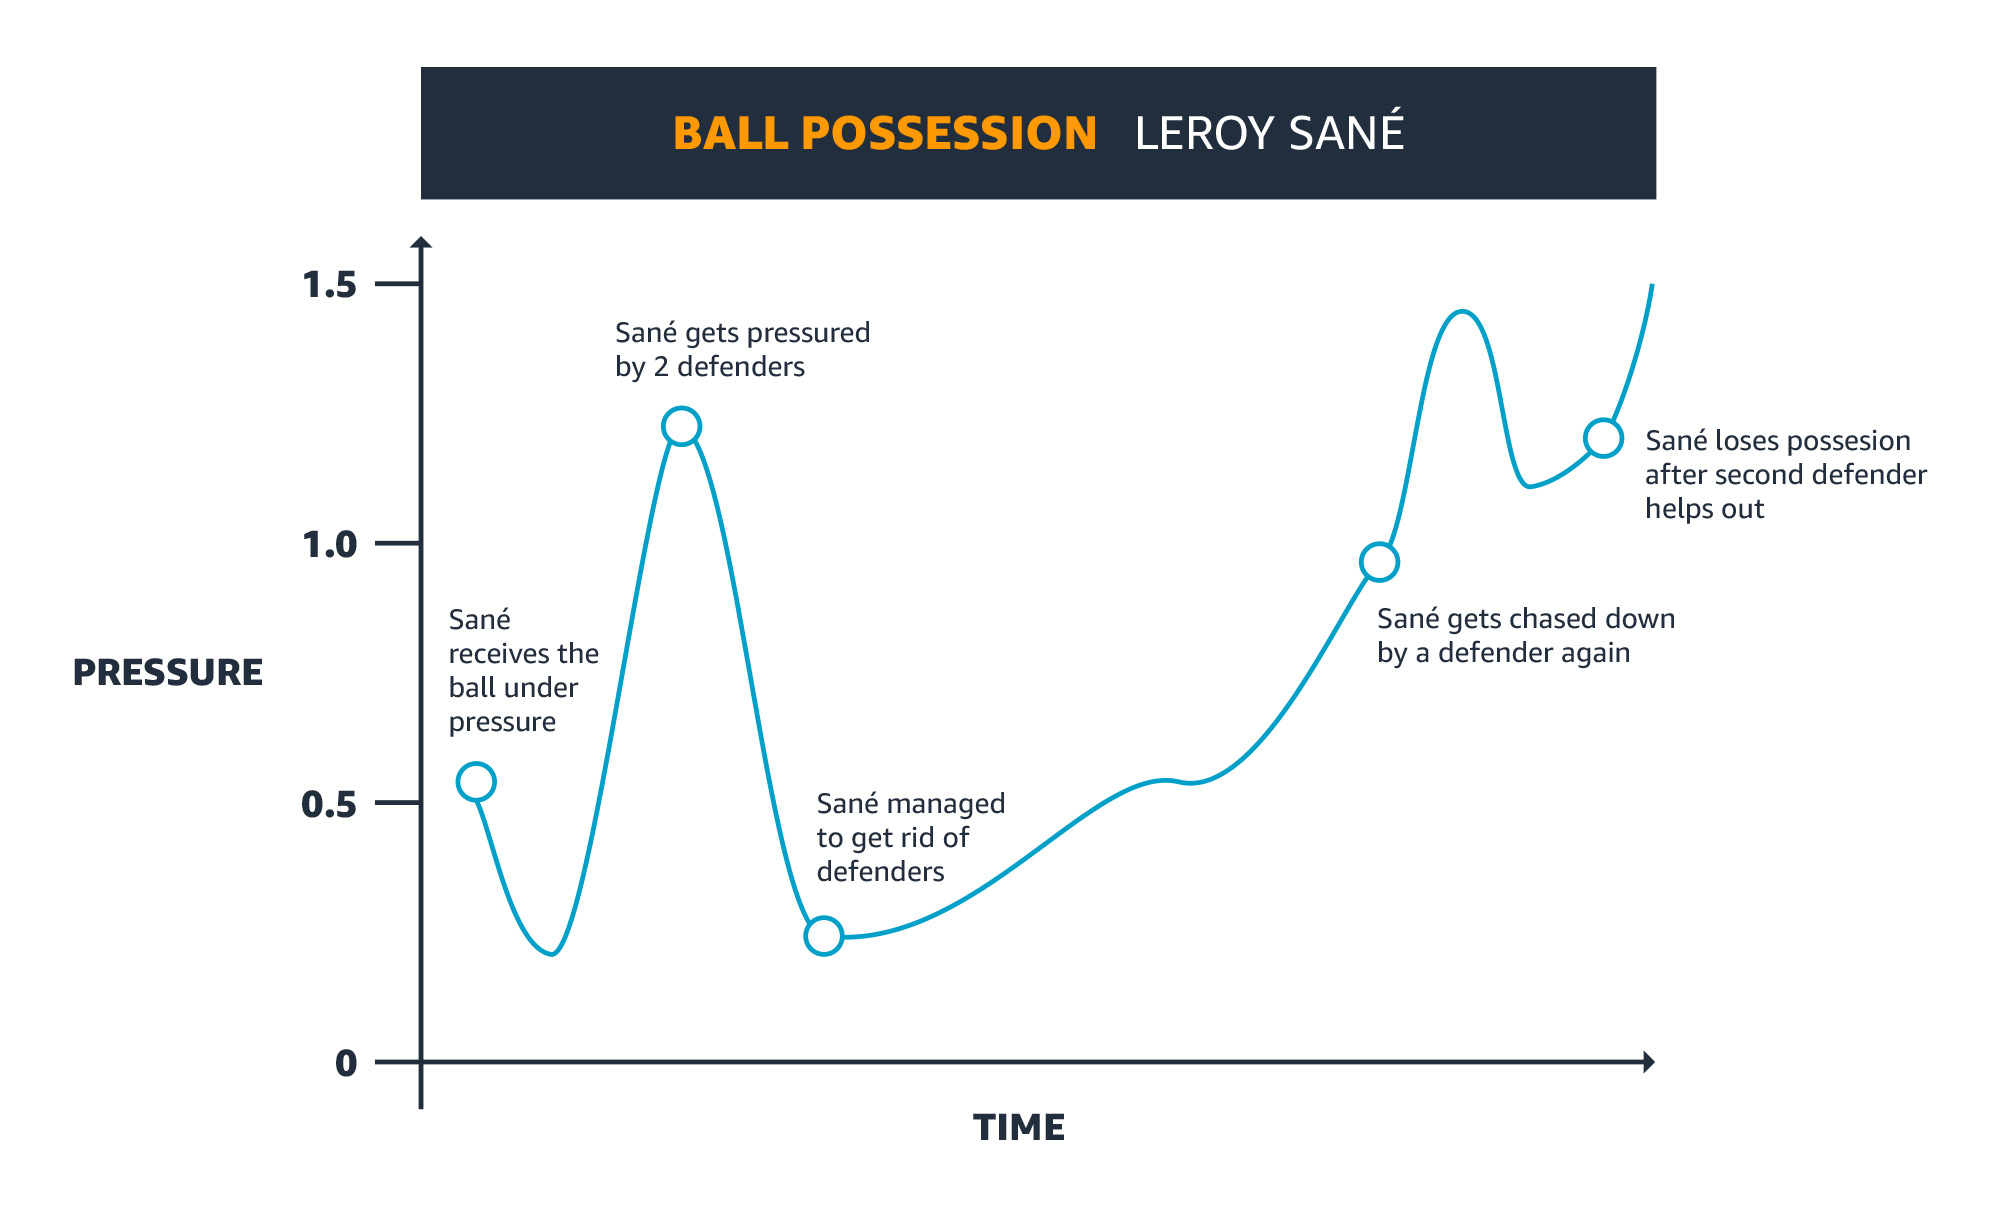
The pressure scores for all frames in a ball possession can be concatenated to understand how pressure is developing during a ball possession phase of a pressure target and find out how the player is able to handle this pressure. We can illustrate this by using an example of the match between FC Bayern (FCB) and SV Werder Bremen (SVW) from Matchday 8.

Ball Possession
In this example, Leroy Sané, a winger for FCB, received the ball in the midfield under significant pressure. While he tries to free himself, two midfielders from SVW immediately apply pressure to him hoping to regain possession. However, Sané manages to cut himself loose from the pressure and moves rapidly towards the SVW goal. Arriving at the box area, as he gets ready for a shot on goal, he is chased down by a defender. A second defender comes to aid and they manage to win the ball back from Sané before he can shoot. This is just one example how pressure can be used to better understand the game. The Most Pressed Player statistic provides the Bundesliga, its teams, and the fan a way to evaluate for the first-time which players are pressured with respect to their team and how this is affecting their performance.

Summary
The pressure framework allows the fan to finally evaluate off-ball actions and zoom in on defensive strategies that long remained a mystery. Fans are able to see which player is pressed most in ball possession and this is just the beginning. The Most Pressed Player is a brilliant new advanced statistic that brings an added level of understanding to the game. We hope that you have as much fun with the output of this new statistic as we have had putting it together.