The Internet of Things on AWS – Official Blog
Digital Twins on AWS: Unlocking business value and outcomes
Every day, we hear from our customers about the desire to implement Digital Twins to improve operations, product offerings, and business value delivered to their own end customers. The concept of twins is not new and dates back to the early days of the space program. The Apollo 13 mission in the 1960s is an early use case of using twins to model the state of the damaged spacecraft and solve the problems necessary to return the astronaut crew safely back to Earth. In more recent times, the core ideas of Digital Twin as applied to product lifecycle management (PLM) are commonly attributed to Grieves who developed the concept throughout the 2000s, and Vickers who coined the term Digital Twin in 2010. Customers today are seeking to deploy Digital Twins across a broad range of applications including engineering design of complex equipment, 3D immersive environments, preventive maintenance, operations of industrial facilities, precision medicine, digital agriculture, manufacturing, city planning, and most recently metaverse-type applications.
A challenge, however, is that the term Digital Twin is often applied broadly to describe any virtual model, inclusive of traditional methods such as engineering simulations, CAD models, IoT dashboards, or gaming environments. This has caused confusion for customers who are left pondering how simply renaming existing methods will drive new business value. To clarify, Digital Twins are more than just a new marketing term for legacy methods, but rather a new technology that has only become feasible in the past few years with the convergence of at-scale computing, modeling methods, and IoT connectivity. As you embark on your Digital Twin journey, the first place to start is to understand what a Digital Twin is, how to integrate existing modeling methods into Digital Twins, and how to work backwards from your business use case to deploy the correct technology for your solution.
To help customers navigate this space, we developed a framework that enables practitioners to understand their use cases and achieve the business value they are seeking. The first part of this framework is a concise definition of Digital Twin, and the second is a leveling index to help customers categorize their use case and understand the services, technologies, data, and models needed to build and deploy their Digital Twin at scale.
In this first part of our blog series, we will focus on our definition and leveling index for discussing Digital Twins along with example use cases for each of the levels. Subsequent blogs will demonstrate each of the levels in detail by working through an example of an electric vehicle.
Defining Digital Twin
In understanding our customers’ interpretations of Digital Twins, we found a range of concepts including analysis of a single physical component, predictive maintenance for a piece of equipment, performance optimization of a process, 3D virtual walkthroughs of a factory with automated operations, and everything in between. What these ideas all have in common is that a Digital Twin consists of a digital representation of something in the physical world, is updated with live data, and drives business outcomes. With this backdrop, we define Digital Twin as follows:
A Digital Twin (DT) is a living digital representation of an individual physical system that is dynamically updated with data to mimic the true structure, state, and behavior of the physical system, to drive business outcomes.

The four key elements of a Digital Twin are the physical system, the digital representation, the connectivity between the two, and the business outcome. The first element, the physical system itself, can be an individual physical entity, an assembly of physical entities, a physical process, or even a person. It also doesn’t have to be an industrial system, as it could be biological, chemical, ecological, or any other system. The second is the digital representation which is the model itself. In this case, by model, we don’t mean just a collection of data such as a data model, which is needed to represent the structure (or configuration) of the physical system, or an IoT data dashboard, which is helpful to represent the current state of the physical system. We mean a model that emulates the behavior of the physical system, such as a simulation, so that when you give it an input, the model returns a response output. This leads to the third element, connectivity, which is emphasized by the reference to “living.” The model must be regularly updated with data from the physical system (say, from sensors) to be a Digital Twin. A validated model provides a snapshot of behaviour of the physical system at a moment in time, but a Digital Twin extends the model to timescales where the physical system’s behaviour changes significantly from the original time. The frequency of the updates is dictated by the rate at which the underlying phenomena evolves. Some use cases require near real-time updates, whereas other use cases require only weekly updates. Lastly, the Digital Twin must drive a specific outcome – some kind of economic or business value.
The key difference between a Digital Twin and existing modeling methods such as traditional 3D modeling (CAD), physics-based simulations, virtual worlds (3D/AR/VR), IoT dashboards of streaming sensor data, and realistic gaming environments is the information flow between the digital and physical systems. A common misconception is that a more complex, higher fidelity virtual representation is what makes a Digital Twin. Rather, it is the regular updating that is key, and directly impacts how data is collected throughout the life cycle and how the Digital Twins are constructed. A Digital Twin must consume the data streams to understand the present state of the system, learn from and update itself (or be updatable) with new observations of the system, and be able to make predictions of the current and future behavior of the system.
For example, a Digital Twin of a gas turbine blade ingests temperature and pressure IoT data to predict crack length, a non-observable quantity during operation. Visual borescope inspection results from periodic maintenance are used to update the Digital Twin. The Digital Twin is then used to make predictions of crack growth rate and remaining useful life (RUL) under different operational conditions and maintenance scenarios, enabling the operator to select the best dispatch schedule and maintenance plan. Output from the Digital Twin such as the crack length or RUL can then be shown to the user via a dashboard, a 3D rendering showing the crack in-situ, or some other context-relevant manner. Although the CAD models, IoT dashboards, 3D renderings/immersive walkthroughs, and gaming environments are not Digital Twins in themselves, they represent useful visualization building blocks of Digital Twin solutions, and often represent the first steps in a customer’s Digital Twin journey.
Why Is now the time for Digital Twins?
As we look at the definition of Digital Twin, we begin to understand four key technologies needed to develop and deploy Digital Twins at-scale: data from the physical system, IoT connectivity, modeling methods, and at-scale computing. Each of these have been developed in parallel over the past 20 years, and its only in the 2020s, however, that we’re seeing the convergence of these technologies needed for Digital Twins at scale.

The first technology has to do with measurements. With IoT sensors in particular, the average cost has dropped 50% from 2010 to 2020, and continues to decrease. Measurements that were cost-prohibitive just 10 years ago are now becoming a commodity. This will continue to drive more sensors gathering even more data. Second, is the ability to transmit this data so it can be analyzed and actioned on. If we look at wireless connectivity as a proxy, in 2010, 3G was the de-facto standard at less than 1 Mbps. Throughout the 2010s, it was replaced with 4G at 100 Mbps, and now 5G at 10 Gbps is becoming the norm. That is more than a 10000x increase in transmission speed. And 10 Gbps happens to be a milestone threshold for IoT devices as it is fast enough to gather IoT data in near-real time (<10ms latency).
The value of Digital Twins is using this data to derive actionable insights, which is achieved by modeling and at-scale computing, representing the third and fourth key technologies. The term “model” here is used in multiple contexts. For applications involving predicting future states and what-if scenario planning, we need scientific modeling techniques for predicting various phenomena (its behaviour) such as fluid flow, structural deformation, biochemical processes, weather, and logistics. Methods including machine learning, high performance computing, and hybrid approaches such as physics-inspired neural networks are becoming practical to deploy at scale because of compute power available. Another type of modeling is used for visualization and creating realistic immersive environments. Over the past decade, the advancements in the algorithms for spatial computing to create and manipulate 3D content is enabling immersive augmented reality, virtual reality, and the metaverse.
Lastly, the power of at-scale computing has been greatly enabled by the cloud. We’ve seen compute power grow exponentially, both at the chip level itself, as well connecting the chips all together for massively scalable cloud computing, to the point where massive-scale, on-demand compute is becoming a commodity. No longer limited to governments and large corporations, now small startups and even individuals can access the necessary compute to innovate, invent new products and services, and improve our daily lives.
Putting context to Digital Twin use cases in the leveling index
In our discussions with customers, we’ve found a wide breadth of use cases requiring different AWS services, technologies, and data needed to enable them. To help our customers navigate this space, we developed a Digital Twin leveling index with 4 levels: 1/ Descriptive, 2/ Informative, 3/ Predictive, and 4/ Living, with Level 4 consistent with the definition described earlier. Levels 1 through 3 apply to different use cases with varying levels of complexity, with each driving their own business value. In many ways, this leveling index is analogous to what we see in the self-driving cars space, which uses an L0 through L5 system, where L0 is manual driving, L1 is cruise control, and L5 is a true autonomous self-driving car with no steering wheel. As a customer, mapping your use cases to the proper level will help you understand specific services and patterns that can accelerate business value and provide a roadmap for future growth.

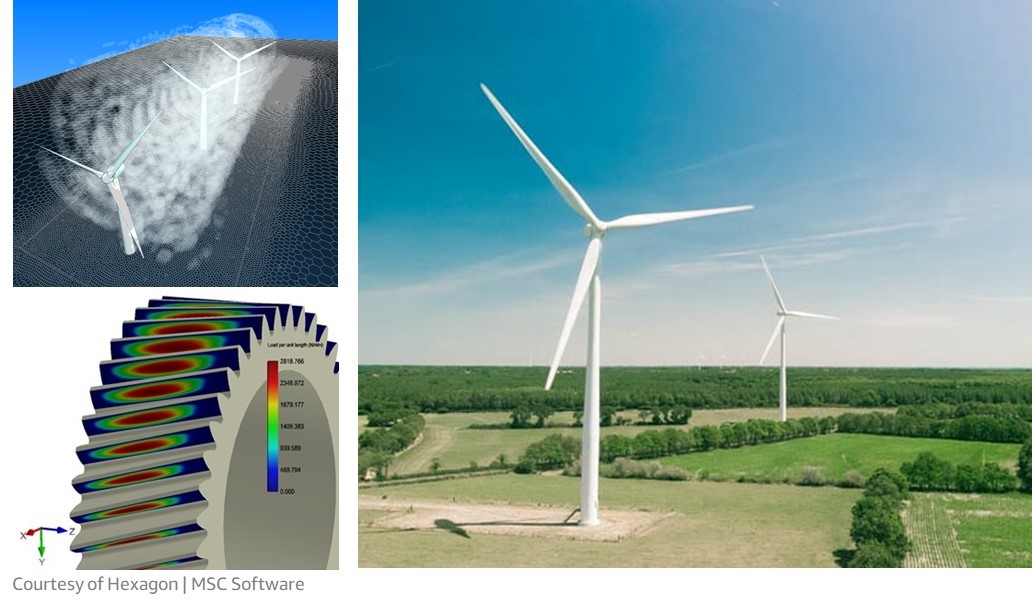
L1 Descriptive focuses on the engineering design and the visual representation of the physical system (its structure). It can be a 2D engineering diagram (such as a process or P&ID diagram), a building information model (BIM), or a complex high-fidelity 3D/AR/VR model. It also includes engineering analysis performed such as 1D analysis, systems dynamics, computational fluid dynamics, and structural mechanics. The purpose is to understand the design of the physical system and its components.
Typical use cases include assessing new designs, assessing reconfigurations of brownfield sites, and personnel training under different scenarios. As an example, L1 includes the system analysis of a wind turbine, the CFD analysis of the air-flow over the blades, as well as the 3D/VR rendering or immersive walk-through of the inside of the wind turbine. For the engineering analysis use-cases, key AWS High Performance Computing (HPC) related services and solutions, which include AWS Batch, AWS ParallelCluster, Elastic Fabric Adapter (EFA), Amazon FSx For Lustre, NICE EnginFrame, and NICE DCV, in addition to compute optimized EC2 instances (e.g. Hpc6a, C5n, C6i, P4d). For immersive (AR/VR) use-cases, customers can leverage our Spatial Computing solutions including 3D asset management and partner solutions for AR/VR training (Motive, Innoactive), AR worker assist (Scope AR), immersive collaboration (Cavrnus), XR streaming (HoloLight, NVIDIA CloudXR), and location-based experiences (Immersal).
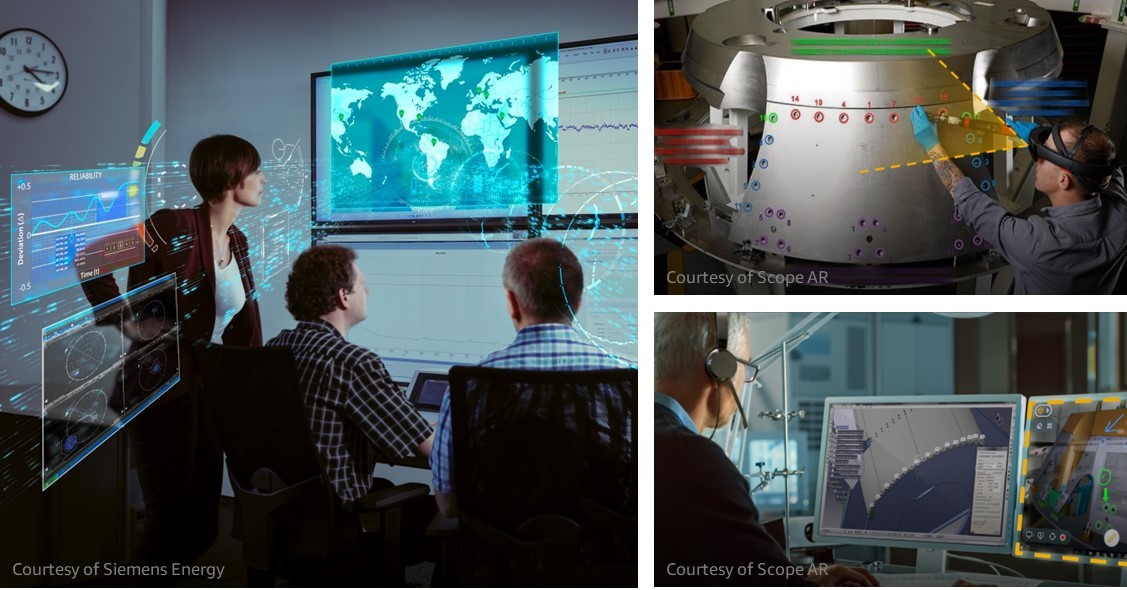
L2 Informative focuses on integration of IoT sensor and maintenance data from the physical system and displaying it to the end-user in a context-relevant manner, such as a 2D dashboard or a 3D contextual visualization (e.g. its state). It enables the end user to understand the present condition of the physical system and can include simple analytics to trigger alarms. In the industrial world, this is the domain of IoT and Asset Management integrated with enterprise asset management (EAM) or enterprise resource planning (ERP) systems to show asset configuration, maintenance history, and upcoming work orders on a single pane of glass.
Typical use cases are around real-time monitoring and alarms, root-cause analysis, and personnel training. As an example, L2 includes an IoT dashboard or 3D rendering showing gearbox temperature data with rules-based alarms as the wind turbine operates. Another example is an augmented reality (AR) overlay of engineering data and service history for a technician using a mobile device/tablet or wearing AR glasses while doing repairs, along with the ability to remotely beam what they’re seeing in real-time to a remote expert who provides further assistance. This might sound futuristic, but it’s happening today, with one of our AWS partners, Scope AR, offering this augmented reality visual knowledge capability to their end customers in the aerospace, energy, manufacturing, and healthcare industries. As you look to build your L2 Informative application, some of the key AWS services include AWS IoT TwinMaker, AWS IoT Core, AWS IoT Greengrass, AWS IoT SiteWise, AWS IoT Analytics, Amazon QuickSight, Amazon Textract, Amazon Rekognition, Amazon DynamoDB, and Amazon S3.
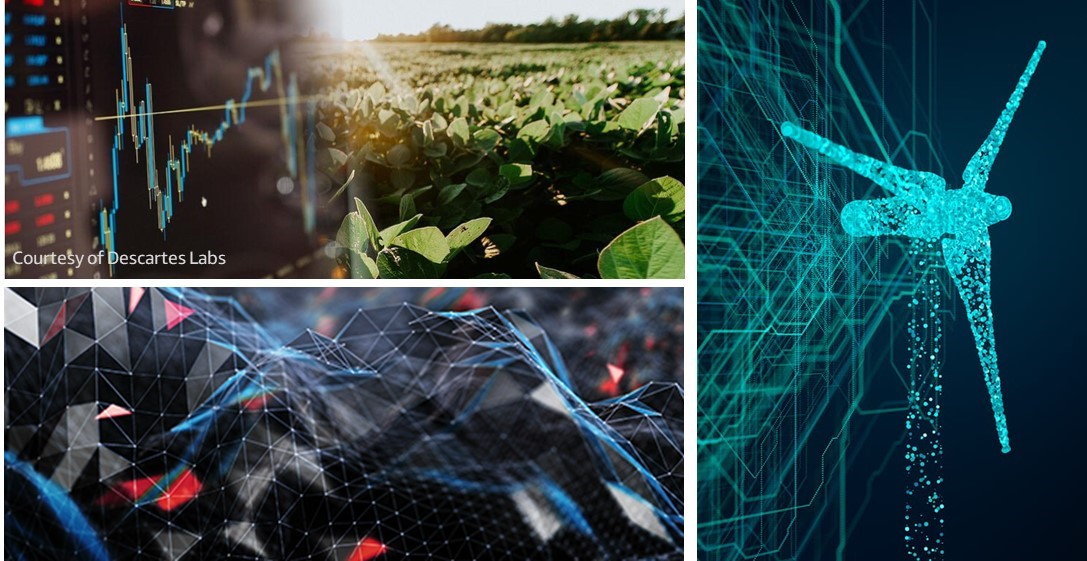
L3 Predictive focuses on predictions of unmeasured quantities (e.g., virtual sensors, machine learning based anomaly detection), as well as using predictive models to understand future states under continued operations where the future behaviour is the same as past behaviour. These models can either be based on scientific first principles, purely data-driven (e.g., using AI/ML), or a hybrid of the two.
Typical use cases include operational planning and predictive maintenance (Asset Performance Management) as well as Fleet Management. As an example, L3 includes hybrid models to predict quantities such as health (virtual sensor), and predict remaining useful life (RUL) under continued operations. The predictions from the models can be displayed in context-relevant visualizations (e.g., 2D dashboard/3D/AR/VR) from L1. A unique example is in agricultural commodity markets. AWS supports one of our customers, Descartes Labs, which uses satellite imagery to analyze crop health at continental scale coupled with price, supply & demand, and other market data to produce commodity market forecasts. These forecasts are used by their end customers to decide the best hedging or trading strategies – which can easily translate into millions of dollars of savings or trading profits. As you build your L3 Predictive applications, key AWS services include our Industrial AI portfolio (Amazon Lookout For Equipment, Amazon Lookout for Vision, Amazon Monitron, AWS Panorama), as well as our AWS High Performance Computing (HPC) related services, Amazon SageMaker, AWS Deep Learning AMIs, and AWS Deep Learning Containers for building and deploying your own custom machine learning models.
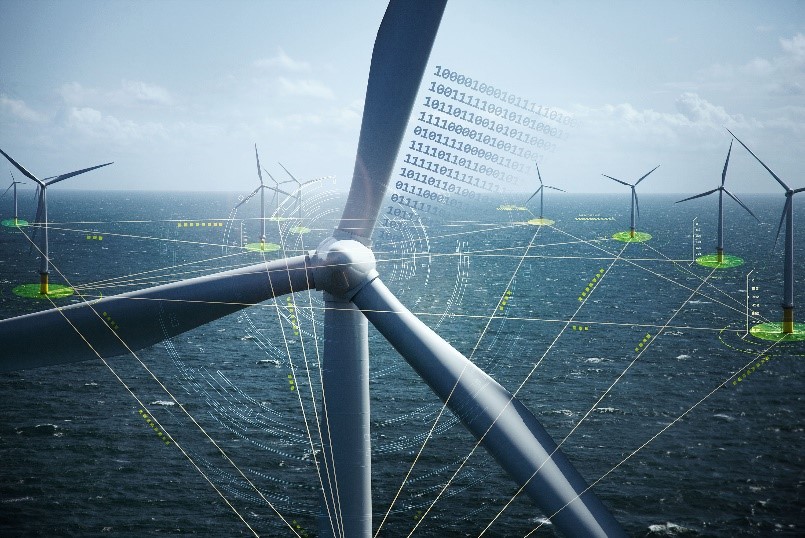
L4 Living focuses on updatable models to drive actionable insights at the individual entity level that can be aggregated to the fleet level if desired. The L4 level represents the culmination of the Digital Twin journey, consistent with our complete definition of Digital Twin. The key distinction between L3 Predictive and L4 Living is the ability for the model itself to be updated based on the data from the physical entity and environment. From a business perspective, the model update capability of an L4 Digital Twin extends its use to timescales over which the behavior of the physical system changes significantly, whereas an L3 Digital Twin is useful for predictions at a moment in time (or very short time-scales thereafter). One way to understand is that a predictive model trained on historical data is, by definition, inaccurate the day it is deployed, since the change in the physical system is not in the training data set. Using this inaccurate model for a forward prediction, in practice, results in a large propagation of error such that the prediction becomes useless over time.
Typical use cases includes scenario (“what-if”) analysis and prescriptive guidance on best actions to take. As an example, L4 includes a prediction of wind turbine gear box RUL along with the prediction uncertainty. The parameters within the model (e.g., shaft misalignment, bearing wear, lubrication film thickness) are updated based on IoT data to accurately reflect the degraded state, as opposed to its initial state when new. This model is then used in scenario analysis to determine the best preventative maintenance plan. Building out L4 Living Digital Twins is best accomplished using a variety of probabilistic estimation methods (which we will describe in a future blog), and the core AWS services needed will be Amazon EC2, Amazon S3, Amazon DynamoDB, AWS Lambda, Amazon SageMaker, AWS Deep Learning AMIs, and AWS Deep Learning Containers.
What’s Next for Digital Twins?
Today, many of our customers are still early in their Digital Twin journey. They are working hard to connect their data across disparate sources and be able to contextually visualize that data in a dashboard or an immersive environment (L2 DT). To date, the first applications have been highly customized and only make financial sense for high value use-cases such as the operations of jet engines, powerplants, and industrial facilities. Over the next few years, we expect to see services such as AWS IoT TwinMaker lower the costs and simplify the deployment. This commoditization will drive adoption across a broad range of everyday contextual visualization use-cases. In parallel, we also expect to see the advanced predictive modeling methods (L4 DT) become more readily accessible for targeted high-value use cases. Today, these methods are currently available in the academic literature and are being used by niche R&D teams. Eventually, these methods will also become mainstream and easily applied for every-day use-cases, allowing anyone to make an L4 living Digital Twin. To begin this L4 DT journey, we will publish open-source code that we will describe in a future blog so that our customers can begin their exploration.
Summary
In this blog, we provided an overview of the AWS definition for Digital Twin, as well as the L1-L4 Leveling Index to help customers categorize their use cases. In future blogs, we will walk through an Electric Vehicle (EV) example to demonstrate L1 Descriptive, L2 Informative, L3 Predictive and L4 Living Digital Twins.
About the author
 |
Dr. Adam Rasheed is the Head of Autonomous Computing at AWS, where he is developing new markets for HPC-ML workflows for autonomous systems. He has 25+ years experience in mid-stage technology development spanning both industrial and digital domains, including 10+ years developing digital twins in the aviation, energy, oil & gas, and renewables industries. Dr. Rasheed obtained his Ph.D. from Caltech where he studied experimental hypervelocity aerothermodynamics (orbital reentry heating). Recognized by MIT Technology Review Magazine as one of the “World’s Top 35 Innovators”, he was also awarded the AIAA Lawrence Sperry Award, an industry award for early career contributions in aeronautics. He has 32+ issued patents and 125+ technical publications relating to industrial analytics, operations optimization, artificial lift, pulse detonation, hypersonics, shock-wave induced mixing, space medicine, and innovation. |