AWS Storage Blog
How Proscia built unlimited observability with Amazon S3 and the Altinity Kubernetes Operator
At scale, observability often claims significant IT spend. Futurum found that 36 percent of enterprises now spend more than $1 million a year on it, and Cribl estimates observability already consumes 3-7 percent of IT budgets today, rising past 15 percent for a third of enterprises by 2027. With the emergence of AI, Gartner predicts that large language model (LLM) observability will reach 50 percent of generative AI deployments by 2028, up from just 15 percent today. Modern applications and microservices continuously produce telemetry data through logs, spans, and metrics. Retaining this data is essential for compliance, auditing, and incident response. As data grows, organizations might need to evaluate whether an enterprise observability solution or an in-house one is the best long-term choice for their business.
Amazon S3 has compliance certifications spanning HIPAA, PCI-DSS, FedRAMP, and SOC. Amazon Elastic Kubernetes Service (Amazon EKS) helps teams build, run, and scale production-ready applications across any environment with the reliability and security of AWS infrastructure. ClickHouse delivers fast query and low-cost, tiered storage for large volumes of events. Together, these services can offer the foundation for a self-hosted observability solution where retention cost is decoupled from event volume. Telemetry lands in S3 at object storage economics while the analytical engine can run on EKS alongside existing workloads. This is the foundation Proscia built on, under some of healthcare’s strictest compliance and scale requirements.
Proscia is a pathology AI company running gigapixel-scale medical imaging pipelines on AWS. Their Concentriq platform powers drug discovery, development, and diagnosis, and is used by 16 of the top 20 pharmaceutical companies and laboratories that manage 12 million patient cases per year.
Concentriq runs on AWS across multiple AWS Regions globally to support strict compliance requirements, including HIPAA, PHI handling, GDPR, and Data Residency. Proscia’s observability solution had to meet both the scale and compliance needs. This post shares how they built a self-managed observability solution using AWS infrastructure, AWS Partner Altinity’s Kubernetes Operator for ClickHouse, and open source tooling.
Benefits of a self-hosted solution
When Proscia evaluated what they needed from an observability solution, the team focused on key capabilities first:
- OpenTelemetry-based – A vendor-neutral collection layer with the freedom to target backends without re-instrumenting code or significant fleet changes.
- High-cardinality queries – The ability to ask “which customer, which image, which pipeline stage, which version” without hitting index limitations.
- Unlimited retention at predictable cost – The solution can store telemetry indefinitely, not days. The cost scales with storage, not event volume.
- Kubernetes-based, open source, on existing infrastructure – This combination fits Proscia’s solution that already runs on Amazon EKS. The solution can use the compliance capabilities they already trust: EKS, S3, Amazon Cognito, and AWS Identity and Access Management (IAM).
These requirements pointed to a simple recipe. AWS provides the infrastructure. ClickHouse provides storage and performant queries at low cost. Altinity provides the Kubernetes-based ClickHouse operator. OpenTelemetry (OTel) provides the collection and transport layer.
Solution overview
Proscia’s observability solution is split across multiple AWS accounts and Regions. Telemetry is collected inside each account, then shipped across account and Region boundaries into a dedicated observability account where it is ingested, stored, and queried. We show the two halves as separate diagrams. The components in the architecture are deployed identically globally.
Telemetry collection (production account)
The following diagram illustrates the telemetry collection layer in Proscia’s production account.
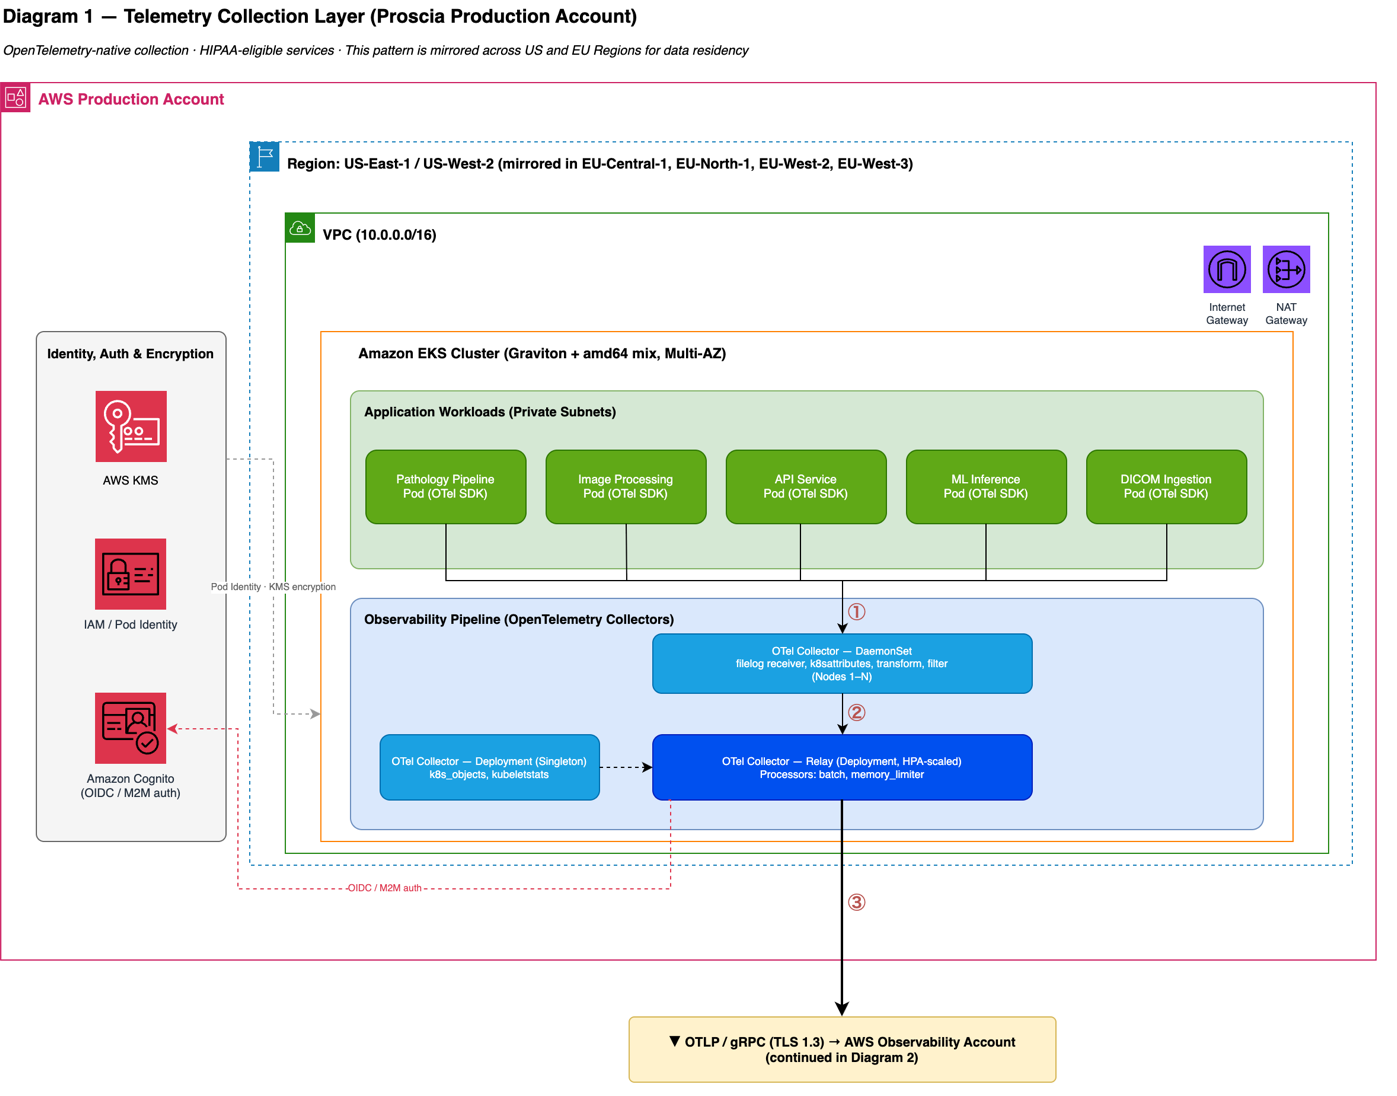
Figure 1: Telemetry collection layer in Proscia’s production account
The preceding architecture shows where telemetry originates. Proscia’s Concentriq workloads run on an EKS cluster powered by Graviton in private subnets. The architecture consists of the following key components:
- Five application representative services emit logs, spans, and metrics through the OTel SDK. Instrumentation travels with the code and is portable across different backends.
- IAM and EKS Pod Identity grant least-privilege access, Amazon Cognito provides the OpenID Connect (OIDC) and machine-to-machine credentials used for the cross-account export, and AWS Key Management Service (AWS KMS) encrypts data in transit and at rest.
- A three-part OTel collector layer gathers data on the node, enriches it with Kubernetes context, batches it, and exports it out of the account over OTLP/gRPC with TLS 1.3.
Ingestion, ClickHouse, and storage (observability account)
The following diagram illustrates the observability account, including ingestion, ClickHouse, and storage.
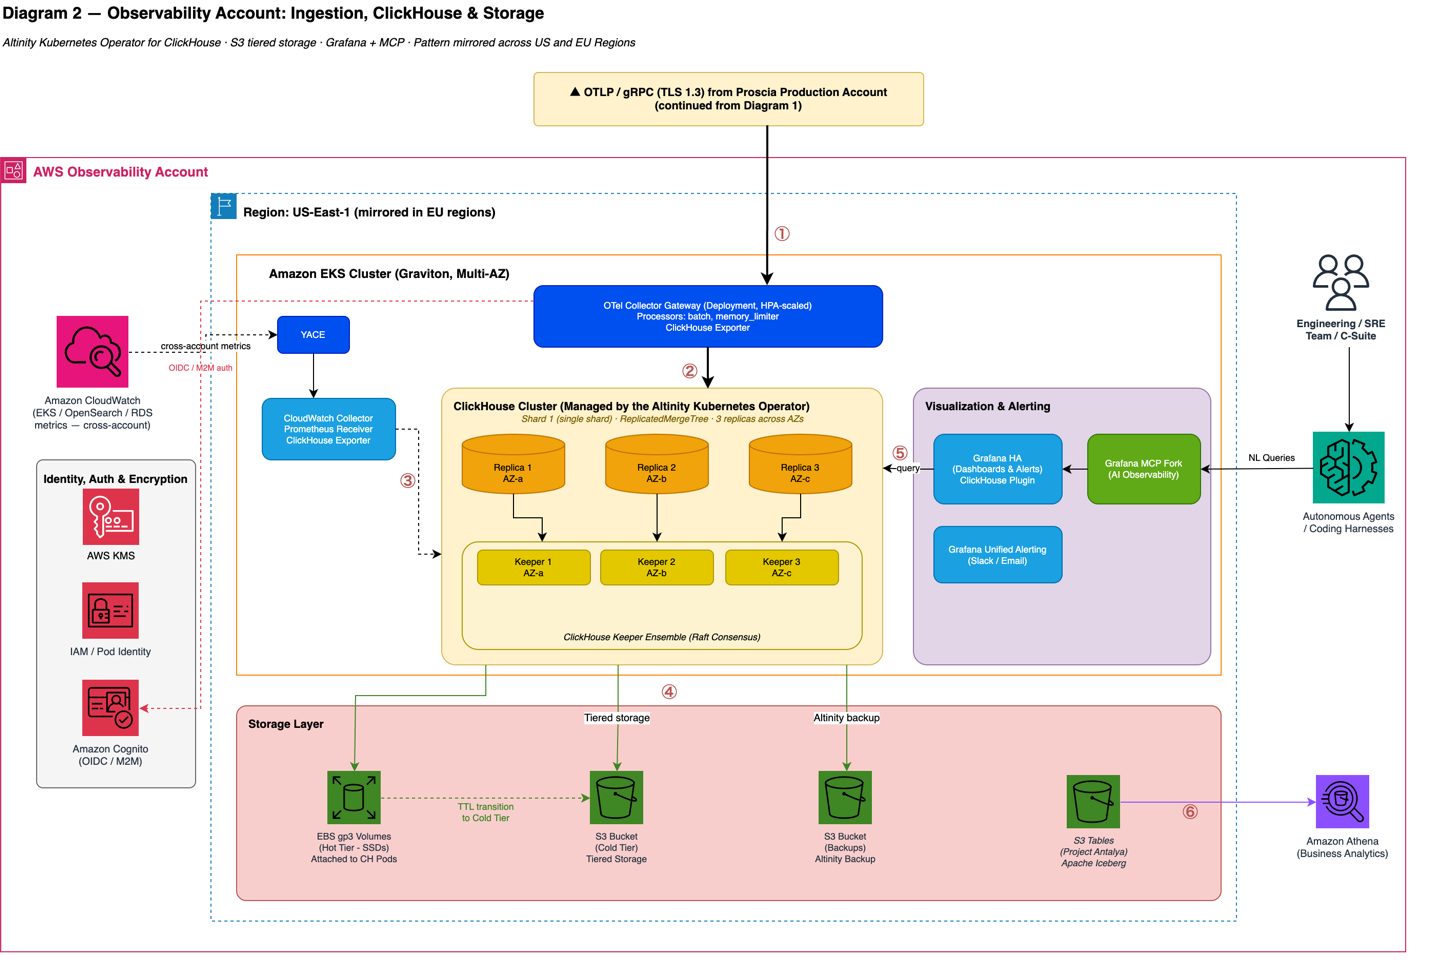
Figure 2: Observability account, including ingestion, ClickHouse, and storage
The diagram shows where telemetry lands, lives, and is queried, in a separate AWS account, so any observability-related incidents stay isolated from production. The workflow consists of the following steps:
- The OTel Collector Gateway is the account’s single-entry point for telemetry data. The collector applies batch and memory_limiter processors with the ClickHouse exporter to write telemetry into the cluster.
- Through the Altinity Kubernetes Operator, ClickHouse runs as a single shard with three replicas across Availability Zones (ReplicatedMergeTree), so an Availability Zone can fail without data loss or downtime. A three-node ClickHouse Keeper ensemble (one per Availability Zone, Raft consensus) handles coordination and metadata consistency without a separate ZooKeeper and preserves quorum if an Availability Zone is lost. The component is purpose-built for the high-cardinality queries Proscia needs, without index limits. Compute, storage, and replicas all scale on a running cluster.
- Cross-account metrics using YACE (Yet Another CloudWatch Exporter) and an Amazon CloudWatch collector pull cross-account infrastructure metrics from EKS, Amazon OpenSearch Service, and Amazon Relational Database Service (Amazon RDS) into the same ClickHouse cluster. Infra and application telemetry live side by side.
- Tiered storage runs a hot tier on Amazon Elastic Block Store (Amazon EBS) gp3 with recent and frequently queried data on SSDs attached to ClickHouse pods. ClickHouse TTL rules move cold data to S3, compressed at a 40:1 overall ratio; clickhouse-backup writes full and incremental backups to S3 for disaster recovery.
- Grafana high availability (HA) with the ClickHouse plugin provides dashboards and queries; Grafana Unified Alerting routes alerts to Slack and email. Proscia’s fork of Grafana’s Model Context Protocol (MCP) server lets people and agents query telemetry in plain language. Cognito federates identity (OIDC), IAM enforces least privilege, and AWS KMS encrypts data at rest (SSE-KMS) and in transit (TLS 1.3), all HIPAA-eligible services, so Proscia can show auditors exactly how telemetry flows, where it lands, and who touches it.
- The Apache Iceberg and Project Antalya export can be queried by Amazon Athena and other engines. The solution completes a fast export of MergeTree data to managed Iceberg tables, so the same telemetry is queryable by Athena and other Iceberg-compatible engines.
Because collection and storage meet at a single OTLP/gRPC interface, either half can change independently: Proscia could swap collectors, add a Region, or move the backend without re-instrumenting a line of application code. The entire self-hosted solution, across both Regions, runs in the same cost order of magnitude as their previous software as a service (SaaS) vendor but for well over 10 times more data with effectively unlimited retention.
Open source at the core
The Altinity Kubernetes Operator makes self-hosted ClickHouse practical at production scale. Operating stateful systems on Kubernetes is complex; the operator transforms that into declarative configurations such as provision, scale, upgrade, and restore.
For Proscia, this means automated rolling upgrades and backup/restore to S3, the same workflow across both Regions with no bespoke tooling, and S3 tiered storage managed declaratively (hot data on SSD, cold data offloaded automatically). The active community meant that when Proscia hit edge cases, answers already existed.
The operator made the entire “build” decision feasible for a lean team by making ClickHouse straightforward to manage.
Observability purpose-built for AI
Proscia’s solution processes gigapixel whole slide images through complex data processing pipelines capturing billions of metric points a month. For example, traditional observability tells you an HTTP request took 300 milliseconds. Proscia needed to know the exact seconds spent in segmentation and in writing tiles for a specific image associated with a specific customer running a particular version. Root cause analysis on telemetry-reachable tickets now runs in a median of 10 minutes in a single pass, against a 4- to 24-hour support-to-engineering escalation round trip previously per ticket, a 24 times faster improvement.
To properly troubleshoot emergent issues in their data pipelines or customer experiences, there are more edge cases than you can bake into pre-built dashboards. Making it possible for the engineering teams to both create instrumentation where needed and perform the necessary queries is paramount to an effective observability solution. Since moving forward with the self-managed observability solution, Proscia increased the total number of records across metrics, logs, and spans to 33 billion per month or almost 14 times more records, all within the first year.
Natural language queries using MCP
Model Context Protocol (MCP) lets AI assistants call external tools directly. Proscia forked Grafana’s MCP server, adapted it to their stack, and put it behind their own identity provider with Amazon Verified Permissions (AVP) governing who can query what. Engineers, PMs, and executives can now query telemetry in plain language without parsing through complex ClickHouse query syntax.
For example, an engineer debugging a latency spike can ask “show me P95 response times for tile generation in EU-Central over 48 hours, broken down by customer” and get an answer without querying ClickHouse manually. A VP of Customer Success can ask “which accounts are running a version older than 3.2” and get a table without filing a ticket. Proscia is building agents on Amazon Bedrock AgentCore that use the same MCP interface to act as AI SREs, triaging alerts and running first-pass root cause analysis on their own. The interface has helped Proscia process over half a million queries in a single week while maintaining performance. Across more than 25 TB of data, the MCP and dashboard maintain p95 latency of just over 250 milliseconds for select queries.
Results
Proscia was able to scale many aspects of their observability solution while making their TB storage costs per month 100 times cheaper. The following table provides an overview of improvements they made across the stack.
| Metric | Before | After (self-hosted on AWS) |
| Data retained | 15 days | Indefinite |
| Total records/month | ~2.4 Billion | ~33.7 Billion |
| Metric points/month | 0 | ~19.3 Billion |
| Log events retained/month | 1.6 Billion | ~9.8 Billion |
| Span events/month | 0 | ~4.6 Billion |
| Namespaces Instrumented | 1 | 100+ |
| Services instrumented | 1 | 30+ |
| Kubernetes clusters covered | 1 | 10+ |
| Kubernetes nodes monitored | ~50 | ~550 |
| AWS resources monitored | 0 | ~275 |
| Migration timeline | — | 6 months (first spike → production) |
| Query dimensionality | 50 indexed annotations max | Unlimited high-cardinality fields |
| Regions | Single | Multi-Region |
The following table summarizes the cost dimensions.
| Metric | Before | After (self-hosted on AWS) |
| GB ingest fee | Yes | No |
| Per host fees | Yes | No |
| Custom metric fees | Yes | No |
| Storage TB/month | $500+ | ~$5 |
Shifting from cost avoidance to instrumentation-first
When per-event pricing disappeared, behavior changed. Engineers started instrumenting voluntarily without anyone mandating it.
A validating moment occurred when an engineer, close to retirement, who had never interacted with modern observability tooling (because their stack is severely underrepresented in the auto-instrumentation space), opened a pull request adding custom spans to Proscia’s in-house C++ image processing pipeline. They were excited to finally see what their application was doing in production in a dependable way. Behavior across the team like this led to instrumented services increasing by 30-fold in the first year, and Proscia now embeds customer-facing analytics directly into their product. Proscia can ship a customer’s own telemetry to nearly any backend, satisfying even the most stringent compliance requirements with minimal engineering effort. The same telemetry that helps engineers debug a pipeline helps customers understand their operations.
What’s next: From observability store to real-time data lake
Proscia’s direction is to treat this telemetry as a long-lived data asset, not just something to monitor. They already export data to Iceberg on S3 through Amazon S3 Tables, so Iceberg-compatible engines such as Athena, Spark, Trino, or DuckDB can read it directly without a second copy or query federation. The next step, Altinity’s Project Antalya, makes Iceberg a first-class store for ClickHouse itself. This means a single copy of data stored on S3 at roughly one-tenth the cost, still queried at the sub-second, high-cardinality performance Proscia relies on, and a drop-in for the same Altinity Kubernetes Operator they already run.
That reframes what observability data is. The same billions of spans, logs, and metric points that answer “why did this slide take 300 ms to segment, for this customer, on this version?” become a durable, openly queryable asset for multi-year trend analysis and anomaly detection training data, a real-time data lake that compounds in value the longer it lives in S3.
When should organizations build their own observability solution
The choice to build your own observability solution depends on whether your organization meets the following criteria:
- A strong engineering team comfortable operating stateful systems on Kubernetes
- A need to retain telemetry for months, years, or even indefinitely
- The desire to have full visibility and control of the entire observability pipeline
If not all apply, organizations can take a hybrid approach. ClickHouse Inc and Altinity both offer managed ClickHouse. Grafana Cloud, Amazon Managed Grafana, or another tool handles the visualization and alerting layer. Teams can assemble the parts that make sense and buy the rest while keeping OTel as a universal interface regardless of backend choice.
Conclusion
Proscia set out to solve an observability problem and ended up building a solution with the same budget that operates on 14 times more data at one hundredth of the cost per TB. Engineers instrument freely because telemetry creates immediate, visible value across engineering, product, and customers. That visibility drives further instrumentation, creating a virtuous cycle.
To get started, refer to the Altinity Kubernetes Operator on GitHub and Altinity Project Antalya, and contact your AWS account team to discuss your observability architecture.
ClickHouse is a registered trademark of ClickHouse, Inc.