Artificial Intelligence
How Datacor built self-service rental analytics with Amazon Quick Sight
This post was written with contributions from Datacor’s TrackAbout engineering and product teams.
For gas and welding distributors, rental billing on assets such as cylinders and bulk tanks is a significant share of total revenue. Yet the data needed to manage those assets was often locked in disconnected systems, accessible only through IT. The resulting reports gave limited insight into fleet utilization, rate performance, or revenue recovery.
Datacor is a trusted source for proven software and expertise in process manufacturing, chemical distribution, and engineering. Its TrackAbout solution helps industrial gas and welding distributors track and manage cylinder and container assets across the supply chain. TrackAbout customers collectively manage 27.5 million assets and over 725,000 bills per month. At that scale, inaccessible data has a direct cost in unbilled rental days and revenue that never gets captured.
To solve this, Datacor integrated Amazon Quick Sight into the TrackAbout solution, equipping it with interactive dashboards and a natural language search bar. Amazon Quick Sight is the embedded analytics capability within Amazon Quick. The result is a self-service analytics experience where business users can explore rental performance data, ask natural language questions, and make data-driven decisions. Users no longer need to file IT tickets or wait for custom reports.
In this post, we describe how Datacor solved the challenge of rental data scattered across operational systems and accessible only through IT-generated reports. Datacor built an automated cross-cloud data pipeline, embedded dashboards, and natural language querying powered by generative business intelligence (BI) in Amazon Quick Sight. We walk through the business challenge, the architecture, and the lessons learned along the way.
The business challenge
Datacor’s TrackAbout customers in the gas and welding industry manage rental billing as their most critical revenue stream, but most had no direct way to analyze it. Rental data lived inside TrackAbout’s operational systems, but extracting meaningful insight required going through Datacor’s support team. Customers submitted requests for custom SSRS (SQL Server Reporting Services) reports or raw data exports and waited for delivery for days, sometimes even weeks. They received static outputs that answered only the question originally asked. Follow-up analysis started the cycle over.
The cost extended beyond inconvenience. Because each new report required technical resources on both sides, customers couldn’t iterate: they couldn’t ask “what if I raise acetylene rates by five percent?” and get a same-day answer. Rate decisions that directly govern revenue recovery were made on incomplete information.
Pre-built reports couldn’t solve this. Distributors vary in fleet size, product mix, geography, and billing structure, so no single standard report served them all. The manual process couldn’t scale to serve each distributor individually. Customers systematically underused the data they already generated and left recoverable revenue on the table.
Datacor recognized that customers needed a self-service analytics approach to get full value from their rental data. That approach had to make data broadly accessible while accommodating the diverse analytical needs of gas and welding distributors.
““The interesting part wasn’t the AI—it was the unglamorous work underneath it: cross-cloud ingestion, row-count validation, a tenant-isolation model we could actually audit. That’s what earned us the right to put natural language querying in front of a customer’s revenue data,” said Sundar Kuppuswamy, Chief AI Officer at Datacor. “We measure the return on that investment by one thing: whether it puts a decision back in the customer’s hands. A distributor asking, ‘what if I raise acetylene rates by five percent?’ and getting the answer in the same meeting is the bar. We’re deliberately conservative about where we apply this, because a confident wrong answer about a customer’s revenue data is worse than no answer at all.”
The solution
Datacor collaborated with Amazon Web Services (AWS) to address this challenge by building a multi-tenant rental analytics solution that integrates interactive dashboards and a natural language search bar directly into the TrackAbout application using Quick Sight. The solution gives business users a self-service path to rental performance insights, with no IT involvement required for standard analyses.
At the center of the experience is the generative BI capability in Amazon Quick Sight (Amazon Q in Quick Sight), a generative AI-powered assistant for business intelligence. Business users can ask plain-language questions about their rental data and get accurate, contextually relevant answers backed by regularly refreshed datasets. Users can ask questions such as:
- “Show me rental revenue by product type last quarter”
- “Which customers have the most unreturned cylinders this month?”
- “What is the average rental rate by asset class across my top 20 accounts?”
- “How many cylinders have been out for more than 90 days?”
The solution also provides pre-built, context-aware dashboards that surface key rental metrics: fleet utilization rates, billing exception summaries, revenue recovery trends, and customer-level asset aging. These dashboards use a visual format designed for business users, not data analysts.
Underlying the analytics layer is an automated cross-cloud pipeline that regularly ingests and transforms operational data from TrackAbout’s third-party cloud environment into AWS. This pipeline refreshes datasets in Amazon Quick Sight SPICE (Super-fast, Parallel, In-memory Calculation Engine) on a scheduled basis, so the dashboards users see reflect recent operational data.
Architecture walkthrough
Datacor’s TrackAbout rental analytics solution uses a layered architecture that spans data ingestion, transformation, storage, and presentation. The following diagram shows the end-to-end flow from TrackAbout’s operational system to the embedded Amazon Quick Sight dashboards and natural language search bar inside the TrackAbout application.
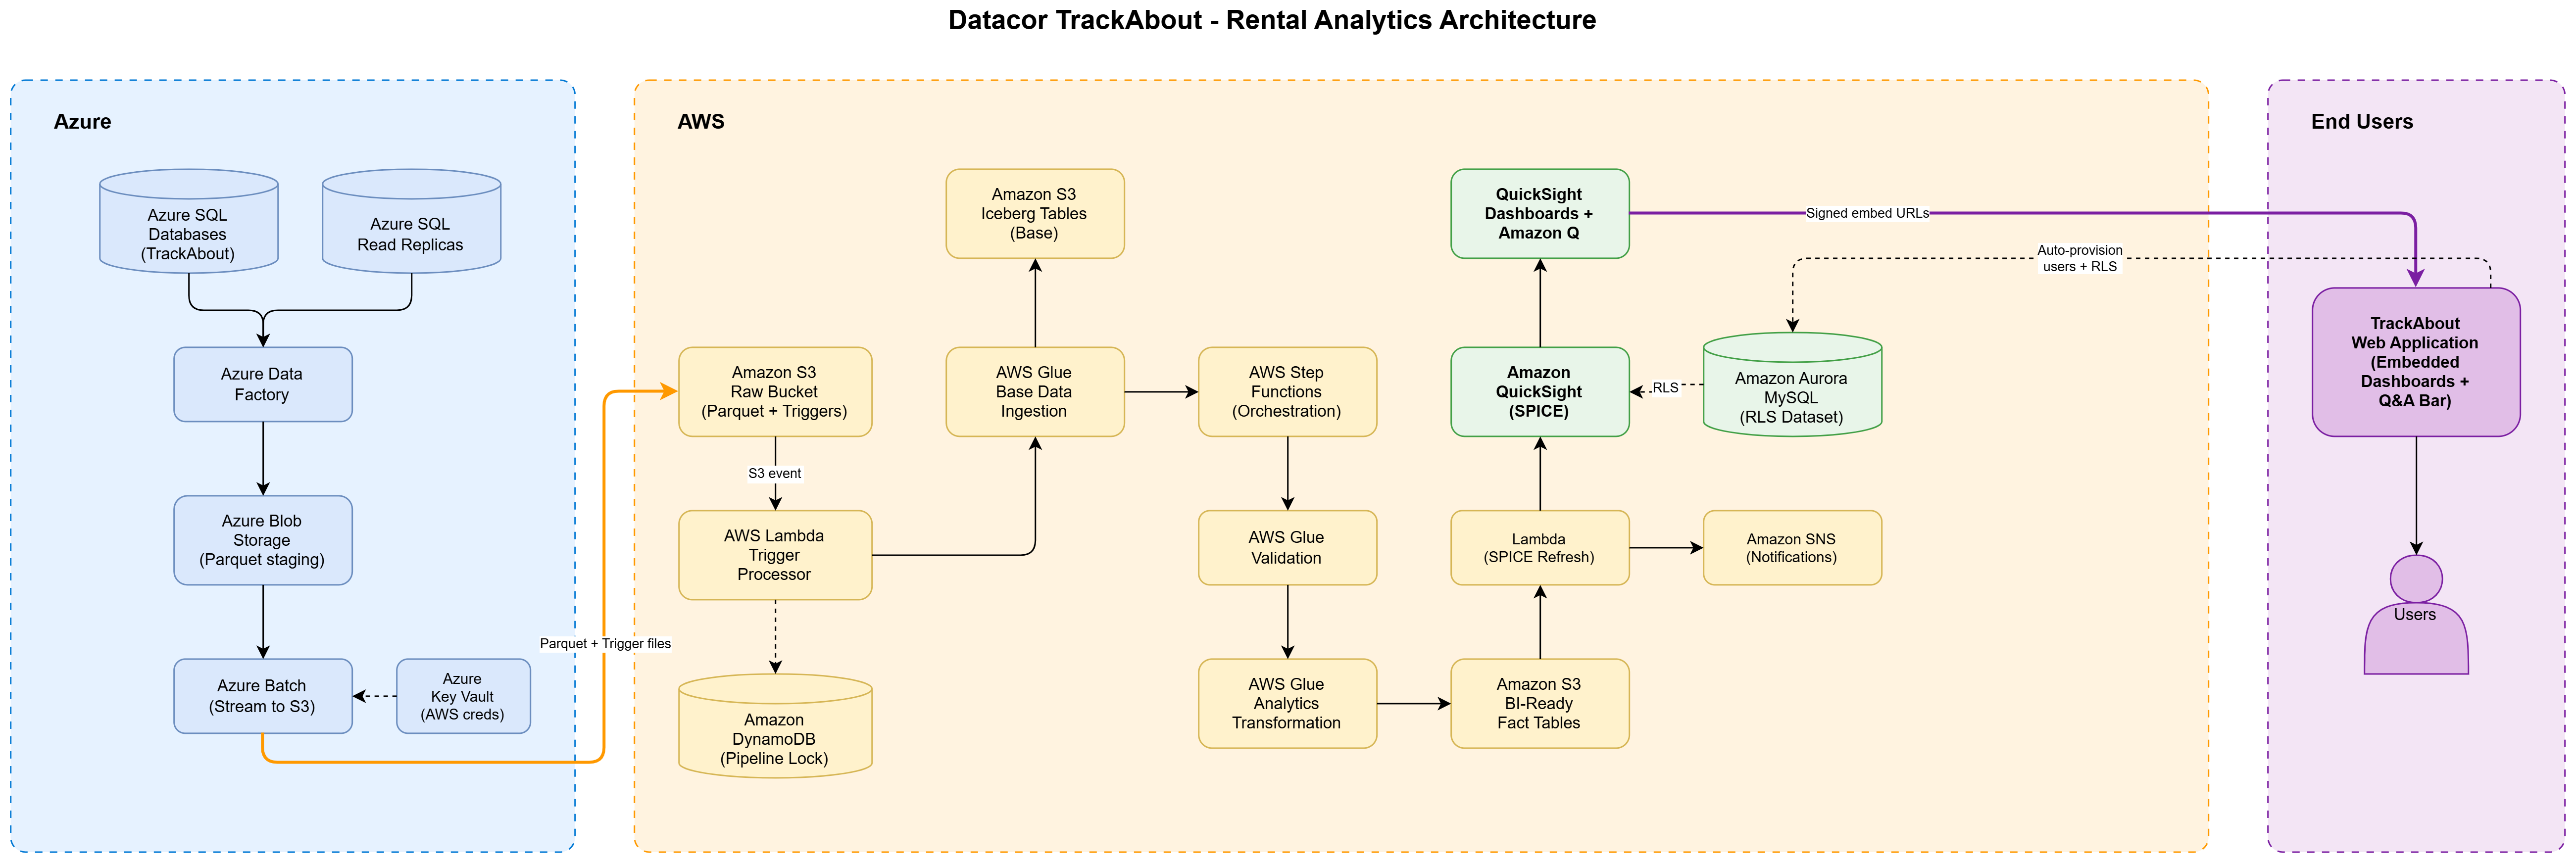
Figure 1: Datacor’s TrackAbout rental analytics architecture
Cross-cloud data ingestion
TrackAbout’s operational data resides in Azure SQL databases. An Azure Data Factory pipeline extracts source tables as Apache Parquet files and streams them into Amazon Simple Storage Service (Amazon S3). The pipeline supports both full and incremental loads, using change tracking to transfer only modified rows on incremental runs. Arrival of new data in Amazon S3 triggers an orchestration layer built on AWS Lambda, AWS Glue, and Amazon DynamoDB. This layer dispatches per-table processing jobs and enforces ordered, single-threaded execution.
AWS Glue jobs merge incremental updates into Apache Iceberg tables on Amazon S3, and an AWS Step Functions workflow validates row counts and builds the final BI-ready tables. After each successful run, Datacor refreshes the Amazon Quick Sight SPICE datasets so dashboards reflect recent operational data.
Multi-tenant data isolation
Because TrackAbout is a multi-tenant software as a service (SaaS) application, the analytics layer uses Amazon Quick Sight row-level security (RLS). RLS scopes every dashboard and natural language query to the requesting customer’s data. Each SPICE dataset has an associated RLS dataset that maps user identities to tenant identifiers, applied automatically at query time. This design:
- Requires no changes to dashboard definitions when new tenants are onboarded.
- Scales to hundreds of tenants without duplicating datasets or dashboards.
- Applies consistently to both embedded dashboards and natural language queries.
- Centralizes access control in the RLS configuration, reducing maintenance overhead.
Embedded analytics
Datacor delivers the analytics experience inside TrackAbout using the Amazon Quick Sight Embedding SDK, which renders fully interactive dashboards and the natural language search bar natively within the TrackAbout web UI. When a user opens the analytics section, the application server calls the Amazon Quick Sight API to generate a short-lived, signed embedding URL scoped to that user’s identity. For natural language querying, Datacor configured generative BI topics that map business terminology to dataset fields, so the natural language assistant answers the questions users actually ask.
Implementation strategy
With the architecture established, Datacor developed an implementation approach designed to deliver value incrementally, reduce integration risk, and support the multi-tenant requirements of a SaaS product. This section describes the key decisions that shaped how the solution was built and deployed.
Phased rollout
Datacor launched the rental analytics solution in phases rather than as a single large release. The first phase began in July 2025 and focused on the data pipeline, establishing cross-cloud ingestion, validating data quality, and loading historical records into SPICE. This phase ran in parallel with the existing SSRS reporting environment, so the team could validate output accuracy before decommissioning legacy reports.
The second phase introduced the embedded dashboard experience to a pilot group of 6-7 customers in September 2025. After incorporating pilot feedback and completing additional validation, Datacor released the solution in November 2025 to TrackAbout customers using rental functionality. The release was well received, with customers eager to see their rental data from a new perspective.
Multi-tenant onboarding automation
Onboarding a new customer requires provisioning an Amazon Quick Sight user identity, configuring RLS permissions, and associating the tenant with the right SPICE datasets. Without automation, this process could take 15-30 minutes per customer. It wouldn’t scale as the solution expands beyond the initial 50 customers to the broader TrackAbout customer base.
Datacor automated this entirely within TrackAbout. On a user’s first access, the application creates the Amazon Quick Sight identity from their existing role, adds the tenant identifier to the RLS configuration, and assigns the dashboard set for their subscription tier, with no manual setup required.
Natural language configuration
Configuring the natural language assistant required close collaboration between Datacor’s product team and TrackAbout subject matter experts. Together they verified that the assistant understood gas-and-welding vocabulary such as “turnaround time,” “lost cylinders,” “demurrage,” and “fill cycle.” Datacor defined friendly field names and synonyms for each dataset column, configured calculated metrics such as average rental duration and revenue recovery rate as pre-built measures, and tested topic coverage against a library of real customer questions. The result is an assistant that speaks the language of the rental business, so users need no knowledge of the underlying data model to get accurate answers.
Dashboards
The dashboards are purpose-built for the business users who manage gas and welding operations. Rather than exposing raw data in a general-purpose tool, Datacor designed each dashboard around a specific set of business questions, accessible inside the TrackAbout application users already work in.
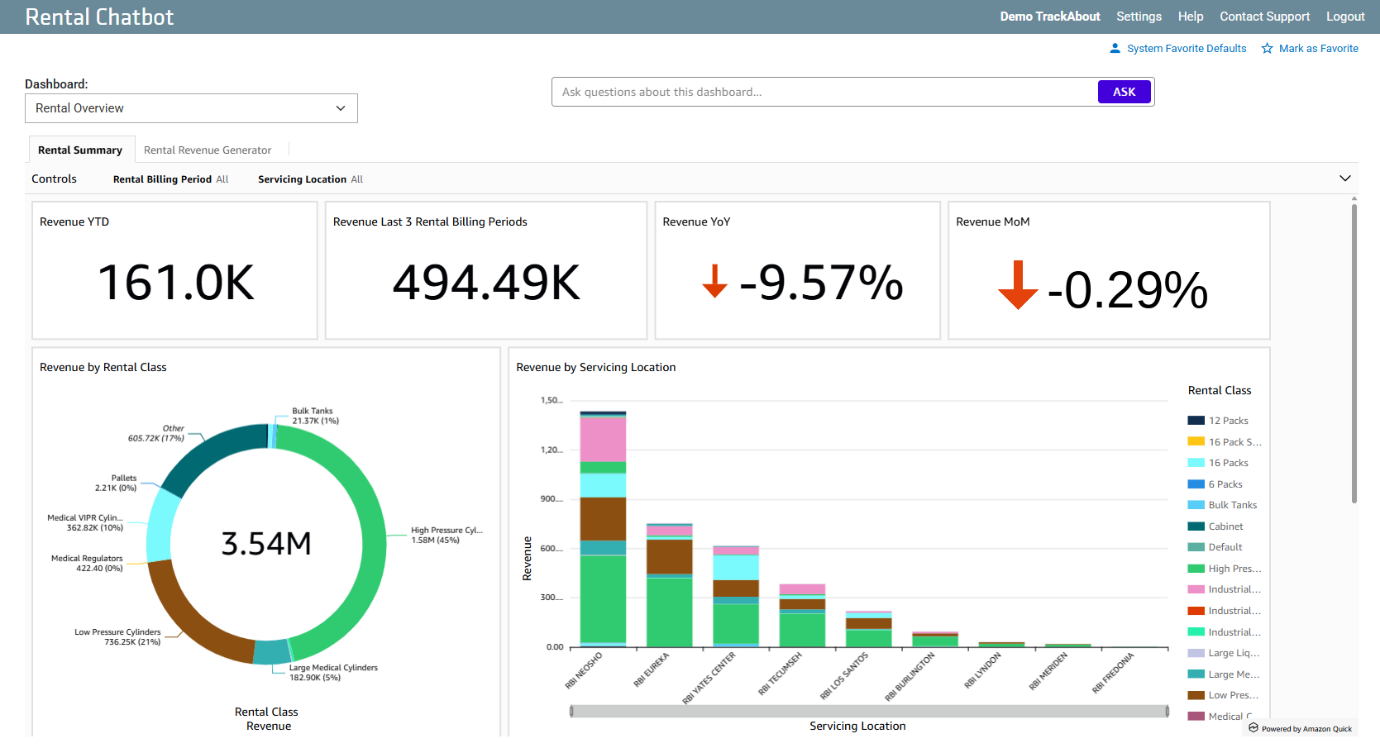
Figure 2: Datacor’s TrackAbout Rental Summary dashboard
The Rental Summary dashboard gives executives and managers visibility into rental health and trends. Customers can customize their views, so a single dashboard serves distributors with different reporting needs. A key enhancement is the integration of natural language querying. Business users can ask questions in plain English and immediately receive visualized insights, surfacing revenue trends and anomalies without help from Datacor’s support team.
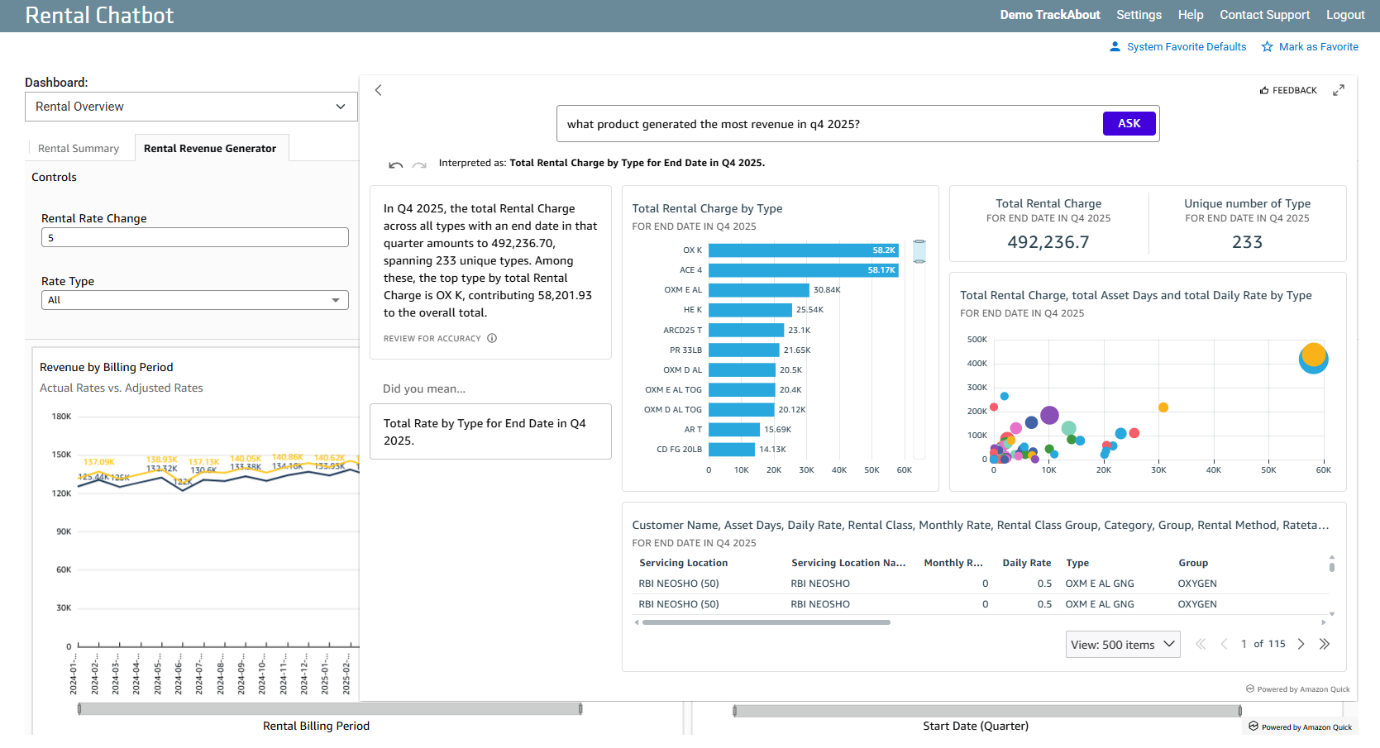
Figure 3: Datacor’s TrackAbout Rental Revenue Generator dashboard
The Rental Revenue Generator dashboard delivers what-if analysis so distributors can model pricing scenarios. Customers can explore questions like “What if I increase acetylene rates by 5 percent?” and see the immediate revenue impact in detail, so they can adjust rental rates proactively throughout the year rather than reacting once annually.
Benefits and results
The TrackAbout rental analytics solution was released to customers in November 2025. Since then, Datacor has enabled the feature for more than 50 customer organizations, with more than 60 business users actively using the dashboards. Because Quick Sight identities are provisioned automatically on first access, this adoption required no onboarding effort from Datacor. Business users now get answers in minutes instead of days. The following outcomes reflect early adopter feedback.
Self-service analytics adoption
Before the solution launched, the vast majority of rental analytics requests went through IT. Users now self-serve the same analyses in Amazon Quick Sight, and new-customer analytics onboarding is fully automated. There is no need to understand SQL or coordinate with a developer to answer questions like “Which of my customers have the most cylinders out right now?” Users ask questions in plain language and get answers backed by the latest refreshed analytics data.
Revenue recovery
The Rental Summary and Rental Revenue Generator dashboards help users identify previously invisible revenue recovery opportunities. By making unreturned asset counts and billing discrepancies visible in interactive dashboards, the solution surfaces issues previously lost in static reports or discovered only during annual audits. Using asset-aging views, users can identify containers at customer sites that have not generated rental revenue in months. They can then launch targeted outreach to return assets to circulation or initiate billing corrections.
Operational efficiency
Before the solution, rental analytics required IT to build custom SSRS reports for each request. The automated cross-cloud pipeline alleviated this dependency entirely. Data now flows from the operational system to Quick Sight dashboards without manual intervention, and users explore it on their own through natural language queries. This freed IT teams to focus on higher-value work.
Solution expansion
The initial release focused on rental analytics, a TrackAbout module used by only a subset of customers. Datacor has since applied the same architecture to analytics relevant to its entire customer base, building three new dashboard suites: Customer Overview, Inventory Insights, and Process Inconsistencies. These were released to a pilot group in May 2026, with general availability planned for September 2026.
This expansion required no new infrastructure. New datasets were added for each subject area, but they flow through the same cross-cloud pipeline, row-level security model, and embedding approach. Extending analytics into new domains did not require rebuilding the foundation. Customers gain visibility into new areas of their operations without a separate implementation, and Datacor can scale the offering without re-engineering the system.
Lessons learned
Building the TrackAbout Rental Analytics solution surfaced practical lessons relevant to any team integrating embedded analytics into a multi-tenant SaaS product.
Start with the business question, not the data
The most-adopted dashboards started from a specific business question, such as “Which customers are most at risk of revenue leakage from improper rate assignment?” and worked backward to the data required. The same principle applied to the natural language assistant: designing topic coverage around the questions users actually asked produced higher answer accuracy than mapping the full schema.
Invest in data quality before investing in visualizations
The team front-loaded data-quality work rather than treating it as post-launch cleanup. The AWS Glue validation layer, which checks source-to-target row counts and flags variances, was essential for building user trust. Dashboard numbers must match what users see in their operational system.
Row-level security design requires careful planning
Multi-tenant RLS is powerful but needs upfront planning. Aligning the RLS model with an existing tenant identifier (the client database name already present in the pipeline) meant the team could apply rules uniformly across datasets. Documenting it as a formal data access policy made the system easier to audit and extend.
Embedded analytics improves the user experience
Embedding dashboards directly in the TrackAbout interface, rather than a separate portal, improved adoption because the experience felt native. Low onboarding friction, an in-place dashboard selector, and the adjacent natural language search bar helped users adopt analytics without training.
Looking to the future
The rental analytics solution is the first chapter of a longer roadmap. Planned enhancements include:
- Predictive analytics for fleet planning, using historical barcode and radio frequency identification (RFID) scan data and seasonal demand patterns to forecast container requirements by location.
- Expanded asset coverage, bringing bulk tanks and specialized industrial equipment into the same analytics framework as cylinders.
- Additional natural language topic configurations covering financial analytics use cases, including margin analysis by customer segment and contract performance tracking.
- Integration with customer enterprise resource planning (ERP) systems to close the loop between rental analytics findings and financial record updates.
The combination of automated data pipelines, embedded analytics, and natural language querying provides a foundation that Datacor can extend to new domains without rebuilding the infrastructure each time.
You might be considering a similar path: embedding analytics into a multi-tenant SaaS application, building a cross-cloud data pipeline, or deploying generative BI capabilities. If so, we encourage you to explore the resources that follow. Start with a focused pilot that addresses your highest-priority business question, and scale from there.
Learn more
To learn more about Datacor’s TrackAbout solution, visit Datacor.
For more information about Amazon Q in Quick Sight, refer to the following resources:
- Amazon Quick Sight
- Amazon Quick Sight console
- Amazon Q in Quick Sight
- Getting started with Amazon Q in Quick Sight