
Sold by: SAQTEK US CORP
Deployed on AWS
PodWatcher automatically identifies non-running objects within your cluster, instantly surfacing the relevant error codes and actionable troubleshooting commands. By providing rapid diagnostics and cross-cloud compatibility, PodWatcher reduces Mean Time to Recovery (MTTR) and simplifies management across diverse EKS and self-managed Kubernetes environments. This product is a buyer-deployed container image, giving you full control within your own VPC.
Overview
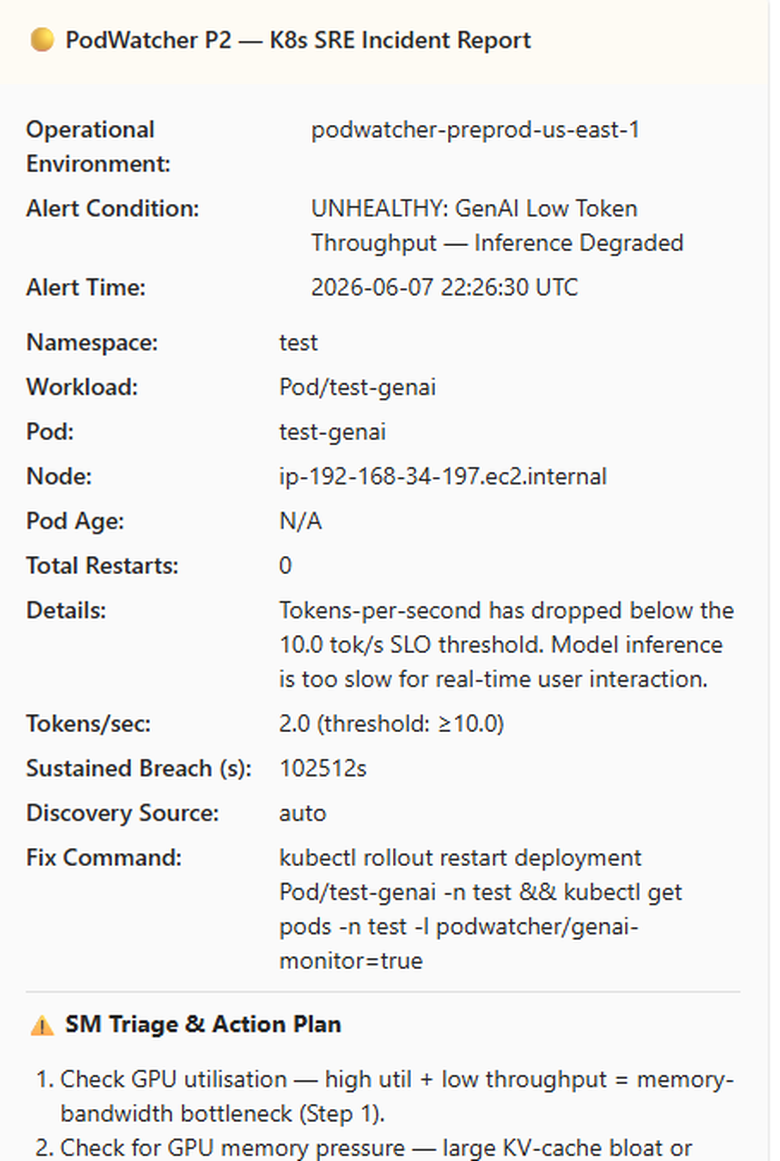
PodWatcher is optimized for Channel Partners and Managed Service Providers (MSPs) seeking to automate Level 1 support diagnostics across multi-tenant environments. It is a lightweight, high-efficiency Kubernetes monitoring agent designed to eliminate manual troubleshooting toil for failed workloads.
While traditional observability platforms only indicate that something is wrong, PodWatcher explains why it failed and how to fix it. It bridges the gap between raw Kubernetes events and actionable SRE intelligence, enabling teams to maintain high availability without the overhead of complex monitoring stacks.
KEY FEATURES AND SRE BENEFITS
Instant Error Mapping
PodWatcher uses an internal exit-code mapping engine covering OOMKilled, segmentation faults, SIGTERM events, and more. It translates Kubernetes failure states into human-readable explanations and provides preformatted kubectl troubleshooting commands.
Reduced MTTR (Mean Time to Recovery)
PodWatcher fetches the last 50 lines of container logs, runs a signal extraction engine that strips noise and surfaces error signals, and delivers the relevant lines capped at 1,500 characters directly to incidents with automatic deduplication and RESOLVED actions to Teams, Slack, or PagerDuty, eliminating the need for manual log diving and context switching.
SLA and SLO Protection
PodWatcher helps maintain service level agreements by detecting unhealthy pod states before they impact end users. It continuously tracks restarts and waiting states to support error budget management.
Minimal Operational Cost
Unlike heavy sidecar-based monitoring solutions, PodWatcher is a low-overhead single-deployment agent. It includes namespace filtering and pattern recognition to reduce alert noise and prevent alert fatigue while minimizing compute usage.
TECHNICAL INTEGRATION
Native Kubernetes Compatibility
PodWatcher supports Amazon EKS, self-managed Kubernetes clusters, and hybrid cloud environments.
Notification Channels
Supports webhook-based integrations for Slack and Microsoft Teams to provide real-time alerts.
Observability Support
Includes built-in health endpoints (/healthz) and Prometheus-compatible logging for seamless observability integration.
Zero Trust Security Model
Runs as a customer-managed container inside the customer VPC. No diagnostic data or logs leave the security boundary.
PAGERDUTY INTEGRATION
PodWatcher integrates with the PagerDuty Events API v2 to automatically create incidents for P1 alerts. It supports deduplication across cluster, namespace, and workload levels to prevent alert storms during crash loops. RESOLVED events automatically close incidents and capture Time to Resolve (TTR) metrics.
FINOPS WEEKLY EFFICIENCY REPORTS
Every seven days, PodWatcher generates automated FinOps reports identifying overprovisioned workloads and estimating potential monthly cost savings. It also provides ready-to-run kubectl commands for resource right-sizing without additional configuration.
GENAI AND INFERENCE WORKLOAD MONITORING
PodWatcher supports auto discovery of AI inference runtimes including vLLM, Triton Inference Server, Text Generation Inference (TGI), Ray Serve, Ollama, and more than 15 additional frameworks.
It monitors token throughput, Time to First Token (TTFT), and success rates while reducing false alerts caused by GPU warm up or initialization spikes.
HIGH AVAILABILITY
PodWatcher is designed for high availability using multiple replicas and Kubernetes lease-based leader election. Automatic failover promotes standby instances within 30 seconds. It has been validated under more than 100 simultaneous pod failure scenarios with no missed alerts.
COMPLETE YOUR OBSERVABILITY STACK
PodWatcher tells you what broke, why it broke, and how to fix it in real time. Incidents leave a trail, and PodWatcher exposes Prometheus-compatible metrics on port 8080. The companion EKS Observability Accelerator collects these metrics and transforms them into executive SLO dashboards, MTTR trend reports, and compliance-ready visualizations on Amazon Managed Grafana, all deployed within your own VPC.
Together, they answer key operational questions:
-
Right now: PodWatcher What is broken and how can it be fixed?
-
Over time: EKS Observability Accelerator - Are we improving? Is average MTTR decreasing? Are there fewer P1 incidents this month compared to last month? Are SLO targets being met?
EKS Observability Accelerator: MTTR Reduction and Dashboard Suite
https://aws.amazon.com/marketplace/pp/prodview-jw5af333chodi
Highlights
- Instant Root Cause Analysis automatically maps cryptic Kubernetes exit codes (like OOMKilled, SegFault, or SIGTERM) to human-readable descriptions. It provides the exact kubectl troubleshooting commands needed to resolve the issue. Predictable, flat-rate pricing: One license covers your entire cluster, no per-node fees, no hidden scaling costs.
- PodWatcher fetches the last 50 lines of container logs, runs a signal extraction engine that strips noise and surfaces error signals, and delivers the relevant lines capped at 1,500 characters directly to incidents with automatic deduplication and RESOLVED actions to Teams, Slack, or PagerDuty, eliminating the need for manual log diving and context switching.
- Podwatcher is a lightweight container and runs within customer configured/managed networking boundaries as a deployment and runs entirely within your own VPC and Kubernetes cluster; your diagnostic data and logs never leave your security boundary, ensuring zero data leakage and minimal compute overhead.
Details
Sold by
Categories
Delivery method
Supported services
Delivery option
PodWatcher Standard Deployment
Latest version
Operating system
Linux
Deployed on AWS
New
Introducing multi-product solutions
You can now purchase comprehensive solutions tailored to use cases and industries.

Features and programs
Financing for AWS Marketplace purchases
AWS Marketplace now accepts line of credit payments through the PNC Vendor Finance program. This program is available to select AWS customers in the US, excluding NV, NC, ND, TN, & VT.

Pricing
Pricing is based on the duration and terms of your contract with the vendor. This entitles you to a specified quantity of use for the contract duration. If you choose not to renew or replace your contract before it ends, access to these entitlements will expire.
Additional AWS infrastructure costs may apply. Use the AWS Pricing Calculator to estimate your infrastructure costs.
Dimension | Description | Cost/month |
|---|---|---|
PodWatcher Standard Cluster License | A flat-rate, 'fire and forget' license for one (1) Kubernetes cluster. This license covers all worker nodes and pods within the specified cluster, regardless of scale. Includes automated diagnostic mapping for exit codes (OOMKilled, SegFault, etc.), SRE-centric troubleshooting commands, and direct notification integration with Slack and Microsoft Teams. No per-node fees or hidden scaling costs. | $399.00 |
Pilot | Single-cluster license. Full PodWatcher feature set including automated diagnostics, exit code mapping, FinOps weekly report, GenAI workload monitoring, and Teams/Slack integration. Covers all nodes and pods within one cluster at any scale. No per-node fees. | $395.00 |
Standard | Up to 3 clusters. Full PodWatcher feature set including automated diagnostics, exit code mapping, FinOps weekly report, GenAI workload monitoring, and Teams/Slack integration. Covers all nodes and pods across all licensed clusters at any scale. No per-node fees. | $971.00 |
Professional | Up to 10 clusters. Full PodWatcher feature set including automated diagnostics, exit code mapping, FinOps weekly report, GenAI workload monitoring, and Teams/Slack integration. Covers all nodes and pods across all licensed clusters at any scale. No per-node fees. | $2,708.00 |
Enterprise | Up to 30 clusters. Full PodWatcher feature set including automated diagnostics, exit code mapping, FinOps weekly report, GenAI workload monitoring, and Teams/Slack integration. Covers all nodes and pods across all licensed clusters at any scale. No per-node fees. | $7,000.00 |
Enterprise Plus | Up to 100 clusters. Full PodWatcher feature set including automated diagnostics, exit code mapping, FinOps weekly report, GenAI workload monitoring, and Teams/Slack integration. Covers all nodes and pods across all licensed clusters at any scale. No per-node fees. | $15,100.00 |
Unlimited | Unlimited clusters including on-premises and multi-cloud Kubernetes environments. Full PodWatcher feature set including automated diagnostics, exit code mapping, FinOps weekly report, GenAI workload monitoring, and Teams/Slack integration. No cluster cap. No per-node fees. | $32,300.00 |
Dimensions summary
PodWatcher licenses are priced by the number of Kubernetes clusters you cover, not by nodes or pods. Each tier includes the same feature set and covers all nodes and pods within licensed clusters at any scale. Pilot and the Standard Cluster License cover one cluster. Standard covers up to 3, Professional up to 10, Enterprise up to 30, and Enterprise Plus up to 100. Unlimited removes the cluster cap and covers on-premises and multi-cloud environments. You pick the tier that matches your cluster count. No per-node fees apply.
Top-of-mind questions for buyers
A cluster is one Kubernetes cluster you register with PodWatcher. Every worker node and pod inside that cluster is covered under one cluster license. Node and pod counts do not affect the price. You are billed only by how many clusters your tier covers.
Each tier covers a set number of clusters: 1, up to 3, up to 10, up to 30, or up to 100. If your cluster count passes your tier's cap, move to a tier that covers more clusters. Unlimited removes the cap entirely, including on-premises and multi-cloud clusters.
The Unlimited tier covers on-premises and multi-cloud Kubernetes environments with no cluster cap. PodWatcher runs inside your own VPC, so your logs and telemetry stay in your environment. Other tiers cover the licensed number of clusters within that same in-VPC deployment model.
saqtek.com
Helpful?
Vendor refund policy
Refunds are at the seller's discretion. For technical support or refund requests, contact support@saqtek.com . For purchases made through Channel Partners, please include your Partner Reference ID to expedite the review process with our distribution team.
Custom pricing options
Request a private offer to receive a custom quote.

Legal
Vendor terms and conditions
Upon subscribing to this product, you must acknowledge and agree to the terms and conditions outlined in the vendor's End User License Agreement (EULA) .
Content disclaimer
Vendors are responsible for their product descriptions and other product content. AWS does not warrant that vendors' product descriptions or other product content are accurate, complete, reliable, current, or error-free.
Delivery details
PodWatcher Standard Deployment
Supported services: Learn more
- Amazon EKS Anywhere
- Amazon EKS
Helm chart
Helm charts are Kubernetes YAML manifests combined into a single package that can be installed on Kubernetes clusters. The containerized application is deployed on a cluster by running a single Helm install command to install the seller-provided Helm chart.
Version release notes
AWS Marketplace
- License Manager integration: licenseSecretArn OverrideParameter wired through Helm chart (${AWSMP_LICENSE_SECRET}) resolves MP listing checker requirement
- ServiceAccount OverrideParameter support (${AWSMP_SERVICE_ACCOUNT})
- image.pullPolicy: Always ensures latest image on every pod start
Integrations
- PagerDuty Events API v2 P1 alerts trigger critical severity, P2 trigger warning, RESOLVED sends resolve action
- Deduplication key scoped per cluster + namespace + workload no duplicate incidents during crash loops
- Configure via webhooks.pagerduty Helm value or PAGERDUTY_ROUTING_KEY env var
Security Hardening
- capabilities.drop: ALL (CIS Benchmark 5.2.7)
- seccompProfile: RuntimeDefault (CIS Benchmark 5.7.2)
- Passes Trivy container scans
Reliability
- Leader election stability improvements for HA deployments
- Cluster name correctly shown on all alert cards
- Triage commands in alert cards fully resolved with pod and namespace
Cross-Cloud
- Compatible with EKS, AKS, GKE, GKE Autopilot, OpenShift, Rancher, and on-premises no cloud-specific configuration required
Additional details
Usage instructions
PodWatcher v1.0.8 - Installation Guide
PREREQUISITES
- kubectl configured and connected to your EKS cluster
- Helm 3.8 or later (OCI support required)
- AWS Marketplace subscription active
- Microsoft Teams, Slack, or PagerDuty webhook URL (optional - PodWatcher starts without one)
STEP 1 - Download the install script
curl -O https://raw.githubusercontent.com/saqtek/podwatcher-install/main/helmupgrade.sh
Step 2 - Edit the script variables:
Open helmupgrade.sh and set:
CLUSTER_NAME - (Your Cluster Name) TEAMS_WEBHOOK - your Microsoft Teams incoming webhook URL (optional) SLACK_WEBHOOK - your Slack incoming webhook URL (optional) PAGERDUTY_ROUTING_KEY - your PagerDuty Events API v2 integration key (optional) WATCH_NAMESPACES - comma-separated namespaces to monitor, or leave blank for allSTEP 3 - Run the install
bash helmupgrade.sh
This runs: helm upgrade --install with --atomic If any step fails the install rolls back automatically.
STEP 4 - Verify
kubectl get pods -n podwatcher kubectl logs -n podwatcher -l app.kubernetes.io/name=podwatcher --tail=20
STEP 5 - Confirm alerts are working
kubectl run test-crash --image=busybox --restart=Always --namespace=default -- sh -c "exit 1"
Wait ~60 seconds. A P2 alert card should arrive in your Teams or Slack channel.
Clean up: kubectl delete pod test-crash --ignore-not-found
UPGRADING
To upgrade to a new version, update the --version flag in helmupgrade.sh and re-run: bash helmupgrade.sh
UNINSTALL
helm uninstall podwatcher -n podwatcher kubectl delete namespace podwatcher
SUPPORT
support@saqtek.com Documentation: https://github.com/saqtek/podwatcher-install AWS Marketplace: https://aws.amazon.com/marketplace
NEXT STEP - Grafana Dashboard Suite
PodWatcher delivers real-time alerts. For historical trend analysis, SLO compliance reporting, and executive dashboards on Amazon Managed Grafana, see our EKS Observability Accelerator on AWS Marketplace: https://aws.amazon.com/marketplace/management/products/prod-q7pq2jyv7boqq
As a buyer-deployed product, the customer is responsible for the underlying infrastructure (VPC, EKS, IAM) and associated compute costs.
Support
Vendor support
As a buyer-deployed product, the customer or managing partner is responsible for the health of the underlying AWS infrastructure (VPC, EKS, IAM) and associated compute costs.
AWS infrastructure support
AWS Support is a one-on-one, fast-response support channel that is staffed 24x7x365 with experienced and technical support engineers. The service helps customers of all sizes and technical abilities to successfully utilize the products and features provided by Amazon Web Services.
Similar products
Datadog is a SaaS-based unified observability and security platform providing full visibility into the health and performance of each layer of your environment at a glance.
DevZero autonomously rightsizes Kubernetes CPU and memory in real time without restarts, cutting cloud costs by an average of 53%. Built for platform engineering and DevOps teams on AWS, GCP, and Azure.

CloudZero enables engineers to build cost-effective software. The world's leading cloud-driven companies rely on CloudZero for accurate, granular visibility into total cloud spend.
Datadog is a SaaS-based unified observability and security platform providing full visibility into the health and performance of each layer of your environment at a glance.
Customer reviews
No customer reviews yet
Be the first to review this product . We've partnered with PeerSpot to gather customer feedback. You can share your experience by writing or recording a review, or scheduling a call with a PeerSpot analyst.