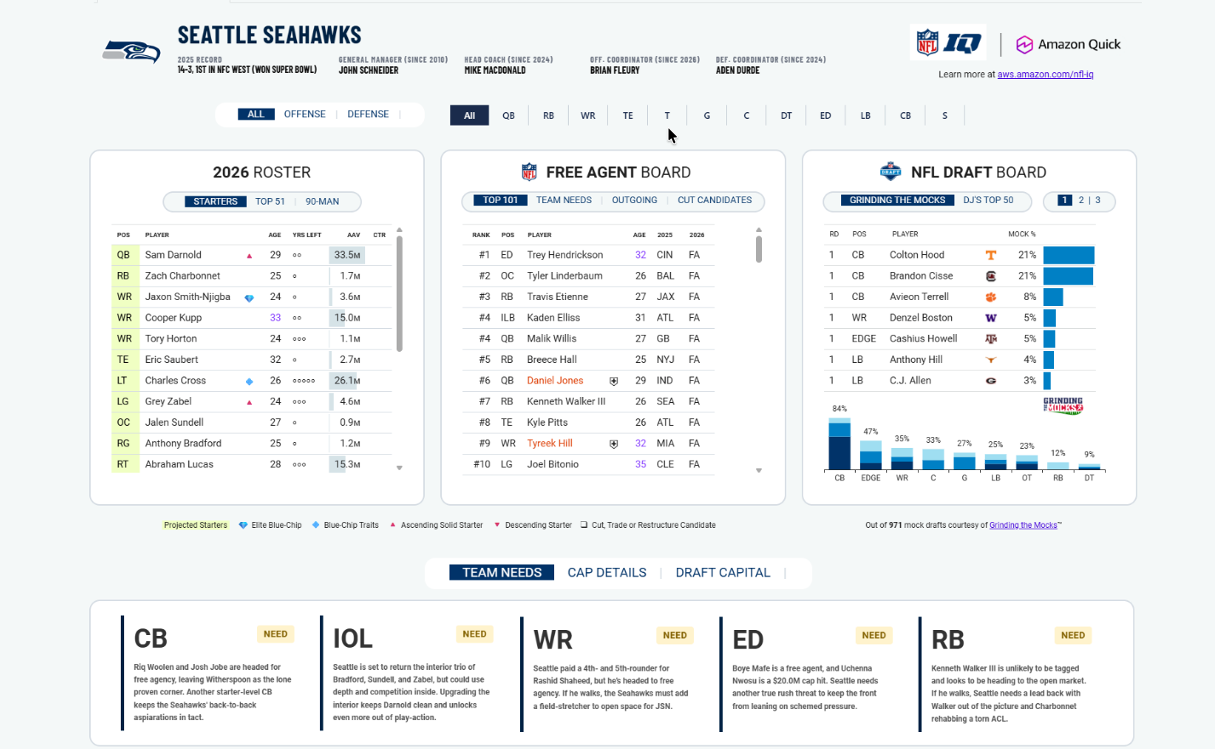
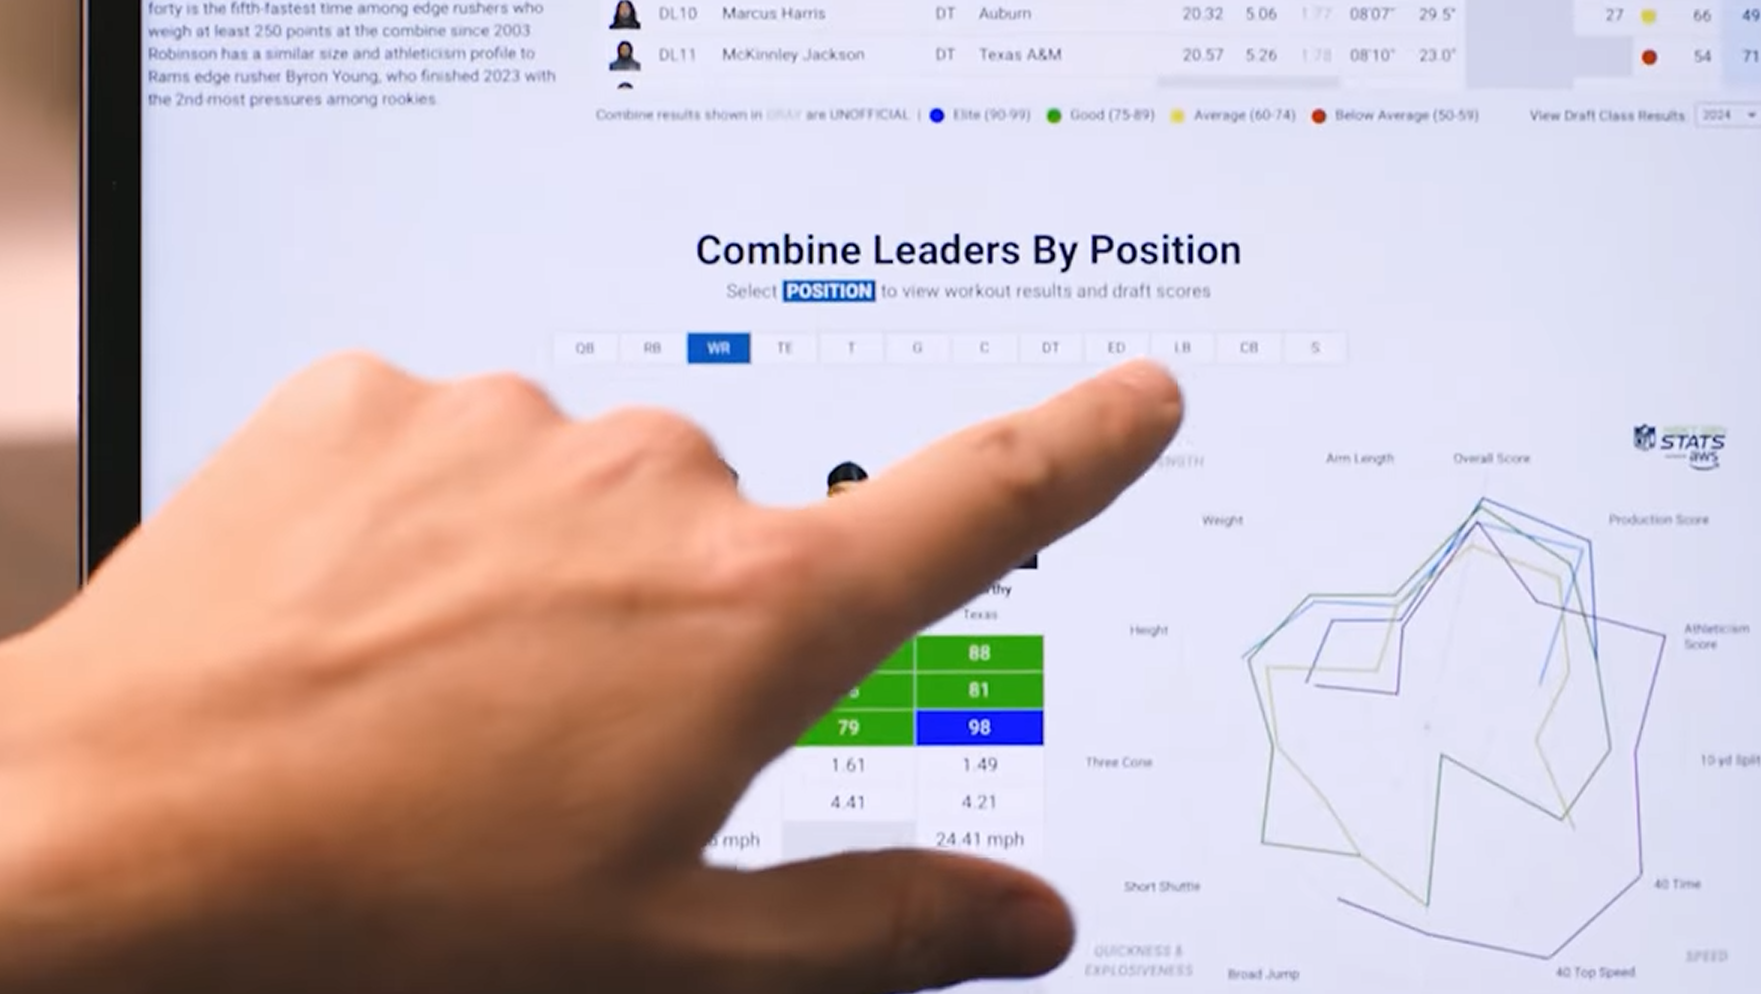
Introducing NFL IQ: AI-Powered Draft Intelligence Built on Amazon Quick
Explore how Amazon Quick powers the NFL's newest AI tool, bringing together Combine performance, free agency analysis, draft projections, and conversational AI into one unified fan experience.

Discover how AWS powers the NFL
AWS AI powers NFL Next Gen Stats.
Battle-tested AI infrastructure handling the pressure of live broadcasts and real-time decision-making. AWS run-ready AI means you deploy with confidence, not crossed fingers. Discover how it can drive impact for your business.
The AI-ready data foundation that powers every play
From Next Gen Stats to injury prediction, AWS data and analytics services help the NFL transform 500M+ data points per season into game-changing intelligence for teams, players, and fans.

A Decade of Next Gen Stats
Every NFL game generates millions of data points. 75 machine learning models running on AWS process that data in under a second, transforming football into a sport where every movement is measured, modeled and instantly analyzed.
NFL Digital Athlete: AI-Powered Player Health & Safety
✔ AI-Powered Injury Prevention: Analyzes millions of data points weekly from games and practices to predict injury risks and optimize player health and performance.
✔ Data-Driven Rule Evolution: Simulates thousands of scenarios to guide safety improvements, including the 2024 Dynamic Kickoff rule designed to reduce injuries.
✔ Proven Safety Results: Delivered 700 fewer injury-related game absences in 2023 and the fewest concussions on record in 2024 since tracking began.
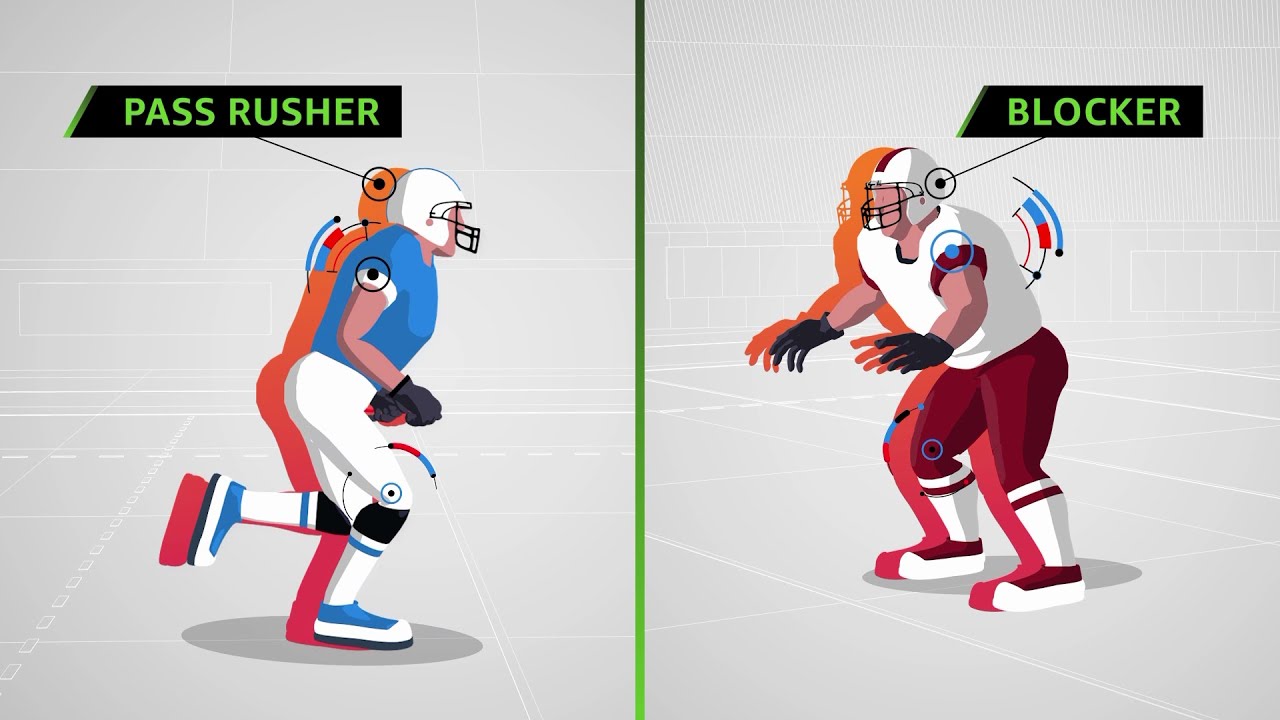
The technology behind the game
AWS + NFL's Next Gen Stats - Pressure Probability (1:43)
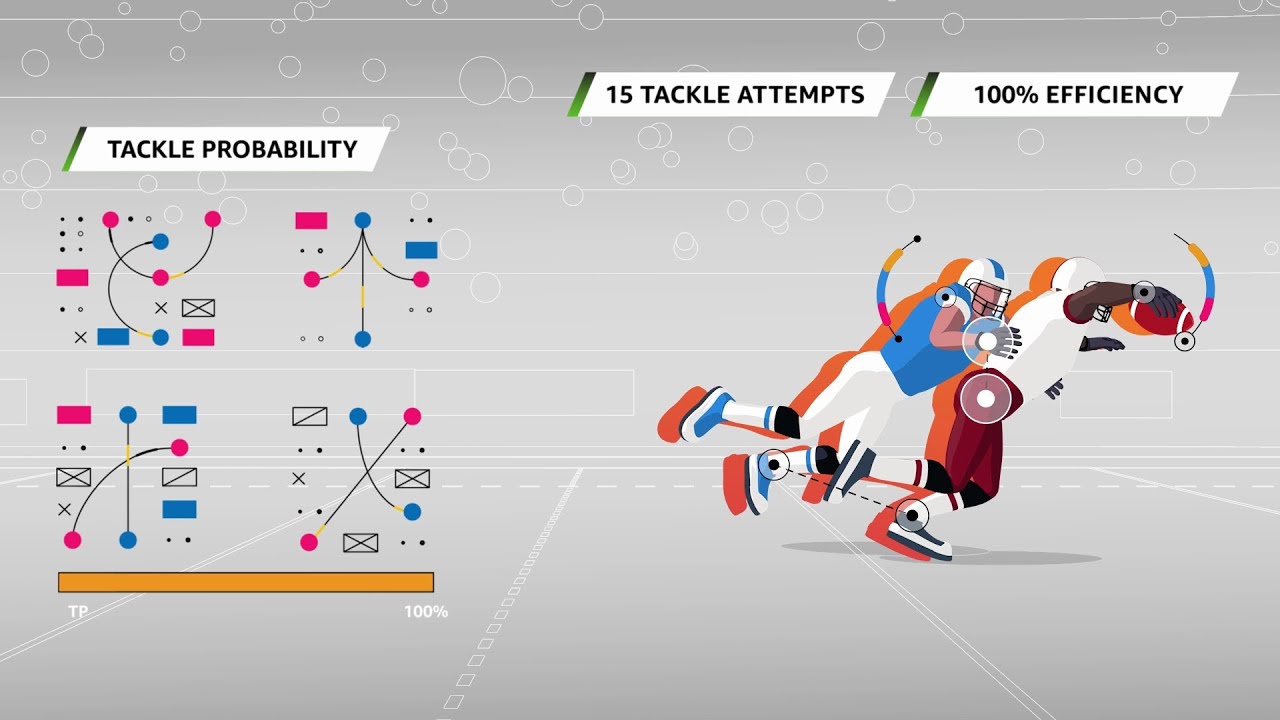
AWS and NFL - AI-powered Tackle Probability (1:53)
How the NFL builds the season schedule with AWS (1:00)
Inside the NFL’s innovative fan data platform (2:40)
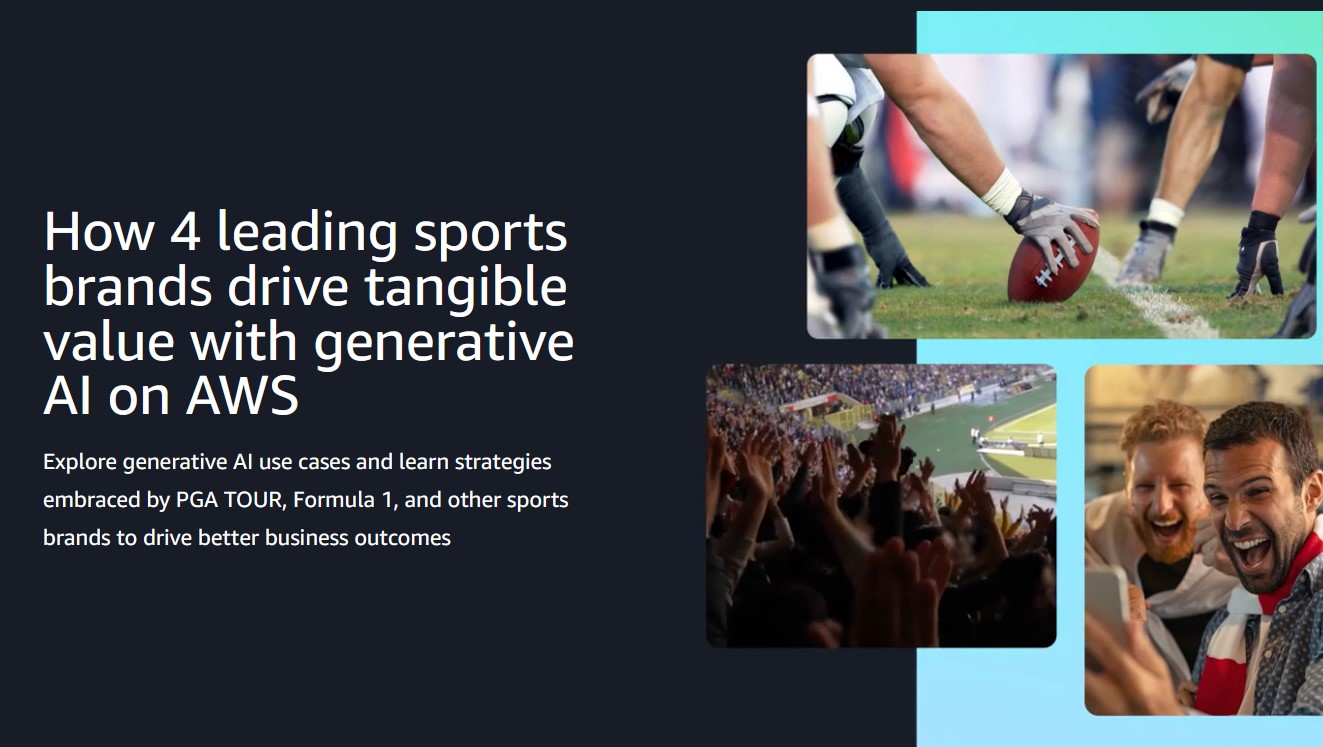
Fuel generative AI innovation: Lessons from sports leaders
Discover how leaders like Formula 1, the NFL & PGA TOUR use gen AI on AWS to enhance customer experiences, workforce productivity and process optimization. Leverage these real-world use cases to advance your gen AI journey.
Explore our sports partners


Discover more
Did you find what you were looking for today?
Let us know so we can improve the quality of the content on our pages