- AWS Solutions Library›
- Guidance
Guidance for Automating Networking Monitoring and Alerting on AWS
Overview
This Guidance demonstrates how to automate the setup of Amazon CloudWatch dashboards for monitoring and alerting network resources on AWS. It uses AWS tagging and API capabilities to efficiently gather the necessary information to configure the dashboards, including the ability to centralize monitoring across your AWS environment. This automated approach helps you save time and effort in establishing comprehensive network visibility while also making the process more adaptable to changes in your AWS infrastructure.
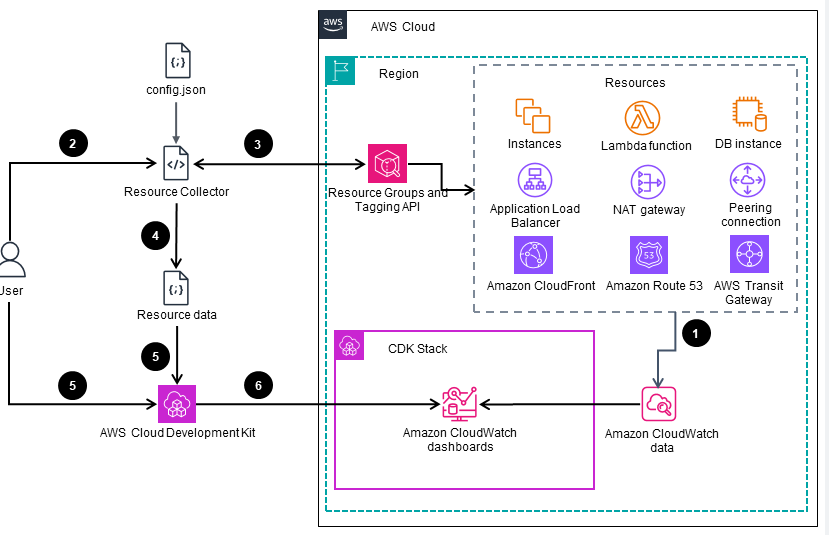
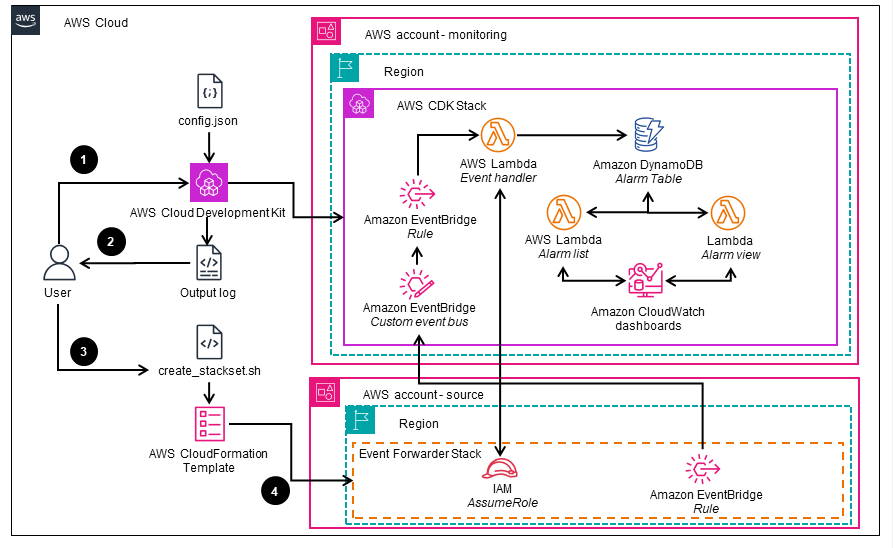
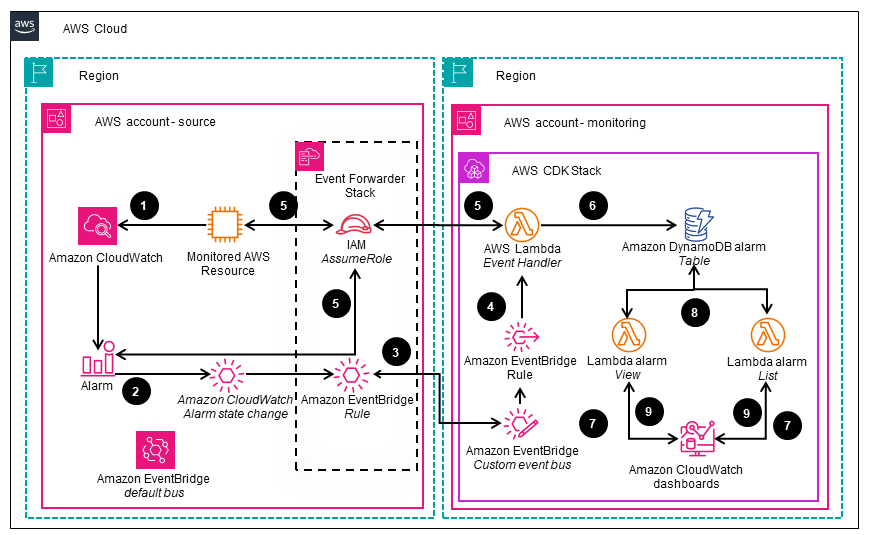
There are three architecture diagrams: the first illustrates the high-level automation process of deploying CloudWatch dashboards. The second diagram shows detailed information when configuring monitoring. The last diagram shows the flow of events when a CloudWatch alarm is triggered.
How it works
Overview
This architecture diagram illustrates the high-level automation process of deploying Amazon CloudWatch dashboards for network monitoring and alerting. The subsequent slides provide more detailed information on the configuration of monitoring (slide 2) and alerting (slide 3).

Monitoring
This architecture diagram shows how to generate and deploy the "Event Forwarder Stack," which is required for configuring the AWS accounts where the resources being monitored reside. These are the accounts that need to be configured to forward the CloudWatch alarm events to the central "monitoring" account.

Alerting
This architecture diagram shows the flow of events when a CloudWatch alarm is triggered. The alarm event is forwarded to an Amazon EventBridge event bus and processed by an AWS Lambda function. The ‘view’ and ‘list’ Lambda functions retrieve and render the alarm data in the CloudWatch dashboard.

Deploy with confidence
Everything you need to launch this Guidance in your account is right here
We'll walk you through it
Dive deep into the implementation guide for additional customization options and service configurations to tailor to your specific needs.
Let's make it happen
Ready to deploy? Review the sample code on GitHub for detailed deployment instructions to deploy as-is or customize to fit your needs.
Well-Architected Pillars
The architecture diagram above is an example of a Solution created with Well-Architected best practices in mind. To be fully Well-Architected, you should follow as many Well-Architected best practices as possible.
CloudWatch, Lambda, DynamoDB, and the AWS Systems Manager Parameter Store are used to automate the deployment and management of this Guidance. Specifically, CloudWatch is used for metrics storage, monitoring, and visualization, while Lambda handles event processing and alarm visualization. DynamoDB stores event data, and the Parameter Store manages metrics and the dashboard configuration. Collectively, these services support the manageability, monitoring, and automation of applications across Regions in a cost-effective manner.
IAM is used to control access to the resources deployed in this Guidance, with roles and policies scoped to minimum permissions. Lambda functions run with least privilege, and EventBridge has resource-based policies to prevent unauthorized access. These security measures align with AWS best practices, protecting resources and data by limiting access and reducing the risk of unauthorized activities.
The use of serverless Lambda functions, the reliable and scalable capabilities of DynamoDB, and the monitoring and alerting capabilities of CloudWatch enhance the overall reliability of this Guidance. Specifically, CloudWatch enables quick detection and response to issues, while Lambda and DynamoDB store and visualize alarm data to improve monitoring across your environments.
EventBridge is an AWS managed service that offers near real-time delivery of events to Lambda functions. Lambda is a serverless service that automatically scales in and out to meet the performance needs of the application. DynamoDB is used to enable fast querying of data while maintaining on-demand efficiency. Together, these services enable automated, on-demand performance optimization by connecting components, minimizing manual tasks, and providing observability through CloudWatch.
DynamoDB offers cost-efficient storage of the data used within this Guidance, achieved through the application of an on-demand charging model. Lambda is billed based on invocations, aligning the costs with the actual usage. CloudWatch is used to effectively monitor and manage the resources. Furthermore, DynamoDB, Lambda, and CloudWatch are serverless services that inherently possess the capability of elasticity, enabling automatic scaling out and scaling in as required.
The DynamoDB serverless architecture facilitates the storage of only event-driven data, thereby conserving the resources required for data storage. Similarly, the serverless architecture of Lambda helps ensures the use of only the necessary compute resources, which are subsequently released upon completion of the tasks, reducing waste and promoting efficient resource utilization. Furthermore, the event monitoring capabilities of CloudWatch can be used to identify potential AWS "resource waste" and further promote efficient resource utilization.
Disclaimer
Did you find what you were looking for today?
Let us know so we can improve the quality of the content on our pages