Troubleshooting
Overview
Understanding how to troubleshoot issues using CloudFront helps operators and SREs to quickly remediate errors that can happen at different part of the web application: CloudFront, edge functions, or the origin. Some of these errors include: An overwhelmed origin returning 5xx errors, CloudFront not able to connect to the origin, or failed Lambda@Edge execution after an unhandled exception in its code.
Tracing requests from users to the origin
CloudFront generates a unique request ID, for each and every request it processes. It is recommended to trace the request using it's ID as it flows across the application stack:
- CloudFront adds a x-amz-cf-id header that contains the request ID when it returns the response to an HTTP request.
- CloudFront include the request ID in the x-edge-request-id field of the log record generated for the request in access logs. If an AWS WAF WebACL is attached to the CloudFront distribution, the WAF includes the request ID in the requestId field of the log record generated for the request in WAF logs. For example, OLX built a chat bot that can be used by their customer support engineers in Slack to query a specific request by its rquest-ID from WAF logs to understand why they were blocked, and then respond faster to customer tickets on a daily basis.
- If an edge function is configured on the CloudFront distribution, the request ID is made available to the function in the requestId field in the event object, both for (CloudFront Functions, and Lambda@Edge).
- On caches misses, when CloudFront forwards the request to the origin, it appends the x-amz-cf-id header to the request, with the value of the request ID. It is recommended to log this header on your origin servers.
Troubleshooting errors using CloudFront
When your monitoring systems (e.g. CloudWatch alarms) detect an increase in responses with 4xx or 5xx errors, you need to dive into the error type and where it's occurring to remediate it.
To do that, filter CloudFront's access logs on records resulting in an error code, and check the x-edge-result-type, x-edge-response-result-type, and x-edge-detailed-result-type log fields to better understand the issue. Analyzing access logs depends on where do you store your logs. A very simple approach is to query logs stored in S3 using Athena with standard SQL queries. As an example, the following SQL query filters the logs for 5xx errors in a specific date range, limited to the first 100 records.
SELECT * AS count FROM cloudfront_logs
WHERE status >= 500 AND "date" BETWEEN DATE '2022-06-09' AND DATE '2022-06-10'
LIMIT 100;
In certain cases, consider the logs of WAF or CloudFront for additional troubleshooting information. For example, AWS WAF logs could explain why a certain request was blocked. Another example is checking edge functions logs in CloudWatch Logs to understand an execution error that resulted in a 5xx. Finally, it's recommended to understand how CloudFront caches errors to know when an error response is returned from CloudFront cache or not.
Troubleshooting latency using CloudFront
When your monitoring systems (e.g. CloudWatch alarms on Origin latency and Cache hit rate metrics ) detect an increase in response latencies, you need to understand where is latency bottleneck to remediate it. For this, consider analyzing latency fields in CloudFront's access logs. Consider the following fields:
- time-to-first-byte: First byte latency between CloudFront and the viewer, available in Standard logs and Real Time logs
- time-taken: last byte latency between CloudFront and the viewer, available in Standard logs and Real Time logs
- origin-fbl: first-byte latency between CloudFront and your origin, available in Real Time logs
- origin-lbl: last-byte latency between CloudFront and your origin, available in Real Time logs
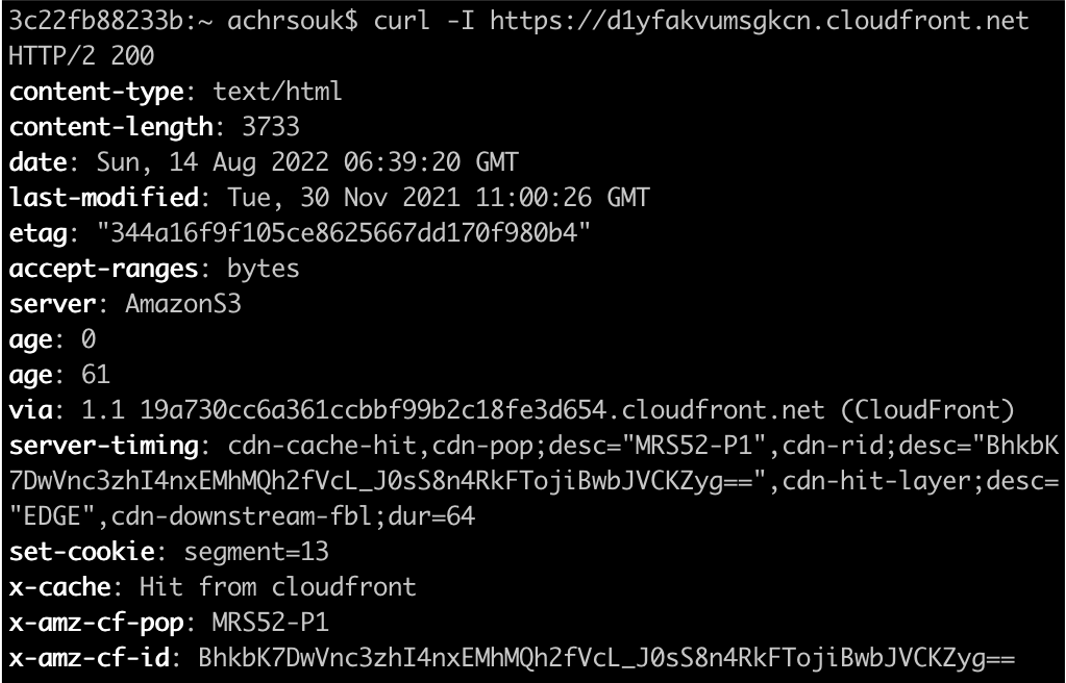
You can analyze these field by grouping the SQL query on one of the relevant dimensions, such as URL or country. This helps you to scope down the latency issue. In addition, you can find the same information on client-side using CloudFront's server timing headers, when configured in the response header policy. The below server timing header explains that my request was a cache hit on the MRS52-P1 pop in Marseille, with a downstream first byte latency of 64 milliseconds. Note the Age header generated by CloudFront to explain that this content has fetched or refreshed from the origin since 61 seconds.
Troubleshooting web performance using CloudWatch RUM
CloudWatch RUM allows you to monitor your application on the client side, by integrating a javascript tag to your web pages. The javascript collects data from browser APIs, such as page load times with breakdown in connection steps (DNS lookup, TCP connection, etc..) or Google Core Web Vitals (LCP, FID, etc..), and then send them to CloudWatch RUM for dashboarding. You can analyze your application performance by filtering on specific dimensions such as the browser type, user country, or a specific page id.
Asking for AWS Support assistance
In scenarios where you need the assistance of AWS support to further troubleshoot errors or latencies issues, open a ticket to support that includes a list of CloudFront request IDs that correspond to slow requests or requests resulting in errors. With these provided request IDs, Support engineers are able to dive into internal logs to better understand the issue and provide your with recommendations on how to remediate it.
Resources
- Documentation: Troubleshoot common problems you might encounter when setting up Amazon CloudFront to distribute your content
- Blog: Four Steps for Debugging your Content Delivery on AWS. Note that while this blog is outdated, the methodology is still valid.
- Documentation: How do I troubleshoot and reduce increased latency from CloudFront?
- How to: Troubleshooting articles for CloudFront by AWS Support
- How to: Troubleshooting articles for AWS WAF by AWS Support
- AWS re:Invent 2021 - Optimize applications through end user insights with Amazon CloudWatch RUM
- Blog: Analyzing AWS WAF Logs in Amazon CloudWatch Logs
- Documentation: Testing and debugging Lambda@Edge functions
- Blog: Set up end-to-end tracing with Amazon CloudFront using OpenTelemetry