Networking & Content Delivery
Set up end-to-end tracing with Amazon CloudFront using OpenTelemetry
In a modern distributed system, identifying where a problem has occurred is not a trivial task. In fact, it’s a key capability that an organization must master to maintain its competitiveness. Tracing is a great methodology to be used for this purpose. It creates a series of formatted logs with an identifier called Trace ID, which allows you to group the logs by requests that flow through a distributed system.
When something goes wrong, your administrator can easily identify where things start behaving differently by looking at the trace logs. Then your team can focus on that specific area instead of making a series of guesses across every part of the architecture.
Although many AWS managed services, such as Amazon API Gateway, support tracing with AWS X-Ray out of the box, there is a growing need for a bigger picture. Instead of seeing traces that starts from an API Gateway, you might want to see traces all the way from where a request is initially made. There is also a growing need for more choices. Depending on your situation, you might not choose AWS X-Ray as your data backend. Instead, you may want to store trace logs to a file system or a third-party solution.
To meet those needs, we have prepared a step-by-step guide for setting up tracing using OpenTelemetry that starts from Amazon CloudFront. You can find all of the code and resources used throughout this post in the associated Git repository. The concepts in this post are applicable to any situation where you want to setup an end-to-end tracing. However, note that the configuration we used for resources in this post, such as AWS Identity and Access Management (IAM), CloudFront, Amazon OpenSearch Service, Amazon Elastic Load Balancer (Amazon ELB), Amazon Elastic Container Registry (Amazon ECR), etc., are not suitable for production use as-is. You would need a thorough security review if you plan to take the concepts to your production environment.
Solution overview
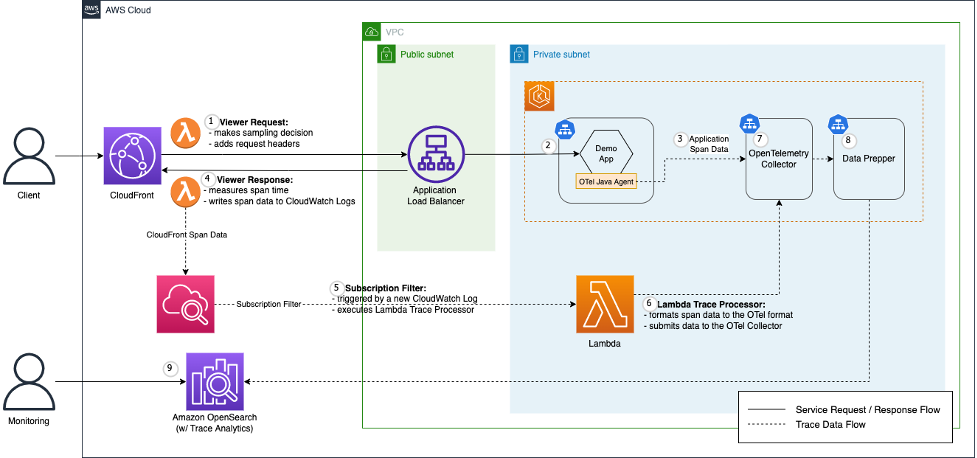
Figure 1: Solution Architecture Overview
We demonstrate end-to-end tracing with the above architecture. A demo application (“demo app”) is hosted in an Amazon Elastic Kubernetes Service (Amazon EKS) cluster to process end-user requests. Its API endpoint is exposed to the public via CloudFront. We use OpenTelemetry to trace user requests to the demo app API.
OpenTelemetry is a set of APIs, SDKs, tools, and integrations designed for telemetry data, such as traces, metrics, and logs. It serves as a common specification to generate and collect telemetry data in a vendor-agnostic way. We use OpenTelemetry to instrument trace logs generated from a CloudFront distribution and the demo app.
More specifically, we use the OpenTelemetry Java Agent to instrument the demo app written in Java. With simple configuration, the agent can automatically instrument Java applications. In contrast, there is no such auto instrumentation available for CloudFront. Therefore, we build an OpenTelemetry compatible payload within an AWS Lambda function and make an HTTP POST request to the same OpenTelemetry Collector that ingests auto-instrumented traces from Java applications.
The Collector serves as a common facade to collect, process, and export telemetry data to a tracing back-end of your choice. In this post, we adopt Amazon OpenSearch Service as the tracing back-end. At this time, the OpenTelemetry format cannot be directly ingested to Amazon OpenSearch service, so we use Data Prepper in between to convert the data format.
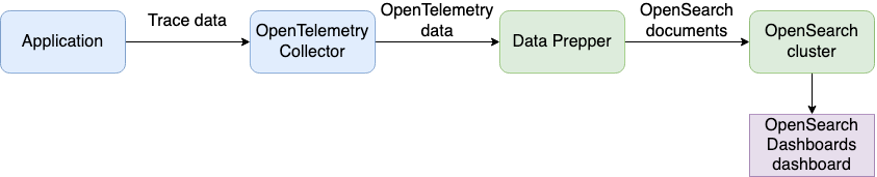
Figure 2: Trace data format conversion using Data Prepper
Installation
You can install the same architecture in your AWS account by following the steps specified in the associated Git repository. In short, you must host a docker image for the demo app to ECR and run the Terraform script provided at the repository.
Walkthrough
In this section, we follow user request flow and examine how tracing works. The order of the following sub-sections matches with the numbering in the solution overview diagram.
CloudFront viewer request function
CloudFront is at the forefront of our back-end architecture. When CloudFront receives a request from an end user, a CloudFront viewer request event is triggered if it is already defined and associated with the CloudFront distribution. This is a critical step in the tracing, as we can define a root span with its start time and propagate it to the origin in the form of a request header.
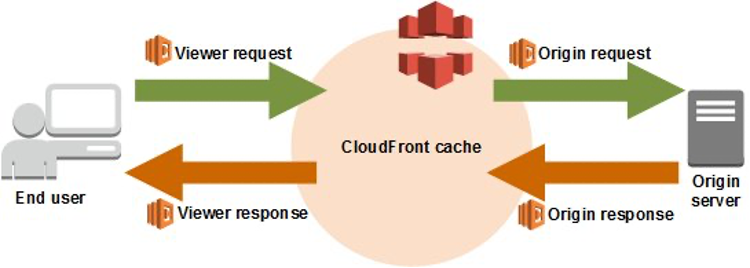
Figure 3: Concept of CloudFront Viewer Request Function and Viewer Response Function
Trace Context (or Span Context) is metadata about the span, such as Trace ID, Span ID, and sampling flag. Like breadcrumbs, Trace Context is attached to the request header and along with the request forwarded to the backing service. Therefore, the backing service can create a child span and associate it with the parent span.
The CloudFront viewer request function code does the following:
- In lines 7-11, we generate the root span’s trace context. We used
requestIdgenerated by CloudFront, a binary blob of base64 into a hexadecimal string so that ourtraceIdandspanIdare compatible with b3 specification. - In lines 14-16, the
traceIdandspanIdare attached to request headers with the header key,b3. The header is propagated to the OpenTelemetry Java Agent. - We set the sampling rate to 1 for demonstration. In production, you set the rate between 0 and 1 for performance.
- We attach another request header,
trace-start-time, to record the start time of the root span. The Viewer Response Function includes it into the root span data.
Demo app
Your request is served by the demo app, a back-end Java application, running on Amazon EKS. The OpenTelemetry Java Agent records each application transaction as a set of correlated span data, and forwards the data to OpenTelemetry Collector.
OpenTelemetry Java Agent
Using OpenTelemetry, we can instrument Java applications either manually or automatically. In most cases, using automatic instrumentation is sufficient for tracing purpose. Moreover, by using OpenTelemetry Java Agent, we don’t need to add static dependency to applications because the agent inserts bytecode at runtime. Therefore, we use the agent to instrument the demo app.
To enable OpenTelemetry Java Agent, we add a Java option when we run application jar file:
java -javaagent:/path/to/aws-opentelemetry-agent.jar -jar app.jarWe inject agent configurations as environment variables:
OTEL_EXPORTER_OTLP_ENDPOINT: this is the endpoint to which OpenTelemetry Java Agent sends telemetry data. Here, we configured the agent to send trace data to the OpenTelemetry Collector via GRPC protocol (Port 4318).OTEL_TRACES_EXPORTER="otlp": the agent exports trace data in the OpenTelemetry format.OTEL_PROPAGATORS="b3": the agent uses the b3 specification to handle trace context in the request header.OTEL_TRACES_SAMPLER="parentbased_always_off": the agent generates span data only if the preceding service sends trace context with the sampling flag turned on.
CloudFront viewer response function
When CloudFront returns a response back to an end user, a CloudFront viewer response event is triggered if it is already defined and associated with the CloudFront distribution. This is the step where an Amazon CloudWatch Log containing the CloudFront requestId, trace-start-time, trace-end-time and b3 propagation header is created.
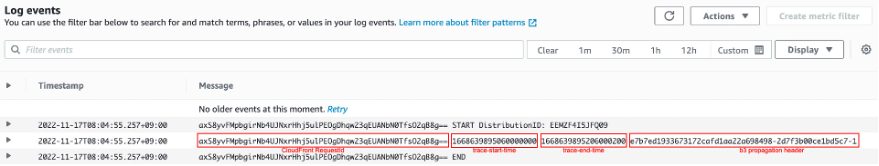
Figure 4: CloudWatch Log written by CloudFront Viewer Response Function
The CloudFront viewer response function code does the following:
- In lines 5-10, we parse the header value with a key
trace-sample-rateto decide whether or not to write the log to CloudWatch. - In line 8, we write a log to CloudWatch. You can extend this concept and add an arbitrary value to the log to achieve better observability.
- In line 9, we add the b3 header generated in the viewer request function to the response header.
CloudWatch Subscription Filter
CloudWatch Subscription Filter lets you deliver a subset of log events that matches a given filter expression to other services, such as an Amazon Kinesis stream, an Amazon Kinesis Data Firehose stream, or a Lambda function. In this post, we used a Lambda function as a destination service for the event.
To filter out unnecessary log items from the CloudWatch Logs, we added a subscription filter as follows. By applying this filter, the lines with START or END are ignored, and only the lines with the trace-start-time, trace-end-time and b3 header are delivered to the Lambda function.
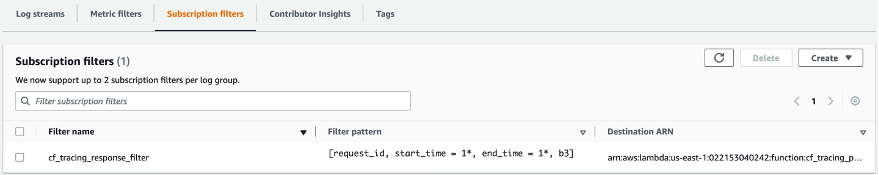
Figure 5: CloudWatch Subscription Filter
Lambda Trace Processor
Upon receiving a base64 encoded and gzip compressed log event from the CloudWatch Subscription Filter, a Lambda function, named as Lambda Trace Processor, builds an OpenTelemetry compatible payload and makes an HTTP POST request to the OpenTelemetry Collector.
In the following, we highlight the key parts of the Lambda Trace Processor code:
- In lines 26-39, we unzip the event data and populate an OpenTelemetry compatible payload with the information retrieved from the event data.
- In lines 41-51, we submit the payload to an OpenTelemetry Collector.
- We tag the root span data with the service name attribute (lines 66-71).
- In the payload, we attach the root span data (lines 96-99) including trace ID, span ID, and the start and end time of the root span.
- We name the root span as the CloudFront distribution’s domain name (line 100).
- Optionally, we can add the CloudFront request ID (lines 103-108) to the span as an additional attribute for debugging purpose.
OpenTelemetry Collector
OpenTelemetry Collector serves as a common pipeline to receive, process, and export telemetry data. The collector receives telemetry data from instrument libraries and agents, handles additional processing, such as batching, retries, and encryption, as well as forwards the data to an observability backend. Although you can send telemetry data to a backend without the collector, it is recommended to use the collector in the production environment.
We deploy the collector as a gateway service in Amazon EKS cluster to collectively send trace data to Data Prepper, another data pipeline to convert OpenTelemetry data into the Amazon OpenSearch Service document format. You can refer to the detailed collector configuration at the GitHub repository.
Data Prepper
Although OpenTelemetry Collector is designed to support multiple observability back-ends, at this time, it can’t directly export data to Amazon OpenSearch Service. Data Prepper is another telemetry data pipeline developed under the Amazon OpenSearch Service project. We use Data Prepper to convert the data exported from OpenTelemetry Collector into the Amazon OpenSearch Service compatible format.
Amazon OpenSearch – Trace Analytics
All trace data are ultimately saved to Amazon OpenSearch Service. Using the Trace Analytics for Amazon OpenSearch Service, we can visualize request flow and analyze any performance problem. To explore the sample trace, we first send an API request to our back-end using CURL (run terraform output command to locate the demo app endpoint URL):
curl --head {demo-app_endpoint_url}In the terminal output, locate the b3 response header. Separated by hyphens (“-“), the first part of the b3 header is the Trace ID associated with our request.
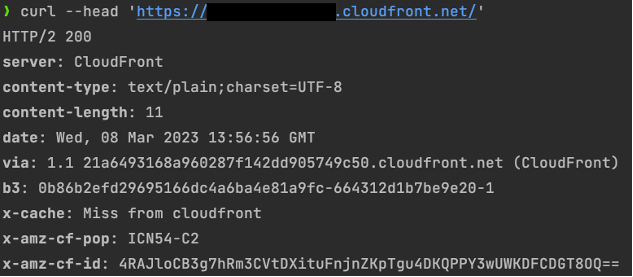
Figure 6: Demo App API call terminal output
Next, let’s log in to Amazon OpenSearch Service to view the trace data. Run the terraform output command to locate the Amazon OpenSearch Service Kibana Dashboard URL and log in. For log in information, you can refer to the Terraform variables file.
Once logged in, navigate to Trace Analytics > Traces. There you can find the trace ID associated with the request that we made. If there isn’t one, then you might need to adjust the query time range in the upper right side. Select the trace ID in the list to view the trace details.
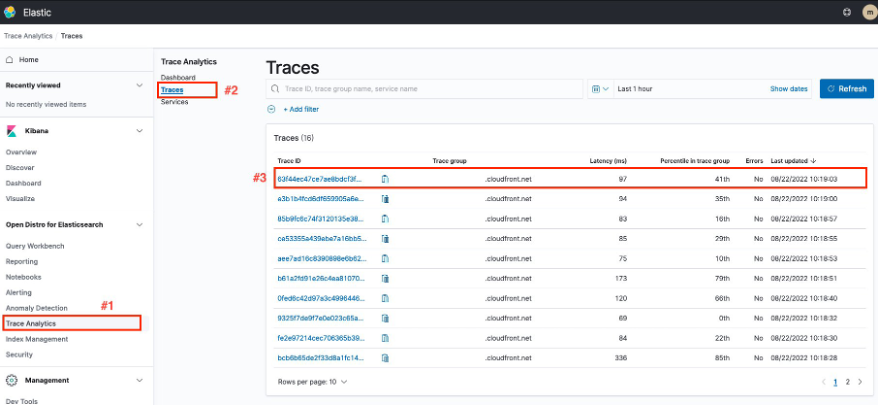
Figure 7: Trace List in the OpenSearch Trace Analytics Page
This is the detail page of the trace. From the pie chart in the middle, you can find that trace data were collected from CloudFront and the demo app. Right of the pie chart is a tree view of spans in the trace. It graphically shows the time order of spans (vertically) and the duration of each span (horizontally).
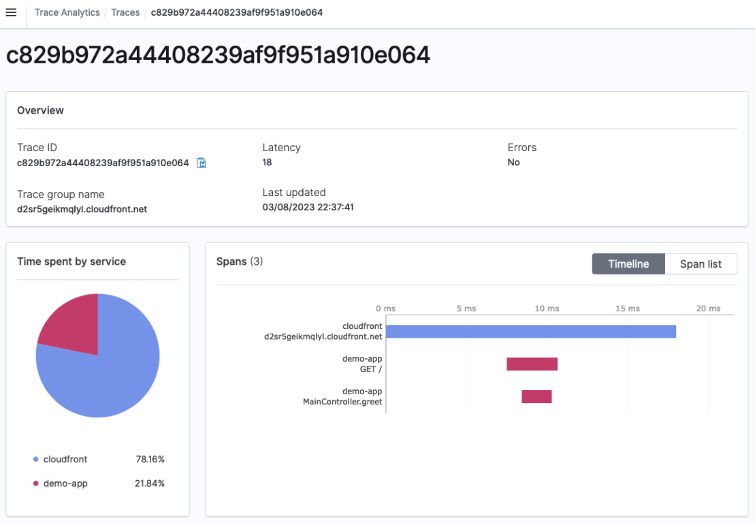
Figure 8: Trace Details in the OpenSearch Trace Analytics
Conclusion
We’ve built a sample back-end system on AWS and showed that you can trace user requests starting from CloudFront. Furthermore, you can use trace data to better understand the distributed system and identify performance bottleneck.
By leveraging OpenTelemetry’s compatibility, you can write CloudFront Functions to instrument CloudFront. OpenTelemetry is a vendor-neutral open source observability framework. It attempts to standardize the telemetry data format and collecting process. It is becoming an industry standard and already supported by multiple vendors including AWS.
If you haven’t already done so, we recommend you check out OpenTelemetry and try using it to enhance observability in your applications.

Wooyoung Jung
Wooyoung Jung is an Application Architect working at AWS Professional Services. He has a lot of interest in software design and enterprise architecture. He primarily helps enterprise customers modernize their applications.

Eunju Rho
Eunju is an Application Developer in AWS Professional Services. She works with AWS customers to build and modernize customer applications in the cloud.

Sean Lee
Sean Lee is a Senior Application Architect at Amazon Web Services. His focus areas includes Containers, Serverless and DevOps. He is passionate about enabling customers build cloud-native applications using AWS services.