背景
随着社交媒体应用越来越注重用户体验,用于加速内容分发的CDN产品已经成为最常用的服务,尤其是在视频点播和直播场景中。如果在视频内容分发过程中出现过多次数卡顿和播放失败等情况,会严重影响应用的使用活跃度。如何评价一个CDN的加速质量,并对其进行实时质量监控成为一个较为棘手的问题。本文将会收集客户端和服务端的网络性能指标,并使用亚马逊云科技的时序数据库Amazon Timestream和Amazon Managed Grafana对这些指标进行实时统计分析,帮助用户了解CDN加速效果,并为快速定位问题提供依据。
架构说明
Amazon CloudFront 是一种内容分发网络 (CDN) 服务,在全球拥有数以千计的第 1/2/3 层电信运营商,与所有主要接入网络连接良好,可实现最佳性能,并具有数百 TB 的部署容量。本架构会收集服务端(Amazon CloudFront)日志和客户端自定义日志,并存储在S3中。当日志到达S3时会触发Lambda函数对客户端日志和服务端日志分别进行格式转换,并将关键数据指标推送到亚马逊时序数据库Amazon Timestream中。在Amazon Timestream存在多个数据表,为了快速查询,3天内的数据会驻留在内存中,为了节省成本,2周后数据会被数据库自动删除。用于可视化展示的性能仪表盘使用Amazon Managed Grafana。

方案部署
- 创建S3存储桶,并分别创建客户端日志目录和服务端日志目录

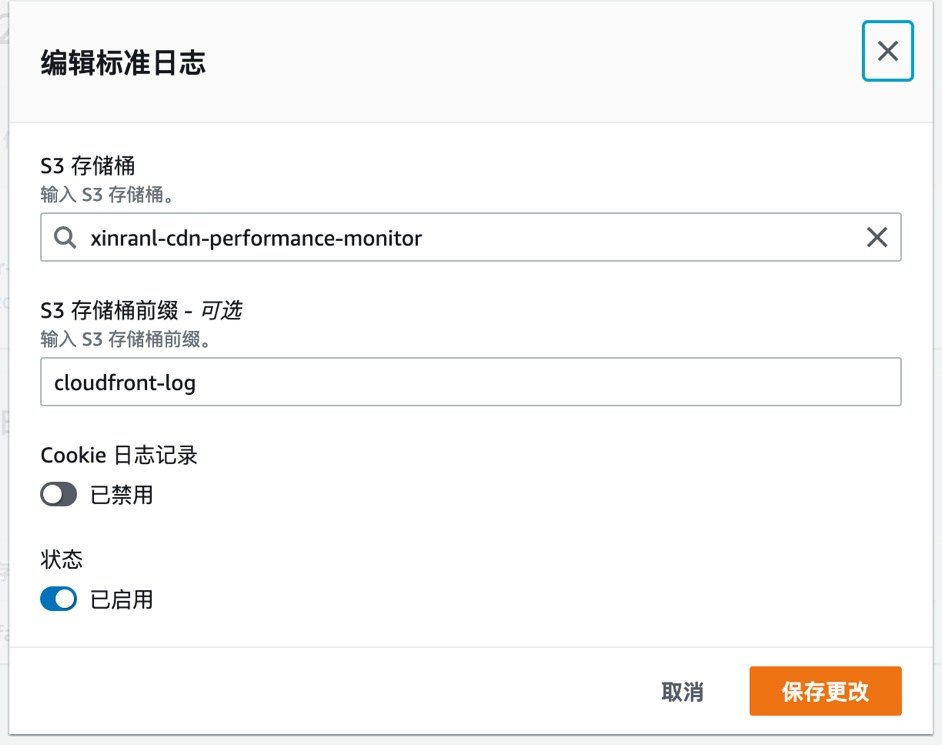
- 打开CloudFront服务端日志,并将日志存储位置指向为刚创建的S3目录

- 本博客中客户端日志由EC2上部署的日志收集服务进行收集汇聚,然后定时将压缩的.gz日志存储到S3指定目录中,客户端日志数据结构如下:
| ClientTime |
1642520043060 |
| System |
ANDROID_PHONE |
| Host |
xinranl.com |
| URL |
http://xinranl.com/test/video.mp4 |
| Bytes |
208683 |
| ServerIP |
143.204.110.58 |
| ClientIP |
240.199.105 |
| Country |
新加坡 |
| Protocol |
http/1.1 |
| ASN |
5388 |
| ErrorCode |
0 |
| NetCost |
121 |

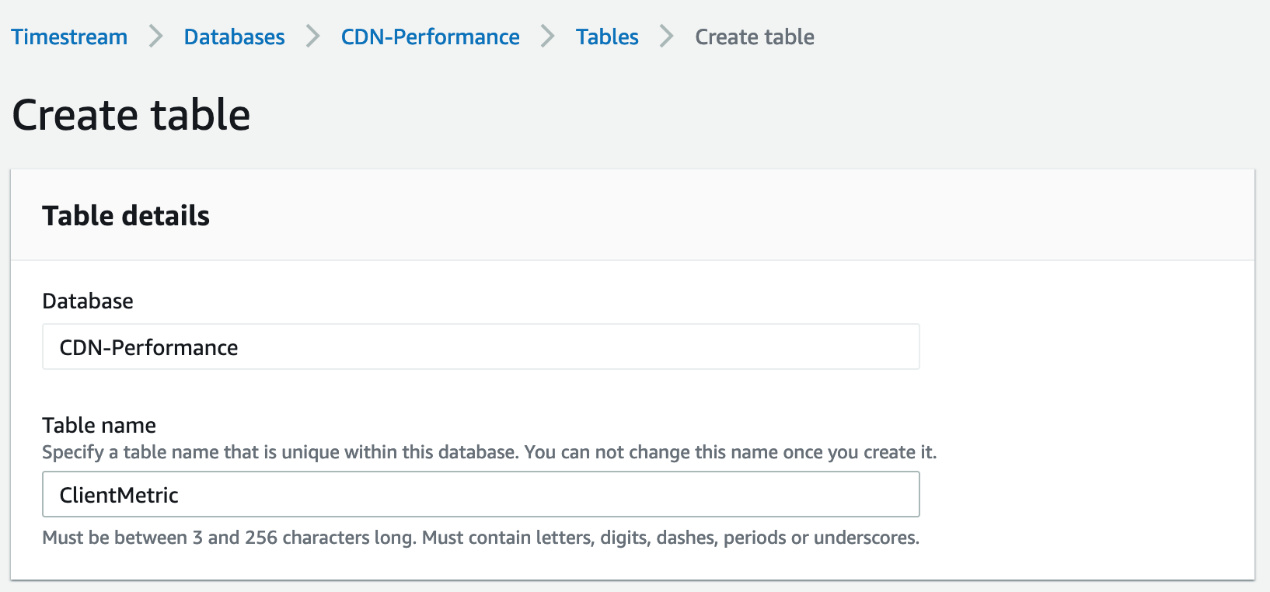
- 创建客户端上传的指标表ClientMetric,在内存驻留时间为3天,2周后的数据将被删除。


- 同样方式创建用于存储服务器端日志的数据表CloudFrontMertic
- 配置S3触发Lambda函数,分别对服务端日志和客户端日志进行格式转换,并通过AWS SDK将数据注入时序数据库Timestream中,下面为Lambda 函数 TransformClientLogtoTimestream 的配置:

import os

import gzip

import time

import boto3

import json

import urllib.parse

from botocore.config import Config


s3 = boto3.client('s3')


def load_data_from_object(filename):

    records = []

    try:

        with gzip.open(filename, 'rt') as f:

            for text in f:

                temp = text.split()

                data_row = {

                    'ClientTime': temp[0],

                    'System': temp[1],

                    'Host': temp[2],

                    'URL': temp[3],

                    'Bytes': temp[4],

                    'ServerIP': temp[5],

                    'ClientIP': temp[6],

                    'Country': temp[7],

                    'Protocol': temp[8],

                    'ASN': temp[9],

                    'ErrorCode': temp[10],

                    'NetCost': temp[11]

                }

                dimensions = [

                    {'Name': 'ServerIP', 'Value': data_row['ServerIP']},

                    {'Name': 'ClientIP', 'Value': data_row['ClientIP']},

                    {'Name': 'protocol','Value': data_row['Protocol']},

                    {'Name': 'ASN','Value': data_row['ASN']},

                    {'Name': 'Country','Value': data_row['Country']},

                    {'Name': 'ErrorCode','Value': data_row['ErrorCode']}

                ]

                record_netcost = {

                    'Dimensions': dimensions,

                    'MeasureName': 'neatcost',

                    'MeasureValue': data_row['NetCost'],

                    'MeasureValueType': 'BIGINT',

                    'Time': data_row['ClientTime']

                }

                records.append(record_netcost)

    except Exception as e:

        print('load_data_from_log_file error:',str(e))

        return None

    return records


def write_records(data):

    session = boto3.Session()

    write_client = session.client('timestream-write',

        config=Config(read_timeout=20,

            max_pool_connections=5000,

            retries={'max_attempts': 10}))

    i = 1

    Records = []

    while len(data) > 100*i:

        Records = data[(i-1)*100:(i)*100-1]

        try:

            result = write_client.write_records(DatabaseName='CDN-Performance',

                TableName='ClientMetric',

                Records=Records,

                CommonAttributes={})

            print("Have WriteRecords num:",100*i)

        except write_client.exceptions.RejectedRecordsException as err:

            print("RejectedRecords: ", err)

            for rr in err.response["RejectedRecords"]:

                print("Rejected Index " + str(rr["RecordIndex"]) + ": " + rr["Reason"])

        except Exception as err:

            print("Error:", err)

        i = i + 1

    if len(data) < i*100:

        Records = data[(i-1)*100:]

        try:

            result = write_client.write_records(DatabaseName='CDN-Performance',

                TableName='ClientMetric',

                Records=Records,

                CommonAttributes={})

            print("Have WriteRecords num:",len(data))

            #print("WriteRecords Status: [%s]" % result['ResponseMetadata']['HTTPStatusCode'])

        except write_client.exceptions.RejectedRecordsException as err:

            print("RejectedRecords: ", err)

            for rr in err.response["RejectedRecords"]:

                print("Rejected Index " + str(rr["RecordIndex"]) + ": " + rr["Reason"])

        except Exception as err:

            print("Error:", err)


def lambda_handler(event, context):

    bucket = event['Records'][0]['s3']['bucket']['name']

    key = urllib.parse.unquote_plus(event['Records'][0]['s3']['object']['key'], encoding='utf-8')

    try:

        response = s3.get_object(Bucket=bucket, Key=key)

        data = load_data_from_object(response['Body'])

        write_records(data)

    except Exception as e:

        print(e)

        print('Error getting object {} from bucket {}.'.format(key, bucket))

        raise e

l  同样的方式配置处理CloudFront日志函数TransformCFLogToTimestream,函数源码如下:

import os

import gzip

import time

import boto3

import json

import urllib.parse

from datetime import datetime

from botocore.config import Config


s3 = boto3.client('s3')


def load_data_from_object(filename):

    print("load_data_from_log_file....")

    records = []

    try:

        with gzip.open(filename, 'rt') as f:

            for text in f:

                temp = text.split()

                if temp[0].startswith('#'):

                    continue

                data_row = {

                    'date': temp[0],

                    'time': temp[1],

                    'x-edge-location': temp[2],

                    'sc-bytes': temp[3],

                    'c-ip': temp[4],

                    'cs-method': temp[5],

                    'Host': temp[6],

                    'cs-uri-stem': temp[7],

                    'sc-status': temp[8],

                    'Referer': temp[9],

                    'User-Agent': temp[10],

                    'cs-uri-query': temp[11],

                    'Cookie': temp[12],

                    'x-edge-result-type': temp[13],

                    'x-edge-request-id': temp[14],

                    'x-host-header': temp[15],

                    'cs-protocol': temp[16],

                    'cs-bytes': temp[17],

                    'time-taken': temp[18],

                    'x-forwarded-for': temp[19],

                    'ssl-protocol': temp[20],

                    'ssl-cipher': temp[21],

                    'x-edge-response-result-type': temp[22],

                    'cs-protocol-version': temp[23],

                    'fle-status': temp[24],

                    'fle-encrypted-fields': temp[25],

                    'c-port': temp[26],

                    'time-to-first-byte': temp[27],

                    'x-edge-detailed-result-type': temp[28],

                    'sc-content-type': temp[29],

                    'sc-content-len': temp[30],

                    'sc-range-start': temp[31],

                    'sc-range-end': temp[32]

                }

                dimensions = [

                    {'Name': 'ClientIP', 'Value': data_row['c-ip']},

                    {'Name': 'location', 'Value': data_row['x-edge-location']},

                    {'Name': 'ResultType','Value': data_row['x-edge-result-type']}

                ]


                record_first_byte = {

                    'Dimensions': dimensions,

                    'MeasureName': 'FirstByteCost',

                    'MeasureValue': str(int(float(data_row['time-to-first-byte'])*1000)),

                    'MeasureValueType': 'BIGINT',

                    'Time': str(int(datetime.strptime(data_row['date']+' '+data_row['time'], "%Y-%m-%d %H:%M:%S").timestamp()))

                }

                records.append(record_first_byte)

    except Exception as e:

        print('load_data_from_log_file error:',str(e))

        return None

    return records


def write_records(data):

    session = boto3.Session()

    write_client = session.client('timestream-write',

        config=Config(read_timeout=20,

            max_pool_connections=5000,

            retries={'max_attempts': 10}))

    i = 1

    Records = []

    while len(data) > 100*i:

        Records = data[(i-1)*100:(i)*100-1]

        try:

            result = write_client.write_records(DatabaseName='CDN-Performance',

                TableName='CloudFrontMetric',

                Records=Records,

                CommonAttributes={})

            print("Have WriteRecords num:",100*i)

        except write_client.exceptions.RejectedRecordsException as err:

            print("RejectedRecords: ", err)

            for rr in err.response["RejectedRecords"]:

                print("Rejected Index " + str(rr["RecordIndex"]) + ": " + rr["Reason"])

        except Exception as err:

            print("Error:", err)

        i = i + 1

    if len(data) < i*100:

        Records = data[(i-1)*100:]

        try:

            result = write_client.write_records(DatabaseName='CDN-Performance',

                TableName='ClientMetric',

                Records=Records,

                CommonAttributes={})

            print("Have WriteRecords num:",len(data))

            #print("WriteRecords Status: [%s]" % result['ResponseMetadata']['HTTPStatusCode'])

        except write_client.exceptions.RejectedRecordsException as err:

            print("RejectedRecords: ", err)

            for rr in err.response["RejectedRecords"]:

                print("Rejected Index " + str(rr["RecordIndex"]) + ": " + rr["Reason"])

        except Exception as err:

            print("Error:", err)


def lambda_handler(event, context):

    bucket = event['Records'][0]['s3']['bucket']['name']

    key = urllib.parse.unquote_plus(event['Records'][0]['s3']['object']['key'], encoding='utf-8')

    try:

        response = s3.get_object(Bucket=bucket, Key=key)

        data = load_data_from_object(response['Body'])

        write_records(data)

    except Exception as e:

        print(e)

        print('Error getting object {} from bucket {}. Make sure they exist and your bucket is in the same region as this function.'.format(key, bucket))

        raise e


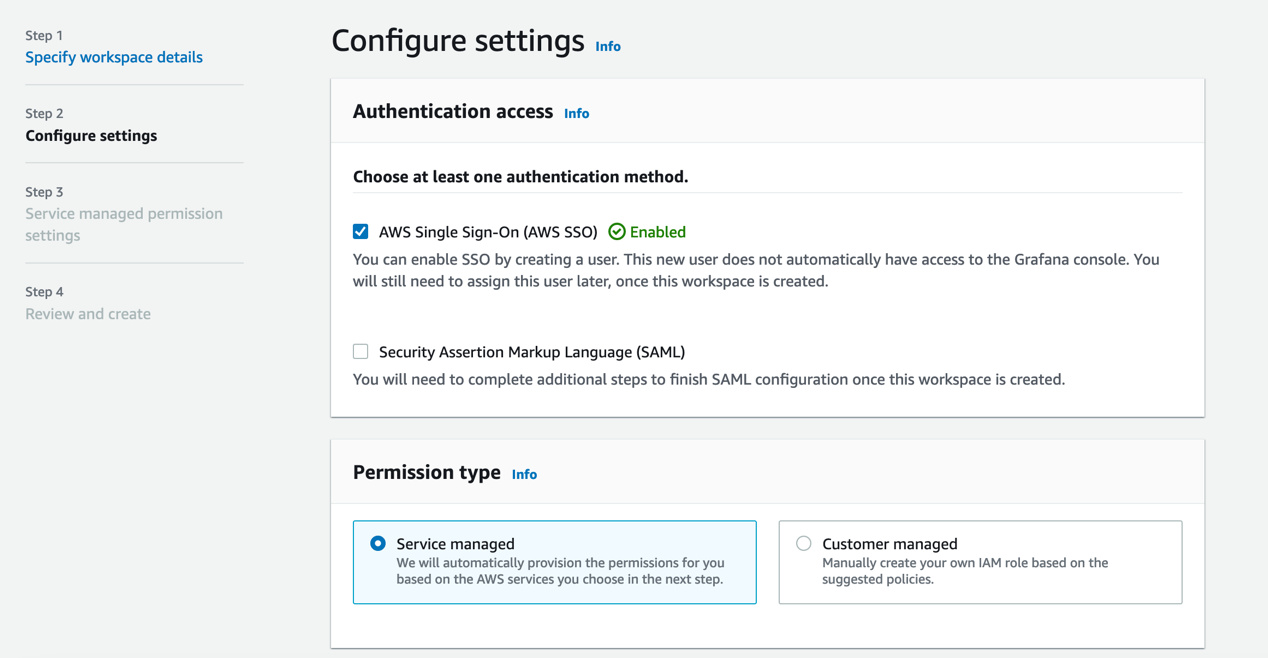
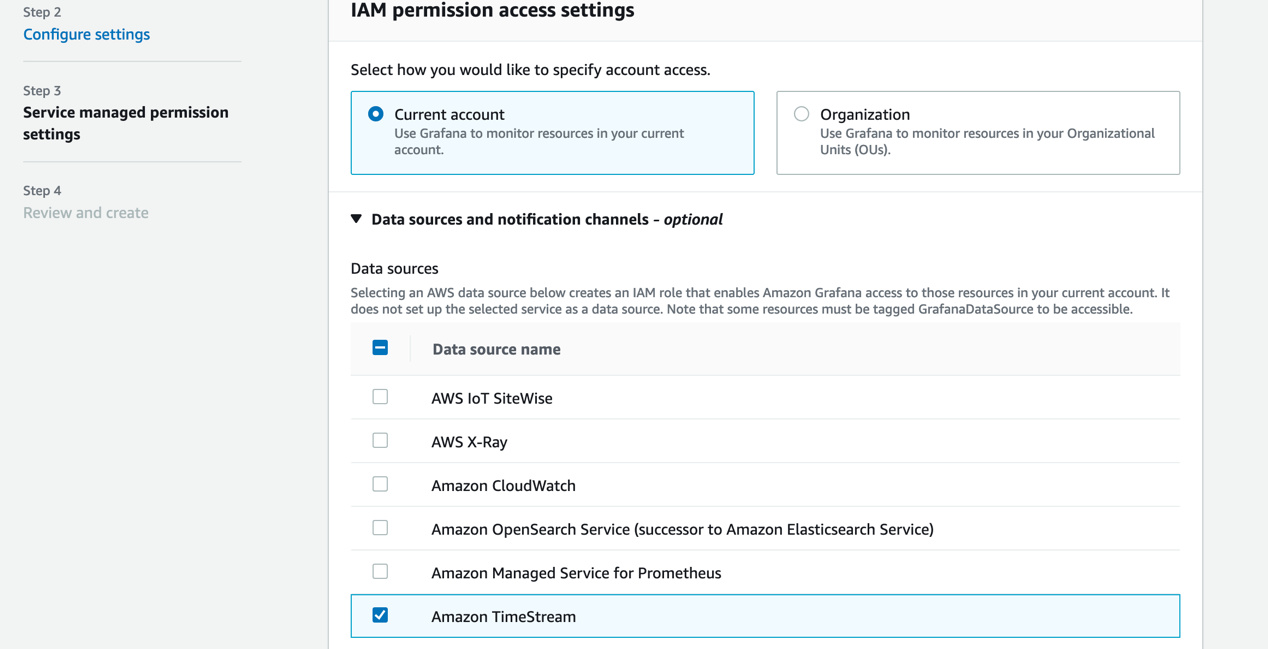
- 配置Grafana读取的数据源,本文使用上一步创建的Amazon Timestream

- 使用邮箱注册登录用户,并将用户设置为管理员,否则该用户无Grafana页面的配置权限

- 通过Grafana管理工作区中提供的URL登录到Grafana页面,配置数据源选择Amazon Timestream 和其所在Region,提供可以访问Amazon Timestream 的AK/SK。

配置Grafana Dashboard
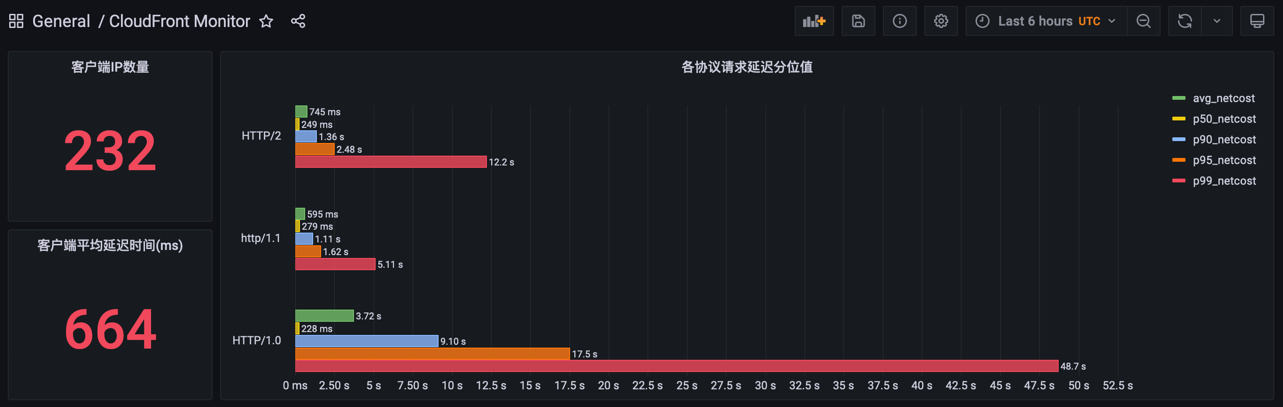
本案例中的监控面板提供以下功能:
SELECT COUNT(DISTINCT ClientIP) as IP_NUM
FROM "CDN-Performance"."ClientMetric"
WHERE $__timeFilter
AND measure_name='netcost'
SELECT ROUND(AVG(measure_value::bigint), 2) AS avg_netcost
FROM "CDN-Performance"."ClientMetric"
WHERE measure_name = 'netcost'
AND $__timeFilter
select protocol,
    ROUND(AVG(measure_value::bigint), 1) AS avg_netcost,
    ROUND(APPROX_PERCENTILE(measure_value::bigint, 0.5), 2) AS p50_netcost,
    ROUND(APPROX_PERCENTILE(measure_value::bigint, 0.9), 2) AS p90_netcost,
    ROUND(APPROX_PERCENTILE(measure_value::bigint, 0.95), 2) AS p95_netcost,
    ROUND(APPROX_PERCENTILE(measure_value::bigint, 0.99), 2) AS p99_netcost
FROM "CDN-Performance"."ClientMetric"
WHERE measure_name = 'netcost'
    AND $__timeFilter
GROUP BY protocol
select ServerIP, count(*) as num
FROM "CDN-Performance"."ClientMetric"
WHERE $__timeFilter
Group By ServerIP
order by num desc
select ASN asn , count(*) as num
FROM "CDN-Performance"."ClientMetric"
WHERE $__timeFilter
Group By ASN
order by num desc
select protocol, count(*) as num
FROM "CDN-Performance"."ClientMetric"
WHERE $__timeFilter
Group By protocol
order by num desc
select country, count(*) as num
FROM "CDN-Performance"."ClientMetric"
WHERE $__timeFilter
Group By country
order by num desc
SELECT ClientIP, round(approx_percentile( measure_value::bigint, 0.90 ), 0) as netcost
FROM "CDN-Performance"."ClientMetric"
WHERE $__timeFilter
group by ClientIP
order by netcost desc limit 20
SELECT a.ClientIP, CREATE_TIME_SERIES(time, measure_value::bigint) as netcost FROM "CDN-Performance"."ClientMetric" a
INNER JOIN (SELECT ClientIP, round(approx_percentile( measure_value::bigint, 0.95 ), 0) as netcost, count(*) as nums
    FROM "CDN-Performance"."ClientMetric"
    WHERE $__timeFilter
    group by ClientIP
    order by netcost desc limit 20) b
ON a.ClientIP=b.ClientIP
WHERE $__timeFilter
AND measure_name = 'netcost'
GROUP BY a.ClientIP
最终监控页面展示效果,如下:


本篇作者