Using load shedding to avoid overload
Software Delivery and Operations | LEVEL 400
Introduction
For a few years, I worked on the Service Frameworks team at Amazon. Our team wrote tools that helped the owners of AWS services such as Amazon Route 53 and Elastic Load Balancing build their services more quickly, and service clients call those services more easily. Other Amazon teams provided service owners with functionality such as metering, authentication, monitoring, client library generation, and documentation generation. Instead of each service team having to integrate those features into their services manually, the Service Frameworks team did that integration once and exposed the functionality to each service through configuration.
One challenge we faced was in determining how to provide sensible defaults, especially for features that were performance or availability related. For example, we couldn’t set a default client-side timeout easily, because our framework had no idea what the latency characteristics of an API call might be. This wouldn’t have been any easier for service owners or clients to figure out themselves, so we kept trying, and gained some useful insights along the way.
One common question we struggled with was determining the default number of connections the server would allow to be open to clients at the same time. This setting was designed to prevent a server from taking on too much work and becoming overloaded. More specifically, we wanted to configure the maximum connections settings for the server in proportion to the maximum connections for the load balancer. This was before the days of Elastic Load Balancing, so hardware load balancers were in widespread use.
We set out to help Amazon service owners and service clients figure out the ideal value for maximum connections to set on the load balancer, and the corresponding value to set in the frameworks we provided. We decided that if we could figure out how to use human judgment to make a choice, we could then write software to emulate that judgment.
Determining the ideal value ended up being very challenging. When maximum connections were set too low, the load balancer might cut off increases in the number of requests, even when the service had plenty of capacity. When maximum connections were set too high, servers would become slow and unresponsive. When maximum connections were set just right for a workload, the workload would shift or dependency performance would change. Then the values would be wrong again, resulting in unnecessary outages or overloads.
In the end, we found that the maximum connections concept was too imprecise to provide the complete answer to the puzzle. In this article, we’ll describe other approaches such as load shedding that we found worked well.
The anatomy of overload
At Amazon we avoid overload by designing our systems to scale proactively, before they encounter overload situations. However, protecting systems involves protection in layers. This begins with automatic scaling, but also includes mechanisms to shed excess load gracefully, the ability to monitor those mechanisms, and most importantly, continuous testing.
When we load-test our services, we find that the latency of a server at low utilization is lower than its latency at high utilization. Under heavy load, thread contention, context switching, garbage collection, and I/O contention become more pronounced. Eventually, services reach an inflection point where their performance starts degrading even more rapidly.
The theory behind this observation is known as the Universal Scalability Law, which is a derivation of Amdahl’s law. This theory specifies that while a system’s throughput can be increased by using parallelization, it is ultimately limited by the throughput of the points of serialization (that is, by the tasks that can’t be parallelized).
Unfortunately, not only is throughput bounded by a system’s resources, throughput typically degrades when the system is overloaded. When a system is given more work than its resources support, it becomes slow. Computers take on work even when they’re overloaded, but they spend increasing amounts of their time context switching and become too slow to be useful.
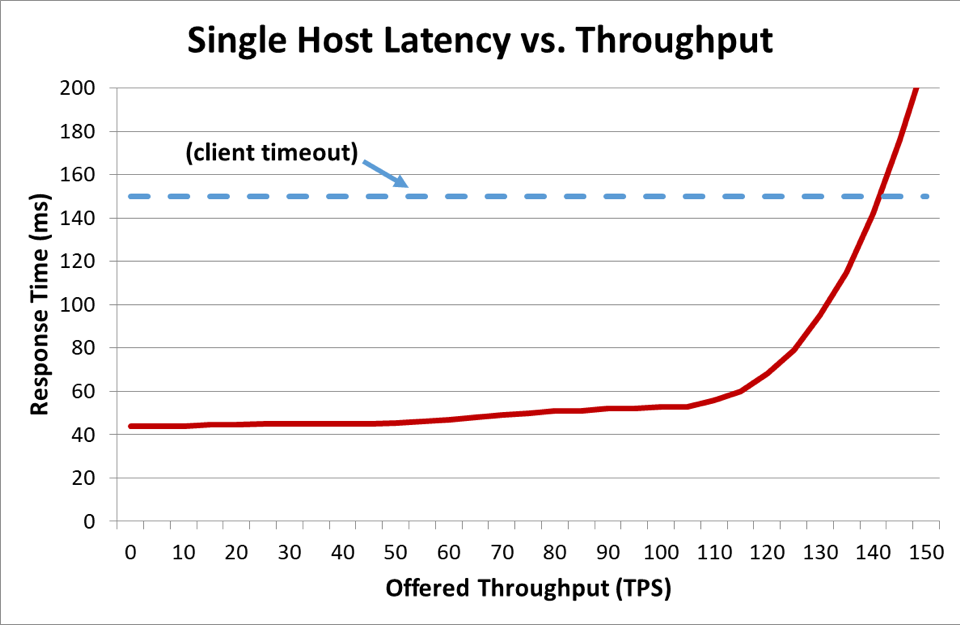
In a distributed system where a client is talking to a server, the client typically becomes impatient and stops waiting for the server to respond after some time. This duration is known as a timeout. When a server gets so overloaded that its latency exceeds its client’s timeout, requests start to fail. The following graph shows how server response time increases as offered throughput (in transactions per second) increases, and response time eventually reaches an inflection point where things deteriorate quickly.
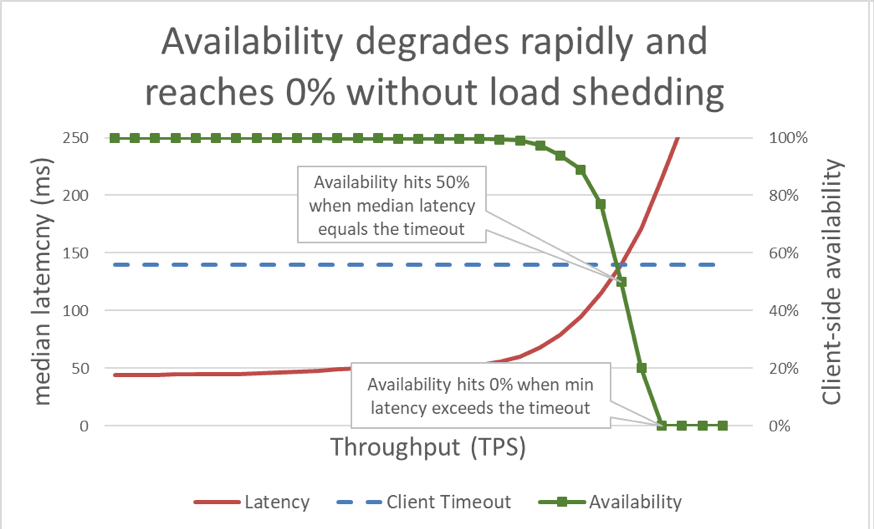
In the previous graph, when the response time exceeds the client timeout, it’s clear that things are bad, but the graph doesn’t show just how bad. To illustrate this, we can plot the client-perceived availability alongside latency. Instead of using a generic response time measurement, we can switch to using the median response time. Median response time means that 50 percent of requests were faster than the median value. If the service's median latency is equal to the client timeout, half of the requests are timing out, so the availability is 50 percent. This is where a latency increase transforms a latency problem into an availability problem. Here is a graph of that happening:
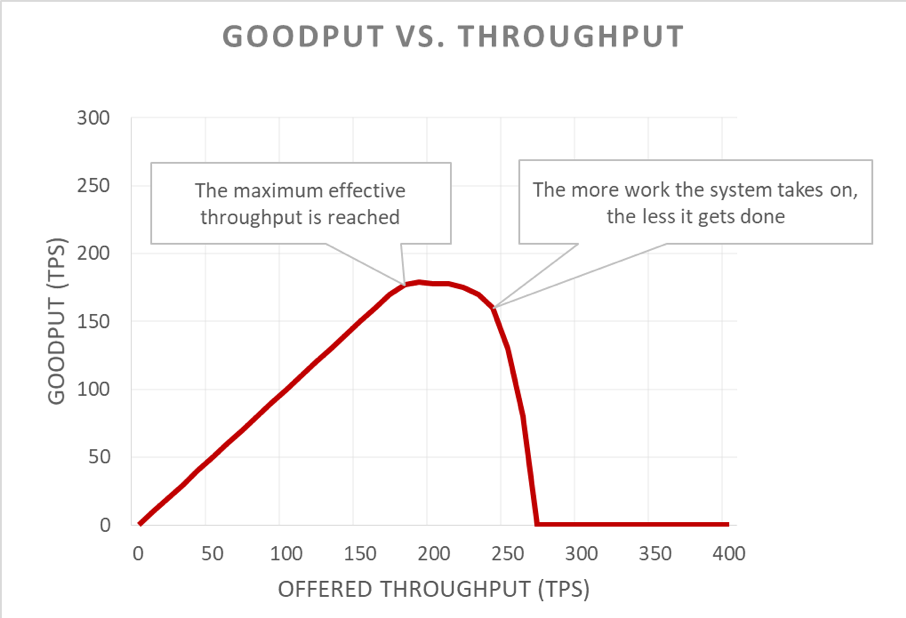
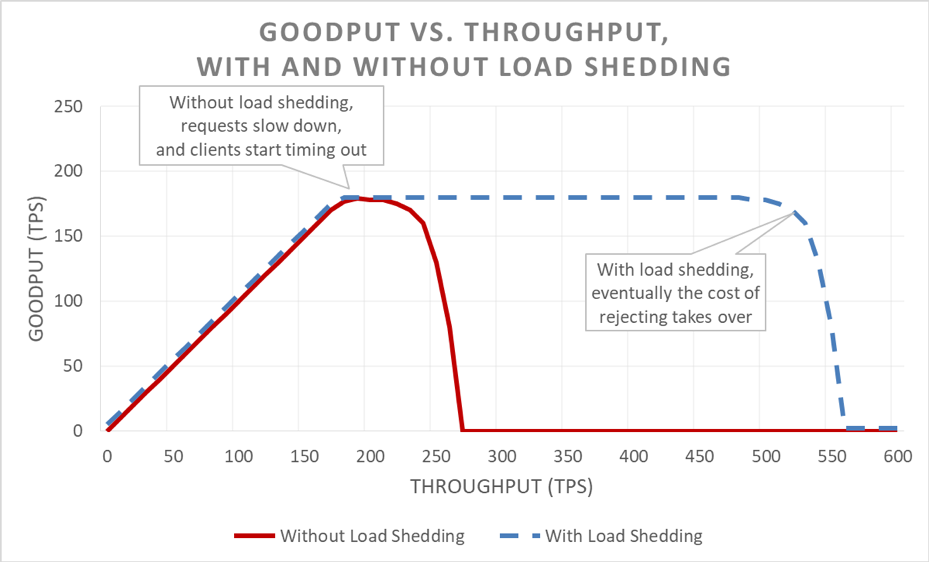
Unfortunately, this graph is tricky to read. A simpler way to describe the availability problem is to distinguish goodput from throughput. Throughput is the total number of requests per second that is being sent to the server. Goodput is the subset of the throughput that is handled without errors and with low enough latency for the client to make use of the response.
Positive feedback loops
The insidious part of an overload situation is how it amplifies itself in a feedback loop. When a client times out, it’s bad enough that the client got an error. What’s even worse is that all the progress that the server made so far on that request goes to waste. And the last thing a system should do in an overload situation, where capacity is constrained, is waste work.
Making matters even worse is that clients often retry their request. This multiplies the offered load on the system. And if there’s a deep enough call graph in a service-oriented architecture (that is, a client calls a service, which calls other services, which call other services), and if each layer performs a number of retries, an overload in the bottom layer causes cascading retries that amplify the offered load exponentially.
When these factors are combined, an overload creates its own feedback loop that results in overload as a steady state.
Preventing work from going to waste
On the surface, load shedding is simple. When a server approaches overload, it should start rejecting excess requests so that it can focus on the requests it decides to let in. The goal of load shedding is to keep latency low for the requests that the server decides to accept so that the service replies before the client times out. With this approach, the server maintains high availability for the requests it accepts, and only the excess traffic’s availability is affected.
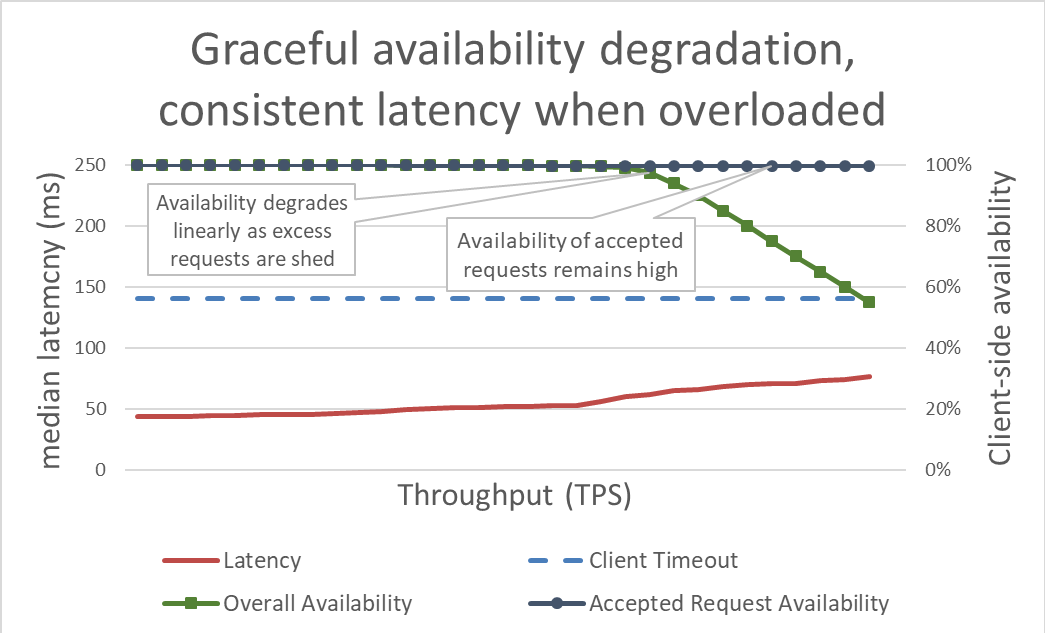
Keeping latency in check by shedding excess load makes the system more available. But the benefits of this approach are hard to visualize in the previous graph. The overall availability line still drifts downward, which looks bad. The key is that the requests that the server decided to accept remain available because they were served quickly.
Load shedding lets a server maintain its goodput and complete as many requests as it can, even as offered throughput increases. However, the act of shedding load isn’t free, so eventually the server falls prey to Amdahl’s law and goodput drops.
Testing
When I talk to other engineers about load shedding, I like to point out that if they haven’t load tested their service to the point where it breaks, and far beyond the point where it breaks, they should assume that the service will fail in the least desirable way possible. At Amazon we spend a great deal of time load testing our services. Generating graphs like the ones earlier in this article helps us baseline overload performance and track how we do over time as we make changes to our services.
There are multiple types of load tests. Some load tests ensure that a fleet automatically scales as load increases whereas others use a fixed fleet size. If, in an overload test, a service’s availability degrades rapidly to zero as throughput increases, that’s a good sign that the service is in need of additional load shedding mechanisms. The ideal load test result is for goodput to plateau when the service is close to being fully utilized, and to remain flat even when more throughput is applied.
Tools like Chaos Monkey help perform chaos engineering tests on services. For example, they can overburden the CPU or introduce packet loss to simulate conditions that happen during an overload. Another testing technique we use is to take an existing load generation test or canary, drive sustained load (instead of increasing load) toward a test environment, but begin removing servers from that test environment. This increases the offered throughput per instance, so it can test instance throughput. This technique of artificially increasing load by decreasing fleet sizes is useful for testing a service in isolation, but it isn’t a complete substitute for full load tests. A full, end-to-end load test will also increase load to that service’s dependencies, which could uncover other bottlenecks.
During tests, we make sure to measure client-perceived availability and latency in addition to server-side availability and latency. When client-side availability begins to decrease, we push the load far beyond that point. If load shedding is working, goodput will remain steady even as offered throughput increases well beyond the scaled capabilities of the service.
Overload testing is crucial before exploring mechanisms to avoid overload. Each mechanism introduces complexity. For example, consider all the configuration options in the service frameworks I mentioned at the beginning of the article, and how difficult defaults were to get right. Each mechanism for avoiding overload adds different protections and has limited effectiveness. Through testing, a team can detect their system’s bottlenecks and determine the combination of protections they need to handle overload.
Visibility
At Amazon, regardless of which techniques we use to protect our services from overload, we think carefully about the metrics and visibility we need when these overload countermeasures take effect.
When brownout protection rejects a request, that rejection reduces the availability of a service. When the service gets it wrong and rejects a request although it has capacity (for example, when the maximum number of connections is set too low), it generates a false positive. We strive to keep a service’s false positive rate at zero. If a team finds that their service’s false positive rate is non-zero on a regular basis, the service is either tuned too sensitively, or individual hosts are being constantly and legitimately overloaded, and there may be a scaling or load balancing problem. In cases like this, we might have some application performance tuning to do, or we may switch to larger instance types that they can handle load imbalances more gracefully.
In terms of visibility, when load shedding rejects requests, we make sure that we have proper instrumentation to know who the client was, which operation they were calling, and any other information that will help us tune our protection measures. We also use alarms to detect whether the countermeasures are rejecting any significant volume of traffic. When there is a brownout, our priority is to add capacity and to address the current bottleneck.
There’s another subtle but important consideration around visibility in load shedding. We’ve found that it’s important not to pollute our services’ latency metrics with failed request latency. After all, the latency of load shedding a request should be extremely low compared with other requests. For example, if a service is load shedding 60 percent of its traffic, the service's median latency might look pretty amazing even if its successful request latency is terrible, because it’s being under-reported as a result of fast-failing requests.
Load shedding effects on automatic scaling and Availability Zone failure
If misconfigured, load shedding can disable reactive automatic scaling. Consider the following example: a service is configured for CPU-based reactive scaling and also has load shedding configured to reject requests at a similar CPU target. In this case, the load shedding system will reduce the number of requests to keep the CPU load low, and reactive scaling will never receive or get a delayed signal to launch new instances.
We are also careful to consider load shedding logic when we set automatic scaling limits for handling Availability Zone failures. Services are scaled to a point where an Availability Zone's worth of their capacity can become unavailable while preserving our latency goals. Amazon teams often look at system metrics like CPU to approximate how close a service is to reaching its capacity limit. However, with load shedding, a fleet might run much closer to the point at which requests would be rejected than system metrics indicate, and might not have the excess capacity provisioned to handle an Availability Zone failure. With load shedding, we need to be extra sure to test our services to breakage to understand our fleet's capacity and headroom at any point in time.
In fact, we can use load shedding to save costs by shaping off-peak, non-critical traffic. For example, if a fleet handles website traffic for amazon.com, it might decide that search crawler traffic is not worth the expense of being scaled for full Availability Zone redundancy. However, we are very careful with this approach. Not all requests cost the same, and proving that a service should provide Availability Zone redundancy for human traffic and for shedding excess crawler traffic at the same time requires careful design, continuous testing, and buy-in from the business. And if a service’s clients don't know that a service is configured this way, its behavior during an Availability Zone failure might look like a massive critical availability drop instead of non-critical load shedding. For this reason, in a service-oriented architecture, we try to push this kind of shaping as early as possible (such as in the service that receives the initial request from the client) instead of trying to make global prioritization decisions throughout the stack.
Load shedding mechanisms
When discussing load shedding and unpredictable scenarios, it’s also important to focus on the many predictable conditions that lead to brownout. At Amazon, services maintain enough excess capacity to handle Availability Zone failures without having to add more capacity. They use throttling to ensure fairness among clients.
However, despite these protections and operational practices, a service has a certain amount of capacity at any point in time, and can therefore become overloaded for a variety of reasons. These reasons include unexpected surges in traffic, sudden loss of fleet capacity (from bad deployments or otherwise), clients shifting from making cheap requests (like cached reads) to expensive requests (like cache misses or writes). When a service becomes overloaded, it has to finish the requests that it has taken on; that is, services have to protect themselves from brownout. In the rest of this section, we’ll discuss some of the considerations and techniques we’ve used over the years to manage overload.
Understanding the cost of dropping requests
We make sure to load test our services far beyond the point where goodput plateaus. One of the key reasons for this approach is to ensure that when we drop requests during load shedding, the cost of dropping the request is as small as possible. We’ve seen that it’s easy to miss an accidental log statement or a socket setting, which might make dropping a request far more expensive than it needs to be.
In rare cases, quickly dropping a request can be more expensive than holding on to the request. In these cases, we slow down rejected requests to match (at the minimum) the latency of successful responses. However, it’s important to do this when the cost of holding on to requests is as low as possible; for example, when they’re not tying up an application thread.
Prioritizing requests
When a server is overloaded, it has an opportunity to triage incoming requests to decide which ones to accept and which ones to turn away. The most important request that a server will receive is a ping request from a load balancer. If the server doesn't respond to ping requests in time, the load balancer will stop sending new requests to that server for a period of time, and the server will sit idle. And in a brownout scenario, the last thing we want to do is to reduce the size of our fleets. Beyond ping requests, request prioritization options vary from service to service.
Consider a web service that provides data to render amazon.com. A service call that supports web page rendering for a search index crawler is likely to be less critical to serve than a request that originates from a human. Crawler requests are important to serve, but ideally they can be shifted to an off-peak time. However, in a complex environment like amazon.com where a large number of services cooperate, if services use conflicting prioritization heuristics, systemwide availability could be affected and work could be wasted.
Prioritization and throttling can be used together to avoid strict throttling ceilings while still protecting a service from overload. At Amazon, in cases where we allow clients to burst above their configured throttle limits, the excess requests from these clients might be prioritized lower than within-quota requests from other clients. We spend a lot of time focusing on placement algorithms to minimize the probability of burst capacity becoming unavailable, but given the tradeoffs, we favor the predictable provisioned workload over the unpredictable workload.
Keeping an eye on the clock
If a service has gotten partway through serving a request and notices that the client has timed out, it can skip doing the rest of the work and fail the request at that point. Otherwise, the server keeps working on the request, and its late reply is like a tree falling in the forest. From the server’s perspective, it has returned a successful response. But from the perspective of the client that timed out, it was an error.
One way to avoid this wasted work is for clients to include timeout hints in each request, which tell the server how long they’re willing to wait. The server can evaluate these hints and drop doomed requests at little cost.
This timeout hint can be expressed either as an absolute time or as a duration. Unfortunately, servers in distributed systems are notoriously bad at agreeing what the exact current time is. The Amazon Time Sync Service compensates by synchronizing your Amazon Elastic Compute Cloud (Amazon EC2) instances’ clocks with a fleet of redundant satellite-controlled and atomic clocks in each AWS Region. Well-synchronized clocks are important at Amazon for logging purposes as well. Comparing two log files on servers that have out-of-sync clocks makes troubleshooting even harder than it is to begin with.
The other way to “watch the clock” is to measure a duration on a single machine. Servers are good at measuring elapsed durations locally because they do not need to gain consensus with other servers. Unfortunately, expressing timeouts in terms of durations has its problems, too. For one, the timer you use must be monotonic and not go backward when the server syncs with the Network Time Protocol (NTP). A far more difficult problem is that in order to measure a duration, the server has to know when to start a stopwatch. In some extreme overload scenarios, huge volumes of requests can queue up in Transmission Control Protocol (TCP) buffers, so by the time the server reads the requests from its buffers, the client has already timed out.
Whenever systems at Amazon express client timeout hints, we try to apply them transitively. In places where a service-oriented architecture includes multiple hops, we propagate the “remaining time” deadline between each hop so that a downstream service at the end of a call chain can be aware of how much time it has for its response to be useful.
Once a server knows the client deadline, there’s the question of where to enforce the deadline in the service implementation. If a service has a request queue, we use that opportunity to evaluate the timeout after dequeueing each request. But this is still pretty complicated, because we don’t know how long the request is likely to take. Some systems keep an estimate of how long API requests are taking, and they drop requests early if the client-reported deadline exceeds a latency estimate. However, things are rarely that simple. For example, cache hits are faster than cache misses, and the estimator doesn’t know whether it's a hit or a miss up front. Or the service’s backend resources might be partitioned, and only some partitions might be slow. There's a great deal of opportunity for cleverness, but it's also possible for that cleverness to backfire in an unpredictable situation.
In our experience, enforcing client timeouts on the server is still better than the alternative, despite the complexities and tradeoffs. Instead of requests piling up and the server possibly working on requests that no longer matter to anyone, we have found it helpful to enforce a “per-request time-to-live” and throw away doomed requests.
Finishing what was started
We don't want any useful work to go to waste, especially in an overload. Throwing away work creates a positive feedback loop that increases the overload, since clients often retry a request if a service doesn't respond in time. When that happens, one resource-consuming request turns into many resource-consuming requests, multiplying the load on the service. When clients time out and retry, they often stop waiting for a reply on their first connection while they’re making a new request on a separate connection. If the server finishes the first request and replies, the client might not be listening, because it's now waiting for a reply from its retried request.
This wasted work problem is why we try to design services to perform bounded work. In places where we expose an API that can return a large dataset (or really any list at all), we expose it as an API that supports pagination. These APIs return partial results and a token that the client can use to request more data. We have found it easier to estimate the additional load on a service when the server handles a request that has an upper bound to the amount of memory, CPU, and network bandwidth. It’s very difficult to perform admission control when a server has no idea what it will take to process a request.
A more subtle opportunity to prioritize requests is around how clients use a service’s APIs. For example, let's say a service has two APIs: start() and end(). In order to finish their work, clients need to be able to call both APIs. In this case, the service should prioritize end() requests over start() requests. If it prioritized start(), clients wouldn’t be able to complete the work they started, resulting in brownouts.
Pagination is another place to watch for wasted work. If a client has to make several sequential requests to paginate through the results from a service, and it sees a failure after page N-1 and throws away the results, it’s wasting N-2 service calls and any retries it performed along the way. This suggests that like end() requests, first-page requests should be prioritized behind subsequent-page pagination requests. It also underscores why we design services to perform bounded work and not paginate endlessly through a service that they call during a synchronous operation.
Watching out for queues
It’s also helpful to look at request duration when managing internal queues. Many modern service architectures use in-memory queues to connect thread pools to process requests during various stages of work. A web service framework with an executor is likely to have a queue configured in front of it. With any TCP-based service, the operating system maintains a buffer for each socket, and those buffers can contain a huge volume of pent-up requests.
When we pull work off queues, we use that opportunity to examine how long the work was sitting on the queue. At a minimum, we try to record that duration in our service metrics. In addition to bounding the size of queues, we’ve found it’s extremely important to place an upper bound on the amount of time that an incoming request sits on a queue, and we throw it out if it's too old. This frees up the server to work on newer requests that have a greater chance of succeeding. As an extreme version of this approach, we look for ways to use a last in, first out (LIFO) queue instead, if the protocol supports it. (HTTP/1.1 pipelining of requests on a given TCP connection doesn’t support LIFO queues, but HTTP/2 generally does.)
Load balancers might also queue incoming requests or connections when services are overloaded, using a feature called surge queues. These queues can lead to brownout, because when a server finally gets a request, it has no idea how long the request was in the queue. A generally safe default is to use a spillover configuration, which fast-fails instead of queueing excess requests. At Amazon, this learning was baked into the next generation of the Elastic Load Balancing (ELB) service. The Classic Load Balancer used a surge queue, but the Application Load Balancer rejects excess traffic. Regardless of configuration, teams at Amazon monitor the relevant load balancer metrics, like surge queue depth or spillover count, for their services.
In our experience, the importance of watching out for queues can’t be overstated. I’m often surprised to find in-memory queues where I didn’t intuitively think to look for them, in systems and libraries I depend on. When I’m digging into systems, I find that it’s helpful to assume there are queues somewhere that I don’t know about yet. Of course, overload testing provides more useful information than digging into code, as long as I can come up with the right realistic test cases.
Protecting against overload in lower layers
Services are made up of several layers─from load balancers, to operating systems with netfilter and iptables capabilities, to service frameworks, to the code—and each layer provides some capability to protect the service.
HTTP proxies like NGINX often support a maximum connections feature (max_conns) to limit the number of active requests or connections it will pass to the backend server. This can be a helpful mechanism, but we learned to use it as a last resort instead of the default protection option. With proxies, it’s difficult to prioritize important traffic, and raw in-flight request count tracking sometimes provides inaccurate information about whether a service is actually overloaded.
In the beginning of this article, I described a challenge from my time on the Service Frameworks team. We were trying to provide Amazon teams with a recommended default for maximum connections to configure on their load balancers. In the end, we suggested that teams set maximum connections for their load balancer and proxy high, and let the server implement more accurate load shedding algorithms with local information. However, it was also important for the maximum connections value to not exceed the number of listener threads, listener processes, or file descriptors on a server, so the server had the resources to handle critical health check requests from the load balancer.
Operating system features for limiting server resource usage are powerful and can be helpful to use in emergencies. And because we know that overload can happen, we make sure to prepare for it by using the right runbooks with specific commands at the ready. The iptables utility can put an upper bound on the number of connections that the server will accept, and can reject excess connections far more cheaply than any server process. It can also be configured with more sophisticated controls, like allowing new connections at a bounded rate, or even allowing a limited connection rate or count per source IP address. Source IP filters are powerful, but do not apply with traditional load balancers. However, an ELB Network Load Balancer preserves the source IP of the caller even at the operating system layer through network virtualization, making iptables rules like source IP filters work as expected.
Protecting in layers
In some cases, a server runs out of resources to even reject requests without slowing down. With this reality in mind, we look at all the hops between a server and its clients to see how they can cooperate and help shed excess load. For example, several AWS services include load shedding options by default. When we front a service with Amazon API Gateway, we can configure a maximum request rate that any API will accept. When our services are fronted by API Gateway, an Application Load Balancer, or Amazon CloudFront, we can configure AWS WAF to shed excess traffic on a number of dimensions.
Visibility creates a difficult tension. Early rejection is important because it’s the cheapest place to drop excess traffic, but it comes at a cost to visibility. This is why we protect in layers: to let a server take on more than it can work on and drop the excess, and log enough information to know what traffic it is dropping. Since there is only so much traffic a server can drop, we rely on the layer in front of it to protect it from extreme volumes of traffic.
Thinking about overload differently
In this article, we discussed how the need to shed load arises out of the fact that systems become slower as they are given more concurrent work, as forces like resource limits and contention kick in. The overload feedback loop is driven by latency, which ultimately causes wasted work, request rate amplification, and even more overload. This force, driven by the Universal Scalability Law and Amdahl’s law, is important to sidestep by shedding excess load and maintaining predictable, consistent performance in the face of overload. Focusing on predictable, consistent performance is a key design principle on which services at Amazon are built.
For example, Amazon DynamoDB is a database service that offers predictable performance and availability at scale. Even if a workload bursts quickly and exceeds the provisioned resources, DynamoDB maintains predictable goodput latency for that workload. Factors like DynamoDB auto scaling, adaptive capacity, and on-demand react quickly to increase goodput rates to adapt to an increase in a workload. During that time, goodput remains steady, keeping a service in the layers above DynamoDB with predictable performance as well, and improving the stability of the whole system.
AWS Lambda provides an even broader example of the focus on predictable performance. When we use Lambda to implement a service, each API call runs in its own execution environment with consistent amounts of compute resources allocated to it, and that execution environment works on only that one request at a time. This differs from a server-based paradigm, where a given server works on multiple APIs.
Isolating each API call to its own independent resources (compute, memory, disk, network) will circumvent Amdahl’s law in some ways, because the resources of one API call won’t be contending with the resources of another API call. Therefore, if throughput exceeds goodput, goodput will remain flat instead of dropping down as it does in a more traditional server-based environment. This isn’t a panacea, since dependencies can slow down and cause concurrency to go up. However, in this scenario, at least the types of on-host resource contention that we discussed in this article won’t apply.
This resource isolation is a somewhat subtle but important benefit of modern, serverless compute environments like AWS Fargate, Amazon Elastic Container Service (Amazon ECS), and AWS Lambda. At Amazon, we have found that it requires a lot of work to implement load shedding, from tuning thread pools, to picking the perfect configuration for maximum load balancer connections. Sensible defaults for these types of configurations are difficult or impossible to find, because they depend on the unique operational characteristics of each system. These newer, serverless compute environments provide lower-level resource isolation and expose higher-level knobs, like throttling and concurrency controls, for protecting against overload. In some ways, instead of chasing the perfect default configuration value, we’re able to sidestep that configuration altogether and protect from categories of overload without any configuration at all.
Further reading
- Universal Scalability Law
- Amdahl's law
- Staged event-driven architecture (SEDA)
- Little's law (describes concurrency in a system and how to determine the capacity of distributed systems)
- Telling Stories About Little’s Law, Marc’s Blog
- Elastic Load Balancing Deep Dive and Best Practices, presentation at re:Invent 2016 (describes the evolution of Elastic Load Balancing to stop queueing excess requests)
- Burgess, Thinking in Promises: Designing Systems for Cooperation, O’Reilly Media, 2015
About the author
David Yanacek is a Senior Principal Engineer working on AWS Lambda. David has been a software developer at Amazon since 2006, previously working on Amazon DynamoDB and AWS IoT, and also internal web service frameworks and fleet operations automation systems. One of David’s favorite activities at work is performing log analysis and sifting through operational metrics to find ways to make systems run more and more smoothly over time.

Did you find what you were looking for today?
Let us know so we can improve the quality of the content on our pages