背景
本文延续 Redis Cluster 代理集群需求场景,在上篇中主要介绍了使用 RedisLabs 开源版本 Redis Cluster Proxy 搭建代理集群方案的过程,RedisLabs 官方文档明确表明此项目处于 alpha 版本,用于生产环境需要详细的技术评估。本篇会详细介绍另外一个 Golang 的 Redis Proxy 开源项目 Overlord,这个项目来自国内互联网公司B站,官方文档明确介绍这个项目是经过B站生产环境实际验证,以下会详细介绍如何在AWS环境中构建这套 Redis Cluster 代理集群。
Overlord 简介
Overlord 是哔哩哔哩基于Go语言编写的 Memcached 和 Redis & Cluster 的代理及集群管理功能,致力于提供自动化高可用的缓存服务解决方案。主要包括以下组件:
- proxy:轻量高可用的缓存代理模块,支持 Memcached 和 Redis 的代理,相当于 Twemproxy,不同在于支持Redis Cluster 及能将自己伪装为cluster模式。
- platform:包含 apiserver、mesos framework&executor、集群节点任务管理job等。
- GUI:web管理界面,通过dashboard可视化方便用于集群管理,包括创建删除、扩缩容、加减节点等。
- anzi:redis-cluster的数据同步工具,可服务化与apiserver进行配合工作。
- enri:redis-cluster的集群管理工具,可灵活的创建集群、迁移slot等。
- Overlord 已被哔哩哔哩用于生产环境。
Overlord Proxy 集群搭建
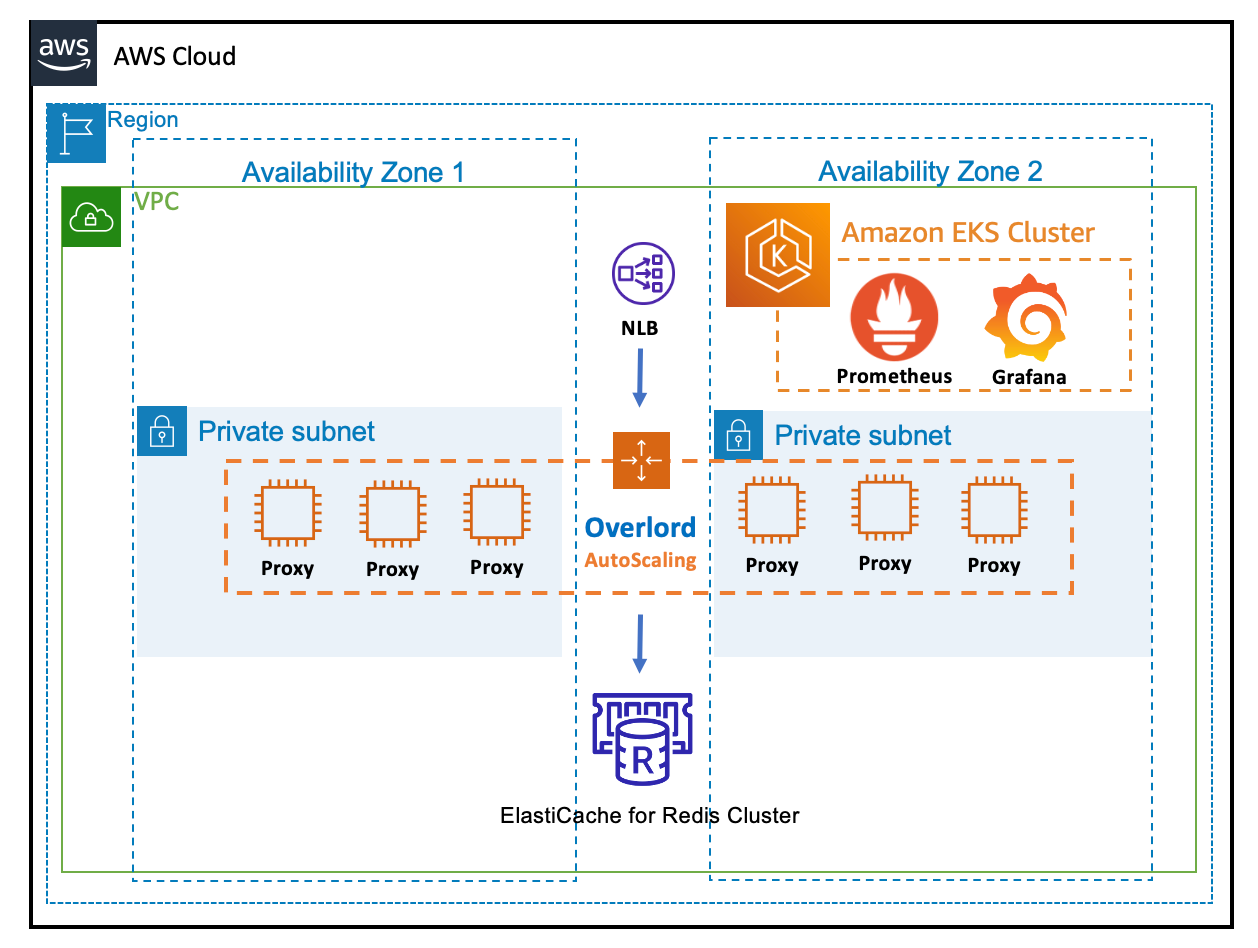
架构图
创建 EC2 服务器
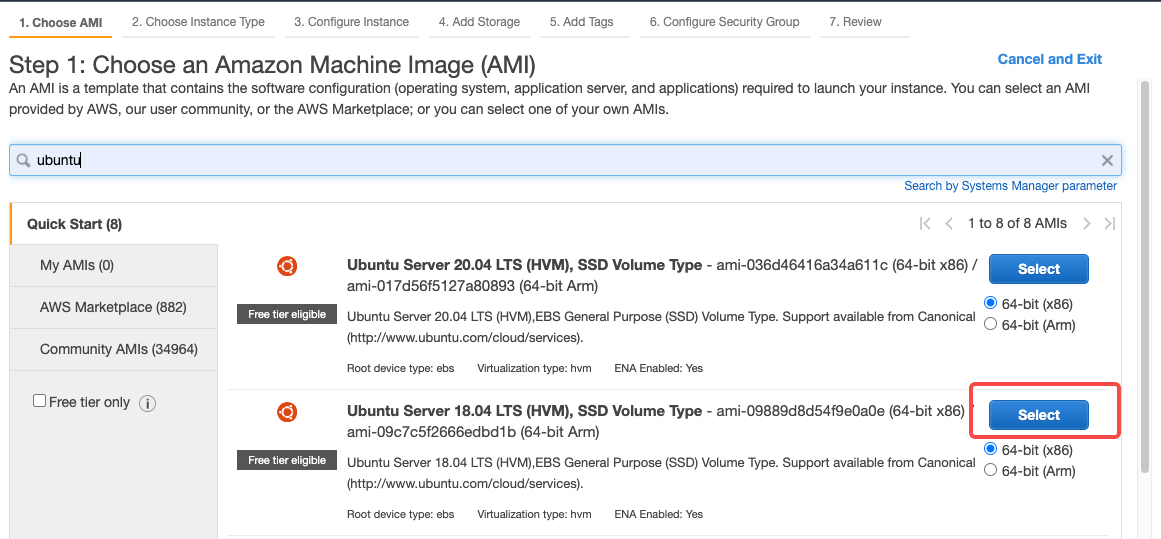
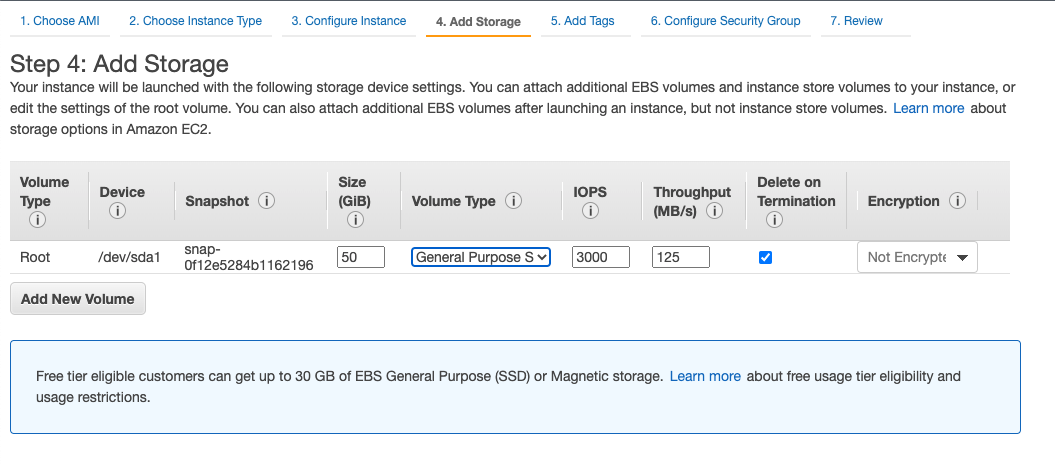
基于 Ubuntu 18.04 LTS 系统构建 Overlord Proxy 服务预置镜像。

- 选择合适的存储大小,需要注意预留足够空间保存日志文件
安装 Overlord Proxy
# 切换到root用户
~ sudo su

# 修改open file和max user process
~ vim /etc/security/limits.conf
root soft nproc 65000
root hard nproc 65000
root soft nofile 65000
root hard nofile 65000

# 安装 golang 最新的 SDK
~ add-apt-repository ppa:longsleep/golang-backports
~ apt-get update
~ apt-get install golang # 1.17.1
~ cd ~ && mkdir -p go/src/bilibili/ && cd /root/go/src/bilibili/
~ git clone  https://github.com/bilibili/overlord.git

# 需要 checkout 最新指定版本
~ cd overlord && git checkout v1.9.4 && git status
~ cd cmd/proxy/
~ go mod download bou.ke/monkey
~ go get overlord/proxy
~ go build

# 创建统一部署目录 /opt/systemd_sh,部署编译后的 proxy 执行文件
mkdir /opt/systemd_sh/
cp proxy /opt/systemd_sh/proxy
创建 Overlord Proxy 配置文件
Overlord Proxy 需要两个配置文件,分别是 Proxy 和 Cluster 两个配置。
# Overlord 的 Proxy 相关配置
~ vim /opt/systemd_sh/conf_proxy.toml
pprof = "0.0.0.0:2110"
# 服务状态监听端口,默认Prometheus监听端口
stat = "0.0.0.0:8080"
stdout = true
debug = true
log = "/opt/systemd_sh/overlord.log"
log_lv = 0

[proxy]
# The read timeout value in msec that we wait for to receive a response from the client. By default, we wait indefinitely.
read_timeout = 0
# The write timeout value in msec that we wait for to write a response to the client. By default, we wait indefinitely.
write_timeout = 0
# proxy accept max connections from client. By default, we no limit.
max_connections = 0
# proxy support prometheus metrics. By default, we use it.
use_metrics = true

# Overlord 的 Cluster 相关配置
~ vim /opt/systemd_sh/conf_cluster.toml
[[clusters]]
# This be used to specify the name of cache cluster.
name = "test-redis-cluster"
# The name of the hash function. Possible values are: sha1.
hash_method = "fnv1a_64"
# The key distribution mode. Possible values are: ketama.
hash_distribution = "ketama"
# A two character string that specifies the part of the key used for hashing. Eg "{}".
hash_tag = "{}"
# cache type: memcache | memcache_binary | redis | redis_cluster
cache_type = "redis_cluster"
# proxy listen proto: tcp | unix
listen_proto = "tcp"
# proxy listen addr: tcp addr | unix sock path
listen_addr = "0.0.0.0:6379"
# Authenticate to the Redis server on connect.
redis_auth = ""
# The dial timeout value in msec that we wait for to establish a connection to the server. By default, we wait indefinitely.
dial_timeout = 1000
# The read timeout value in msec that we wait for to receive a response from a server. By default, we wait indefinitely.
read_timeout = 1000
# The write timeout value in msec that we wait for to write a response to a server. By default, we wait indefinitely.
write_timeout = 1000
# The number of connections that can be opened to each server. By default, we open at most 1 server connection.
node_connections = 2
# The number of consecutive failures on a server that would lead to it being temporarily ejected when auto_eject is set to true. Defaults to 3.
ping_fail_limit = 3
# A boolean value that controls if server should be ejected temporarily when it fails consecutively ping_fail_limit times.
ping_auto_eject = false

slowlog_slower_than = 10
# A list of server address, port (name:port or ip:port) for this server pool when cache type is redis_cluster.
servers = [
    # Redis Cluster 的 Configuration Endpoint
    "test-redis-cluster.w3cdfd.clustercfg.usw2.cache.amazonaws.com:6379"
]
启动 Overlord Proxy 和 测试
# 启动命令
~ /opt/systemd_sh/proxy -cluster /opt/systemd_sh/conf_cluster.toml -conf /opt/systemd_sh/conf_proxy.toml
# 测试服务可用
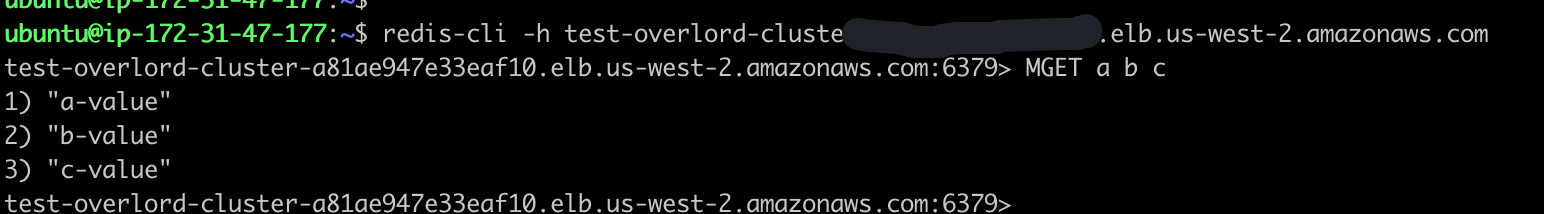
~ redis-cli -h localhost
localhost:6379> MSET a a-value b b-value c c-value
OK
localhost:6379> MGET a b c
1) "a-value"
2) "b-value"
3) "c-value"
配置 systemctl 管理 Overlord Proxy 服务
# 创建启动脚本
~ cd /opt/systemd_sh/
~ vim overlord_proxy_start.sh
#!/bin/bash
/opt/systemd_sh/overlord_proxy_stop.sh
/opt/systemd_sh/proxy -cluster /opt/systemd_sh/conf_cluster.toml -conf /opt/systemd_sh/conf_proxy.toml

~ chmod +x overlord_proxy_start.sh

# systemctl 配置文件
~ vim /lib/systemd/system/overlord-proxy.service
[Unit]
Description=overlord-proxy service

[Service]
Type=simple
ExecStart=/opt/systemd_sh/overlord_proxy_start.sh
Restart=always
RestartSec=5
StartLimitInterval=30
PrivateTmp=true

[Install]
WantedBy=multi-user.target
Alias=overlord-proxy.service

# 添加到启动列表,启动服务
systemctl enable overlord-proxy
systemctl start overlord-proxy
安装 CloudWatch Agent 增强对内存的监控
# 下载 cloudwatch agent 安装包,本地安装
~ wget https://s3.amazonaws.com/amazoncloudwatch-agent/ubuntu/amd64/latest/amazon-cloudwatch-agent.deb
~ dpkg -i -E ./amazon-cloudwatch-agent.deb
~ cd /opt/aws/amazon-cloudwatch-agent/etc/

# 启动 cloudwatch agent 服务
~ /opt/aws/amazon-cloudwatch-agent/bin/amazon-cloudwatch-agent-ctl -a fetch-config -m ec2 -s
~ systemctl status amazon-cloudwatch-agent

注意安装后系统目录的文件结构

├── etc
│  ├── amazon-cloudwatch-agent.d
│  │  └── amazon-cloudwatch-agent.json
│  ├── amazon-cloudwatch-agent.toml
│  ├── common-config.toml
│  └── env-config.json

# 更新上报参数的json配置文件
~ vim amazon-cloudwatch-agent.d/amazon-cloudwatch-agent.json
{
    "agent": {
        "metrics_collection_interval": 30,
        "run_as_user": "cwagent"
    },
    "metrics": {
        "append_dimensions": {
            "AutoScalingGroupName": "${aws:AutoScalingGroupName}",
            "ImageId": "${aws:ImageId}",
            "InstanceId": "${aws:InstanceId}",
            "InstanceType": "${aws:InstanceType}"
        },
        "aggregation_dimensions" : [
                    ["AutoScalingGroupName"],
                    ["AutoScalingGroupName", "InstanceType"],
                    ["InstanceId"],
                    ["InstanceType"],
                    ["InstanceId","InstanceType"]
            ],
        "metrics_collected": {
            "cpu": {
                "measurement": [
                    "cpu_usage_idle",
                    "cpu_usage_iowait",
                    "cpu_usage_user",
                    "cpu_usage_system"
                ],
                "metrics_collection_interval": 30,
                "resources": [
                    "*"
                ],
                "totalcpu": true
            },
            "mem": {
                "measurement": [
                    "mem_used_percent",
                    "mem_used",
                    "mem_cached",
                    "mem_total"
                ],
                "metrics_collection_interval": 5,
                "resources": [
                    "*"
                ]
            },
            "netstat": {
                "measurement": [
                    "tcp_established",
                    "tcp_time_wait"
                ],
                "metrics_collection_interval": 30
            }
        }
    }
}

# 修改配置文件权限
~ chown cwagent:cwagent amazon-cloudwatch-agent.d/amazon-cloudwatch-agent.json
~ rm amazon-cloudwatch-agent.d/default

# 重启服务,确认新配置生效
sudo systemctl restart amazon-cloudwatch-agent
sudo systemctl status amazon-cloudwatch-agent
创建 Overlord Proxy 基础镜像
# 修改 overlord proxy 和 cloudwatch agent 服务的 systemctl 配置
~ systemctl stop overlord-proxy
~ systemctl disable overlord-proxy
~ systemctl stop amazon-cloudwatch-agent
~ systemctl disable amazon-cloudwatch-agent
# 修改 proxy.conf 文件,添加占位符,后续用 CloudFormation 模板进行自动替换
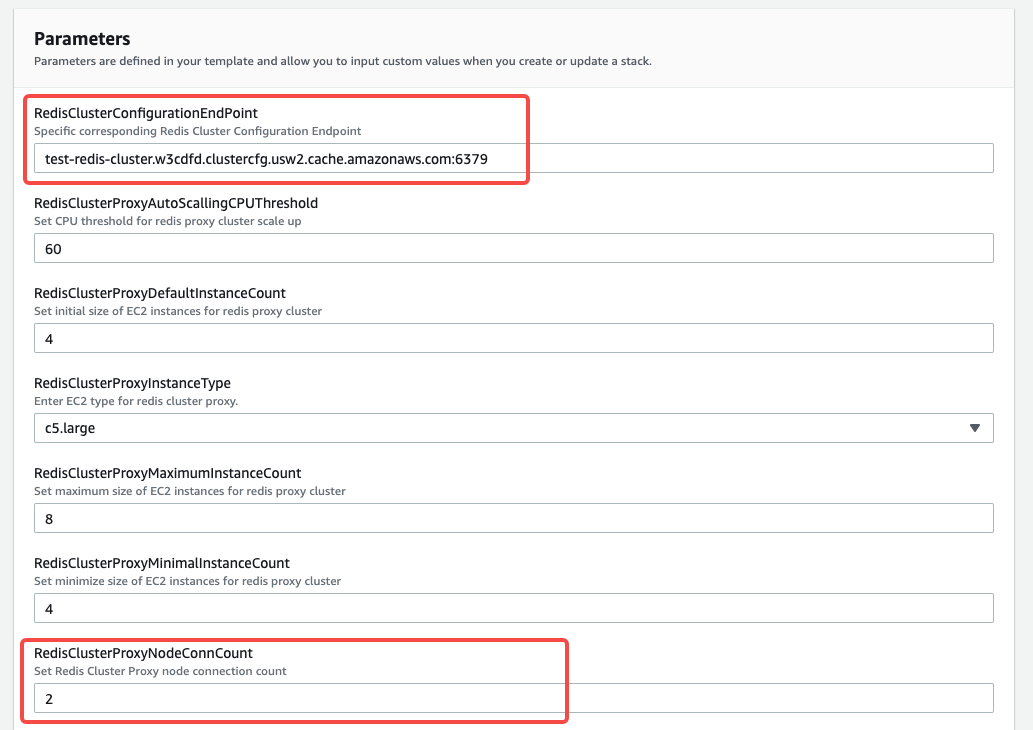
~ vim /opt/systemd_sh/conf_cluster.toml
node_connections = NODE-CONN-COUNT
servers = [
"REDIS-ENDPOINT"
]
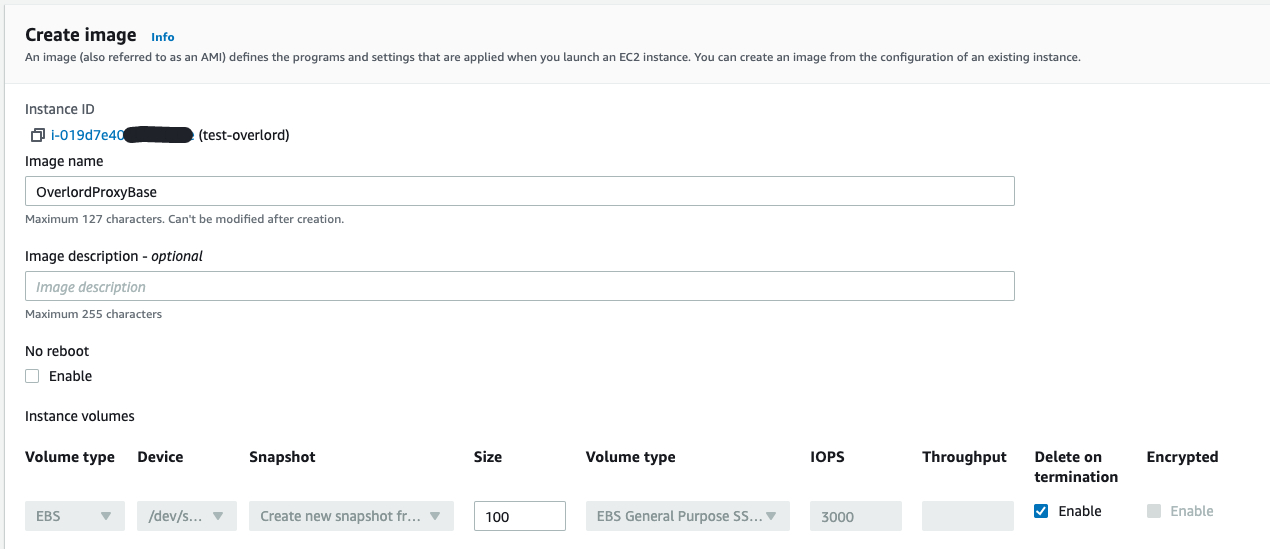
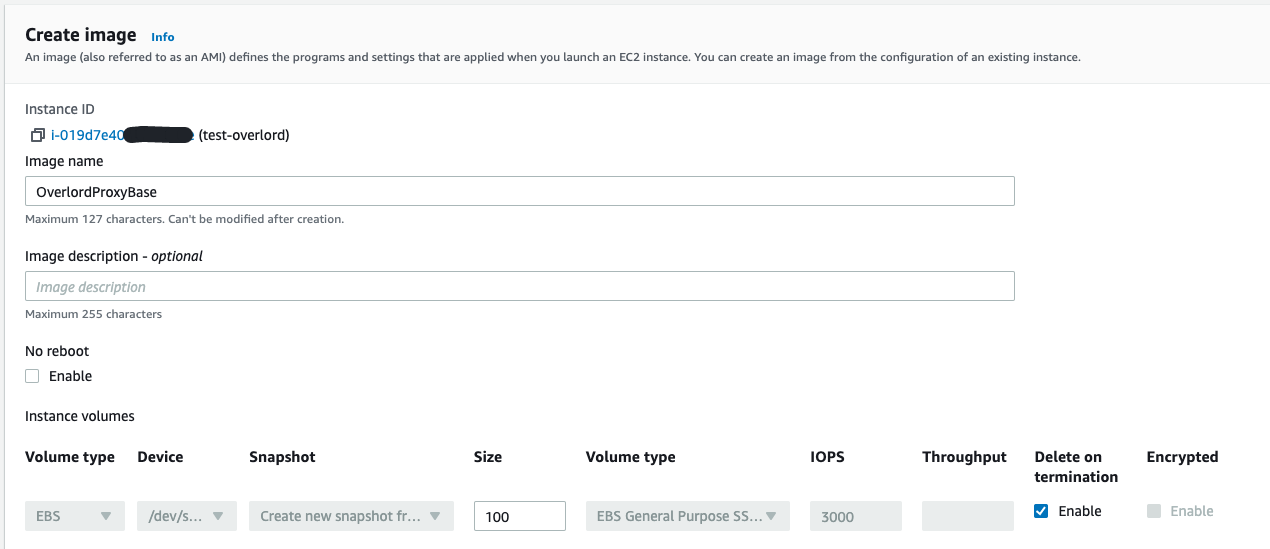
在控制台 EC2 界面,指定 overlord proxy 的服务器,创建基础镜像AMI
自动化部署 redis cluster overlord 代理集群
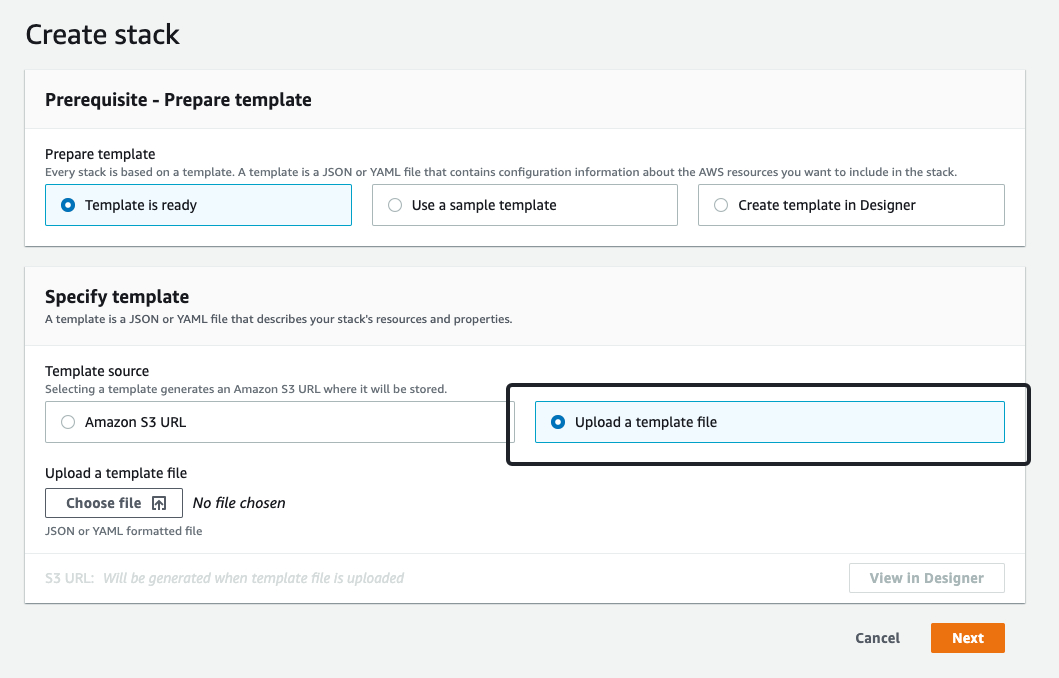
利用 CloudFormation 自动化部署 NLB + Overlord Proxy AutoScaling Group 架构。
- 准备 cloudwatch agent EC2 Role 权限
创建名为 CloudWatchAgentServerRole 的Role权限,具体策略 参考文档, EC2 可以有权限上报 metric。
~ vim overlord-cluster-cloudformation.yaml
AWSTemplateFormatVersion: 2010-09-09
Resources:
RedisProxyAutoScalingGroupConfiguration:
Type: 'AWS::AutoScaling::LaunchConfiguration'
Properties:
KeyName: !Ref RedisProxyKey
ImageId: ami-0eced476e4e29e6342 # 创建的 Overlord Proxy 基础镜像AMI ID
IamInstanceProfile: !Ref OverlordInstanceProfile
SecurityGroups:
- !Ref RedisProxySecurityGroup
InstanceType: !Ref RedisClusterProxyInstanceType
UserData:
Fn::Base64:
!Sub |
#!/bin/bash -xe
sed -i 's/REDIS-ENDPOINT/${RedisClusterConfigurationEndPoint}/g' /opt/systemd_sh/conf_cluster.toml
sed -i 's/NODE-CONN-COUNT/${RedisClusterProxyNodeConnCount}/g' /opt/systemd_sh/conf_cluster.toml
systemctl enable overlord-proxy
systemctl start overlord-proxy
systemctl enable amazon-cloudwatch-agent
systemctl start amazon-cloudwatch-agent
OverlordInstanceProfile:
Type: AWS::IAM::InstanceProfile
Properties:
Path: "/"
Roles:
- CloudWatchAgentServerRole # EC2 Role 权限名称
RedisProxyAutoScalingPolicyCPUUtilization:
Type: AWS::AutoScaling::ScalingPolicy
Properties:
AutoScalingGroupName: !Ref RedisProxyAutoScalingGroup
PolicyType: TargetTrackingScaling
TargetTrackingConfiguration:
PredefinedMetricSpecification:
PredefinedMetricType: ASGAverageCPUUtilization
TargetValue: !Ref RedisClusterProxyAutoScallingCPUThreshold
RedisProxyTargetGroup:
Type: 'AWS::ElasticLoadBalancingV2::TargetGroup'
Properties:
HealthCheckEnabled: true
HealthCheckIntervalSeconds: 10
VpcId: !Ref RedisProxyVPC
Protocol: TCP
Port: 6379
RedisProxyNLB:
Type: 'AWS::ElasticLoadBalancingV2::LoadBalancer'
Properties:
Name: !Ref RedisProxyClusterName
Type: network
Scheme: internal
Subnets: !Split [',', !Join [',', !Ref RedisProxySubnets]]
RedisProxyELBListener:
Type: 'AWS::ElasticLoadBalancingV2::Listener'
DependsOn:
- RedisProxyNLB
- RedisProxyTargetGroup
Properties:
DefaultActions:
- Type: forward
TargetGroupArn: !Ref RedisProxyTargetGroup
Port: 6379
Protocol: TCP
LoadBalancerArn: !Ref RedisProxyNLB
RedisProxyAutoScalingGroup:
Type: 'AWS::AutoScaling::AutoScalingGroup'
DependsOn:
- RedisProxyAutoScalingGroupConfiguration
- RedisProxyTargetGroup
Properties:
TargetGroupARNs:
- !Ref RedisProxyTargetGroup
VPCZoneIdentifier: !Split [',', !Join [',', !Ref RedisProxySubnets]]
DesiredCapacity: !Ref RedisClusterProxyDefaultInstanceCount
HealthCheckGracePeriod: 100
LaunchConfigurationName: !Ref RedisProxyAutoScalingGroupConfiguration
MinSize: !Ref RedisClusterProxyMinimalInstanceCount
MaxSize: !Ref RedisClusterProxyMaximumInstanceCount
Tags:
- Key: Name
Value: !Ref RedisProxyClusterName
PropagateAtLaunch: true
Parameters:
RedisClusterProxyNodeConnCount:
Type: Number
Description: Set Redis Cluster Proxy node connection count
Default: 2
RedisClusterProxyAutoScallingCPUThreshold:
Type: Number
Description: Set CPU threshold for redis proxy cluster scale up
Default: 60
RedisClusterProxyDefaultInstanceCount:
Type: Number
Description: Set initial size of EC2 instances for redis proxy cluster
Default: 4
RedisClusterProxyMinimalInstanceCount:
Type: Number
Description: Set minimize size of EC2 instances for redis proxy cluster
Default: 4
RedisClusterProxyMaximumInstanceCount:
Type: Number
Description: Set maximum size of EC2 instances for redis proxy cluster
Default: 8
RedisClusterProxyInstanceType:
Type: String
Default: c5.large
AllowedValues:
- c5.2xlarge
- c5.xlarge
- c5.large
Description: Enter EC2 type for redis cluster proxy.
RedisProxyClusterName:
Type: String
Description: Specific Redis Proxy Name
RedisClusterConfigurationEndPoint:
Type: String
Description: Specific corresponding Redis Cluster Configuration Endpoint
RedisProxyVPC:
Type: 'AWS::EC2::VPC::Id'
Description: Choose one valid VPC for Redis Proxy
RedisProxySubnets:
Type: 'List<AWS::EC2::Subnet::Id>'
Description: Choose one or more valid subnet for Redis Proxy
RedisProxyKey:
Type: 'AWS::EC2::KeyPair::KeyName'
Description: Select the key pair for those EC2 instance
RedisProxySecurityGroup:
Type: 'AWS::EC2::SecurityGroup::Id'
Description: Choose Security Group for this cloudformation
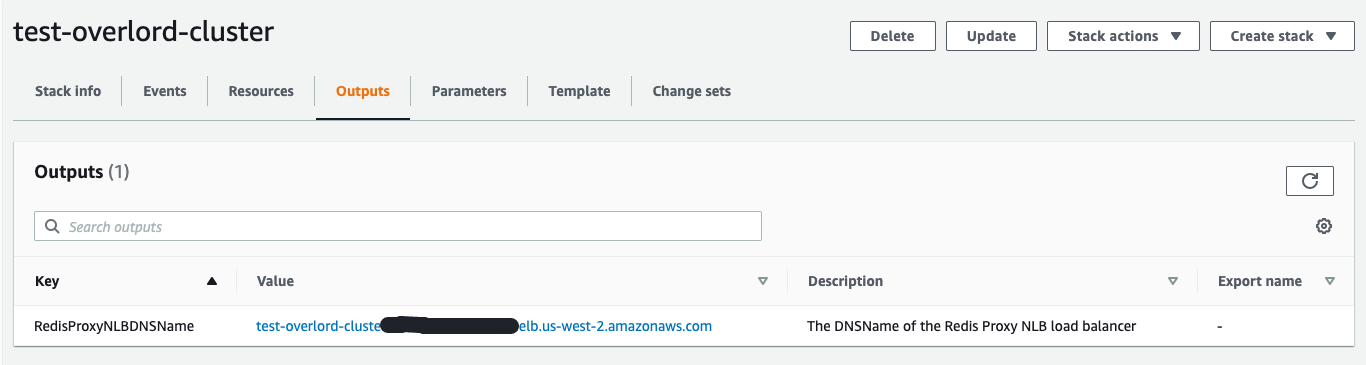
Outputs:
RedisProxyNLBDNSName:
Description: The DNSName of the Redis Proxy NLB load balancer
Value: !GetAtt RedisProxyNLB.DNSName
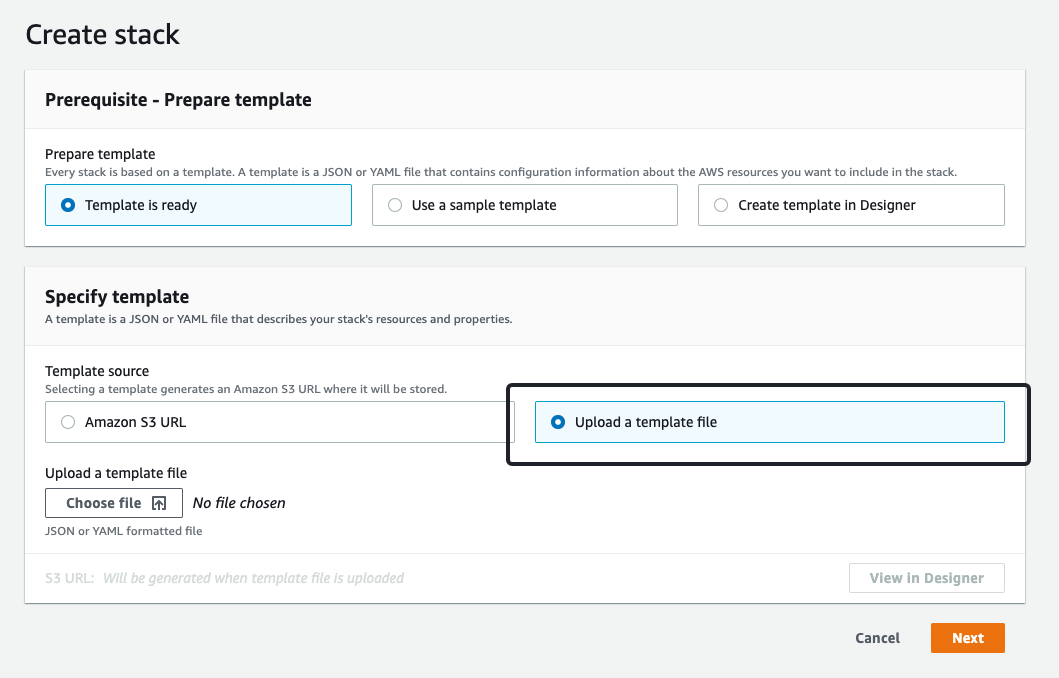
- 打开 AWS 控制台的 CloudFormation dashboard,使用以上模板创建集群。
- 配置 RedisCluster Endpoint 和 Conn Count
- 完成 CloudFormation 堆栈的创建,在 output 获取 NLB 地址
- 利用 Redis-cli 测试 NLB 连通性,最终完成 Overlord Proxy Cluster 代理集群的创建。
配置 Prometheus 和 Grafana 监控
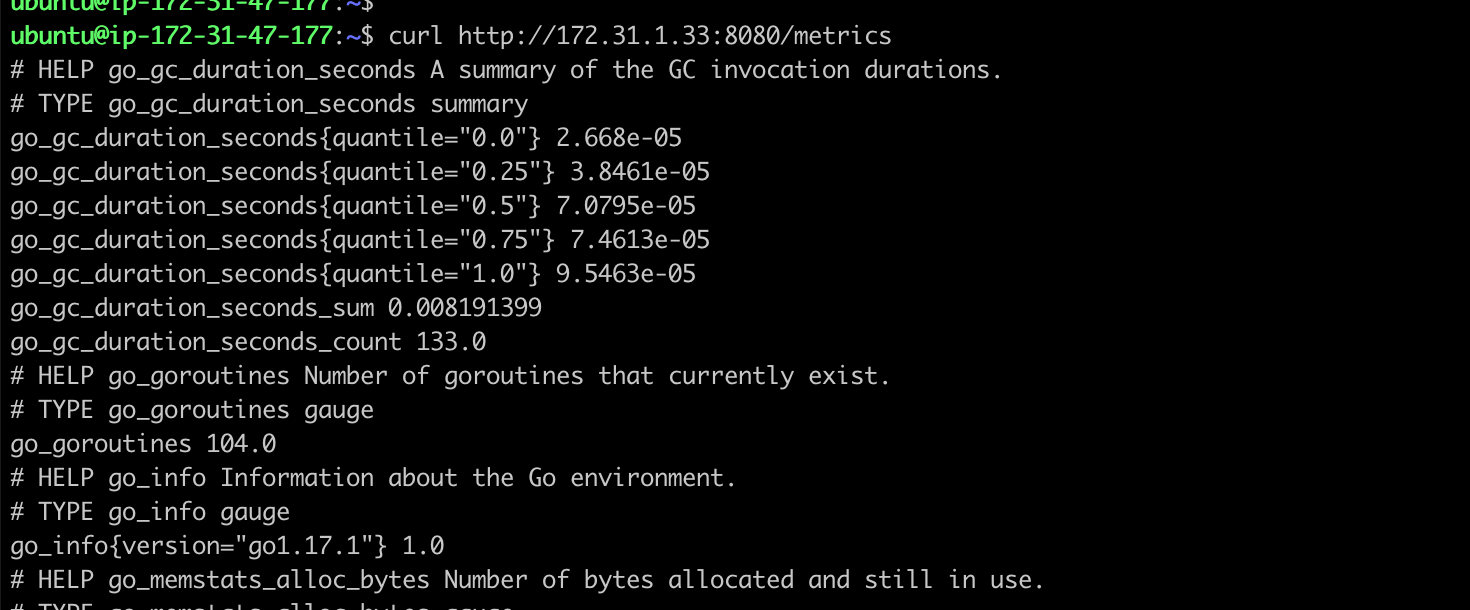
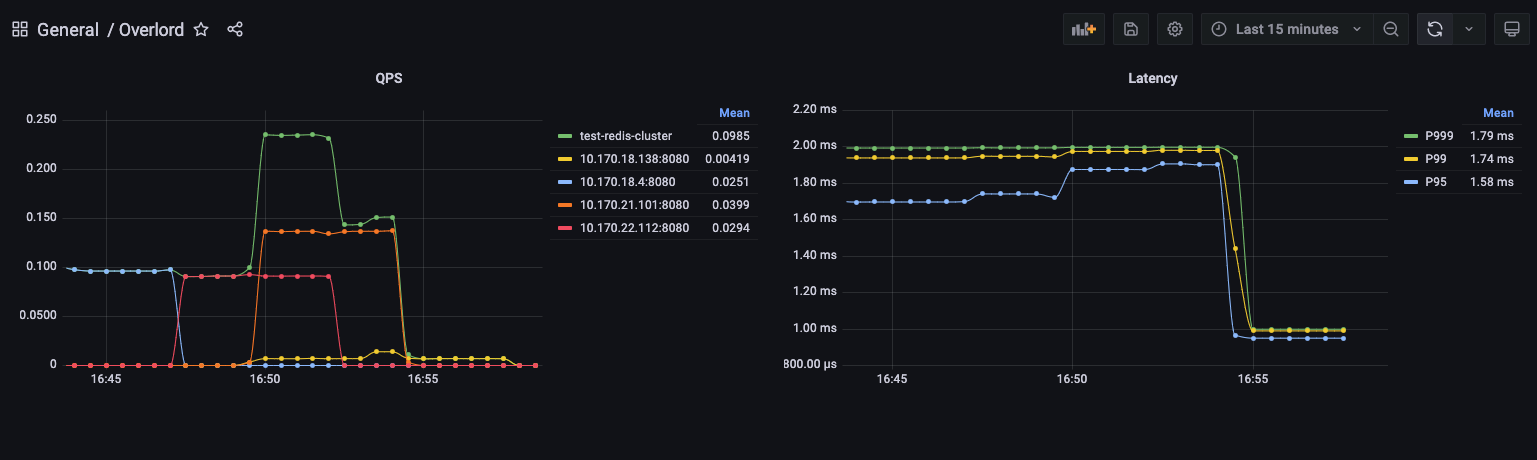
Overlord Proxy 默认集成了 Prometheus 监控SDK,我们可以通过配置文件打开监控端口 8080,通过访问 http://URL:8080/metrics 可以获取到 QPS 和 Latency 两类监控数据。
如果我们的 EKS 集群中部署了 Prometheus 服务,可以通过添加一个 Service 的方式,直接添加对 Overlord 的监控,方便通过 Grafana 配置 Dashboard。
~ vim overlord-prometheus-metrics.yaml
apiVersion: v1
kind: Service
metadata:
  annotations:
    field.cattle.io/ipAddresses: '["10.170.18.138", "10.170.18.4", "10.170.21.101", "10.170.21.112"]' # overlord proxy private IP list
    prometheus.io/path: /metrics
    prometheus.io/port: "8080"
    prometheus.io/scrape: "true"
  labels:
    app: overload-metrics
  name: expose-metrics-overload-metrics
  namespace: prometheus
spec:
  clusterIP: None
  ports:
  - name: http-metrics
    port: 8080
    protocol: TCP
    targetPort: 8080
  sessionAffinity: None
  type: ClusterIP
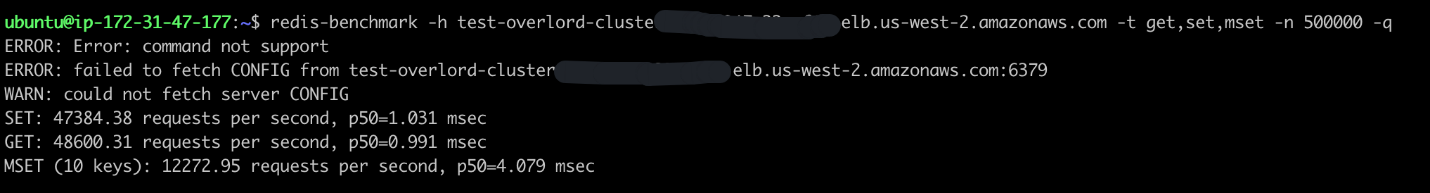
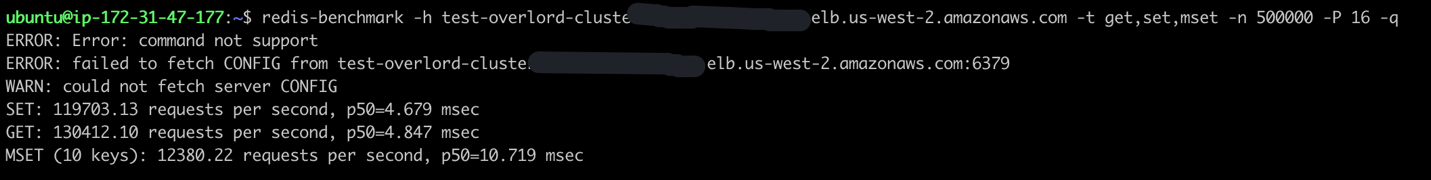
压力测试
利用 redis-benchmark 命令做压力测试,分别测试 pipline 和 非pipeline 两种场景,proxy机型为 c5.large, 以下为压测结果(代理集群不支持CONFIG命令):
压测命令:redis-benchmark -h test-overlord-cluster.elb.us-west-2.amazonaws.com -t get,set,mset -n 500000 -q
压测命令:redis-benchmark -h test-overlord-cluster.elb.us-west-2.amazonaws.com -t get,set,mset -n 500000 -P 16 -q
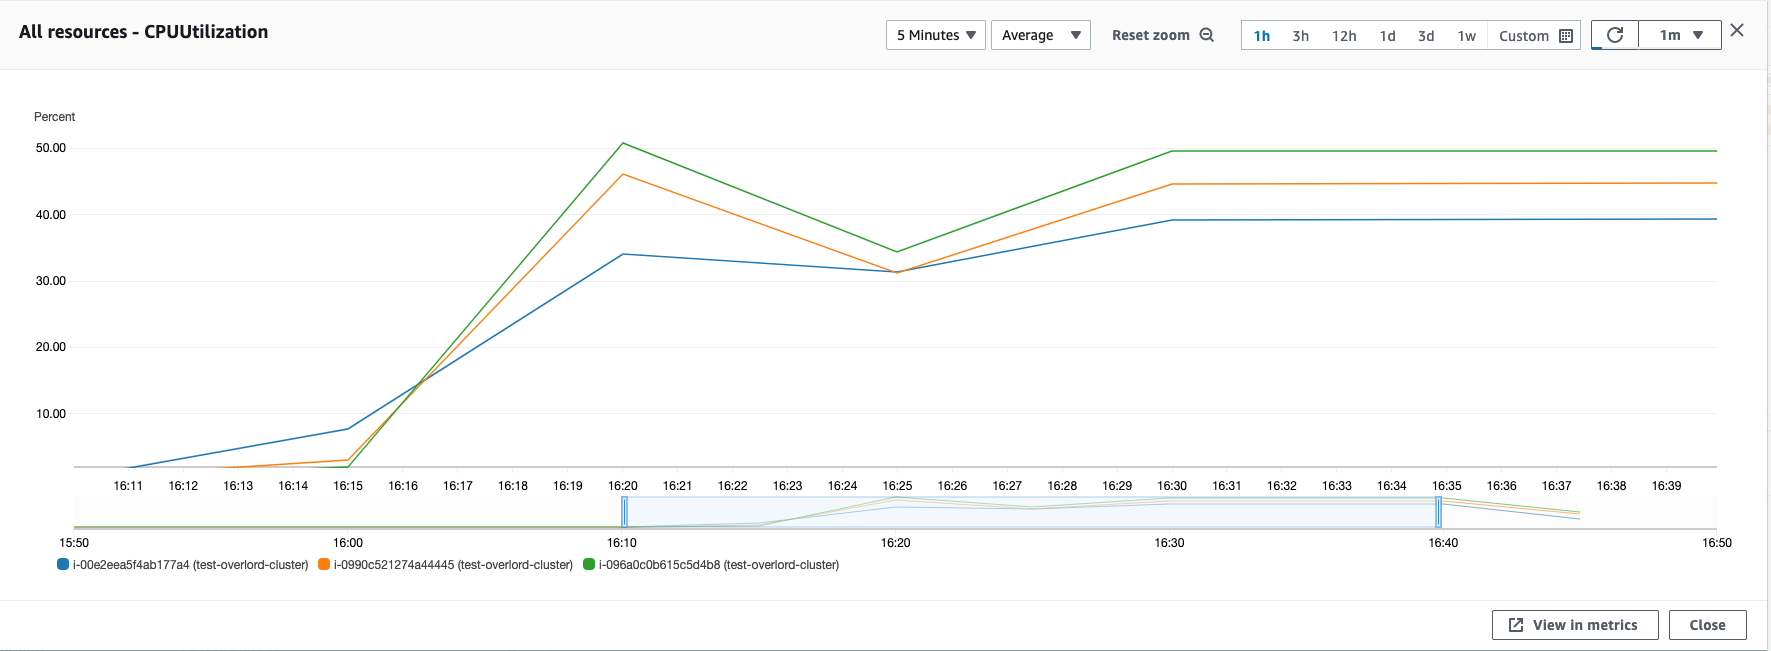
- 利用 memtier_benchmark 工具,可以有效的测试 Overlord 集群的负载均衡表现,通过观测集群 3 个节点的 CPU 负载变化,可以看到在压测过程中,流量是被均衡分发。
代理集群高可用
本方案是基于 NLB + Overlord AutoScaling Group 架构,默认设置按照CPU负载的百分比做集群的扩缩容,利用 NLB + AutoScaling Group 来保证代理集群的高可用。可以在代理集群完成构建后,手动去调整。
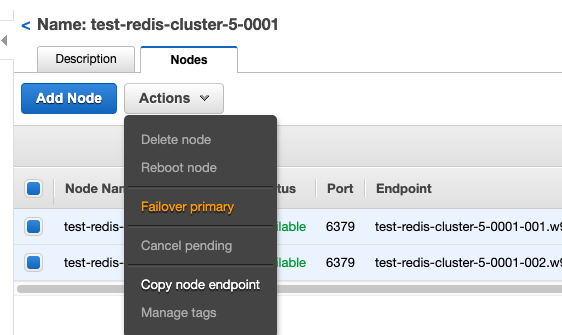
- 为了测试高可用架构,手动触发任意 Shard 的Failover,观察 Overlord 集群的稳定性
触发 Shard 的 Failover,我们可以在控制台上直接手动触发
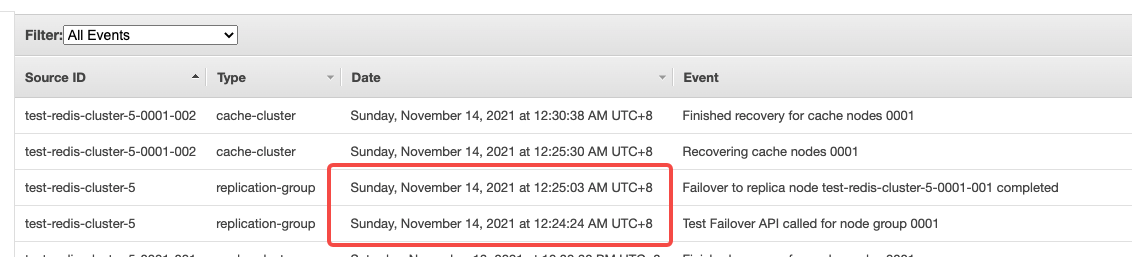
观察 ElastiCache Event,可以看到 Failover 的时间在 40 秒左右完成。由于我们在 Overlord 集群配置的是 ElastiCache Redis 的 Configuration Endpoint URL,Failover 过程本身是基于 DNS 的切换,不需要 Overlord 再进行配置更新。在集群恢复可用后,宕机节点在几分钟内也完成了故障恢复。
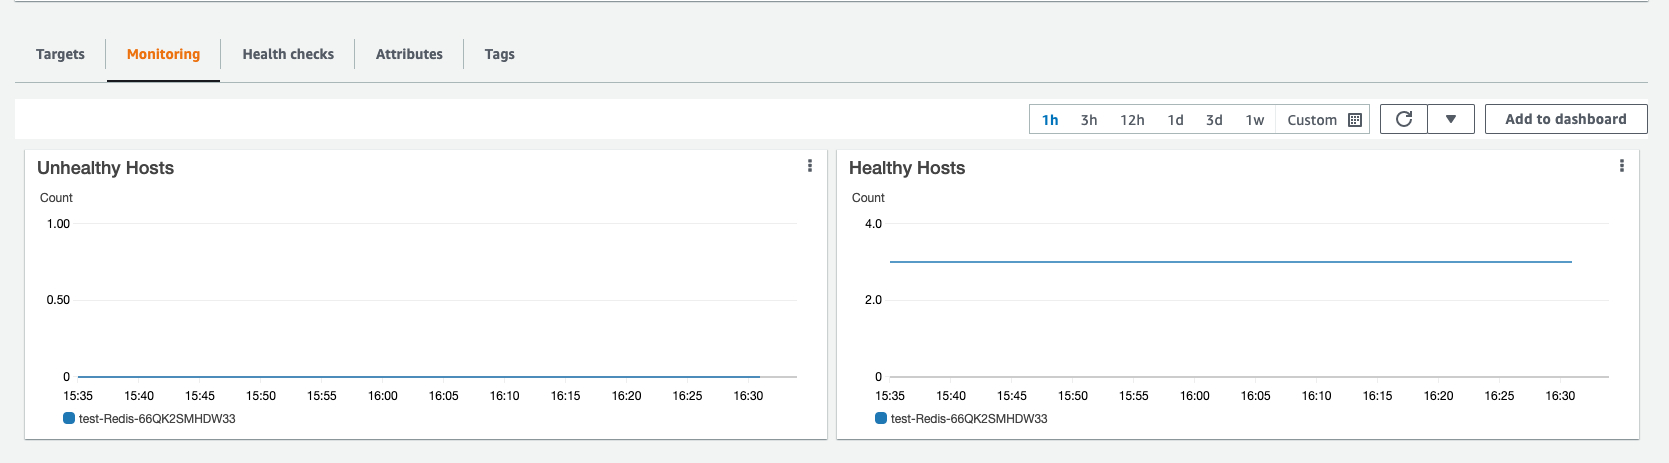
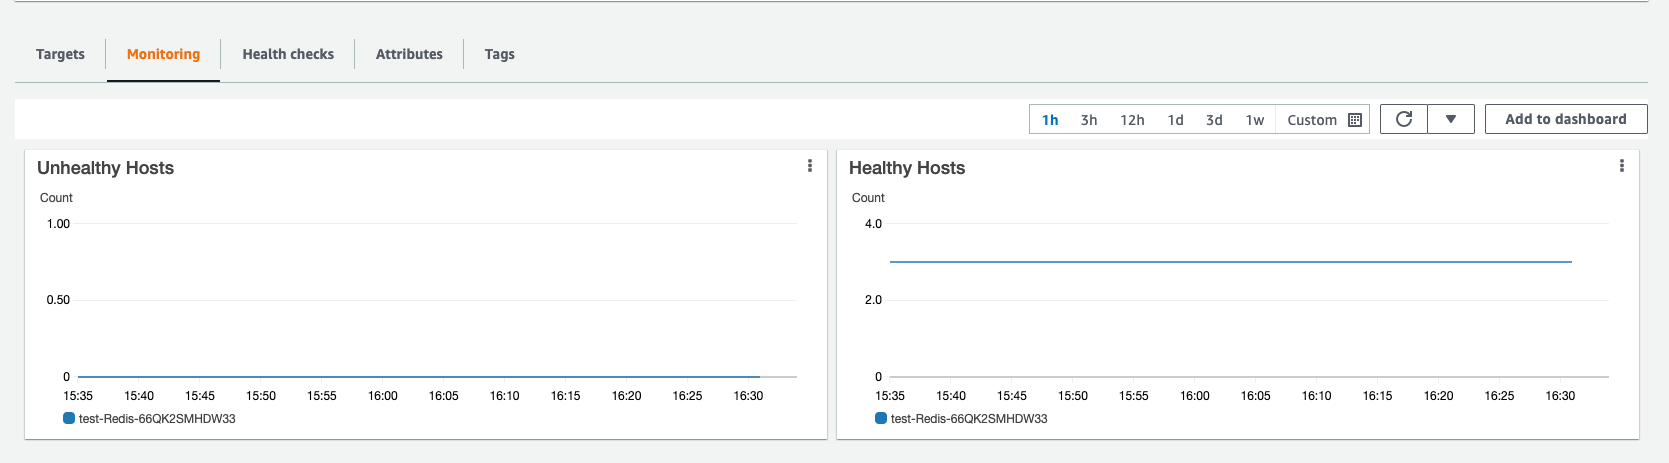
在Failover测试过程中,通过观察 Overlord 的 Target Group 监控,发现 3 台服务器没有发生宕机事件。集群始终保持高可用状态。
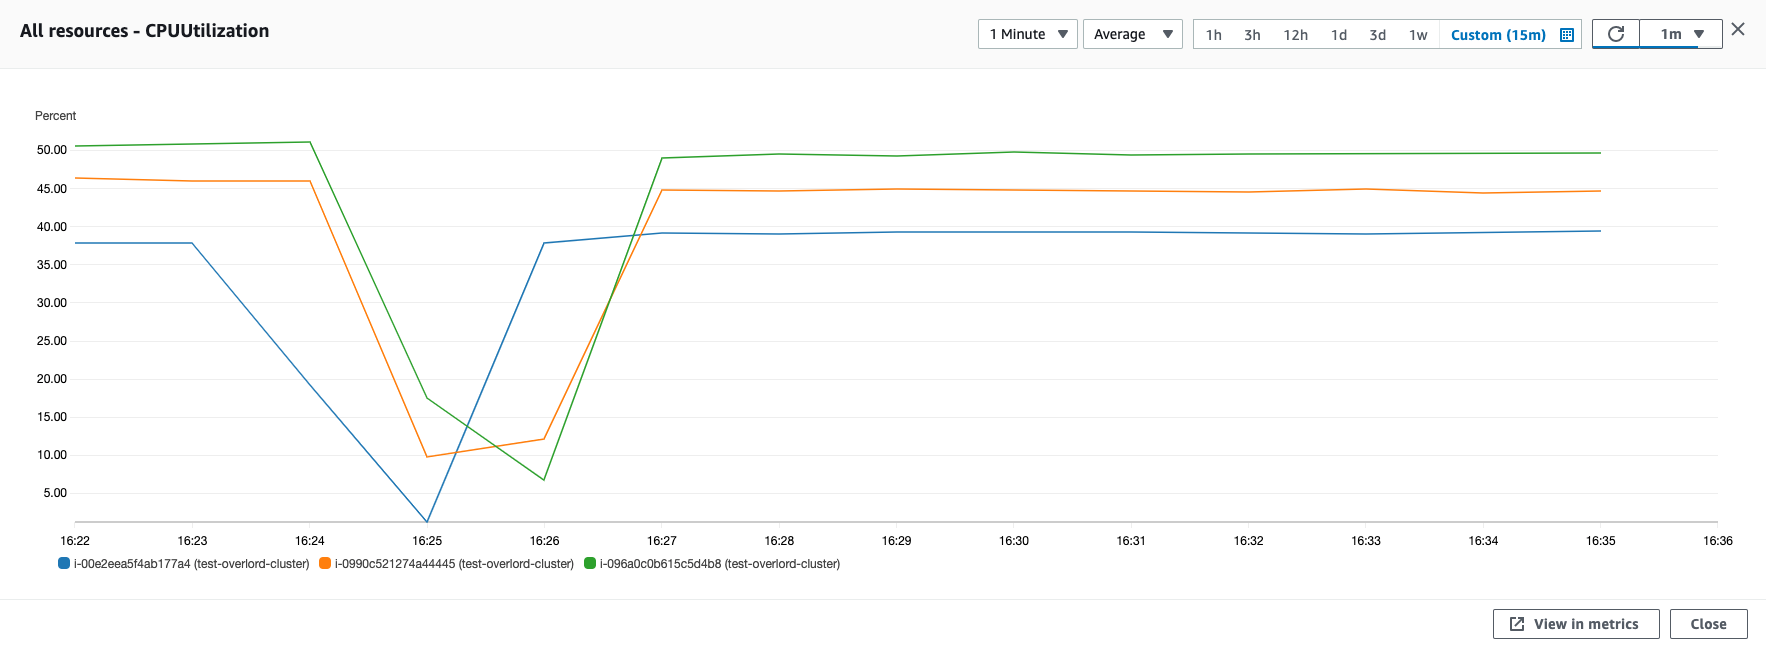
通过观察 Overlord 集群的 CPU 负载监控,发现在 Failover 发生后,集群负载下降,因为 ElastiCache Redis 集群不可用影响了对外服务。在大概 40 秒左右的时间,负载恢复,意味着服务正常对外提供。
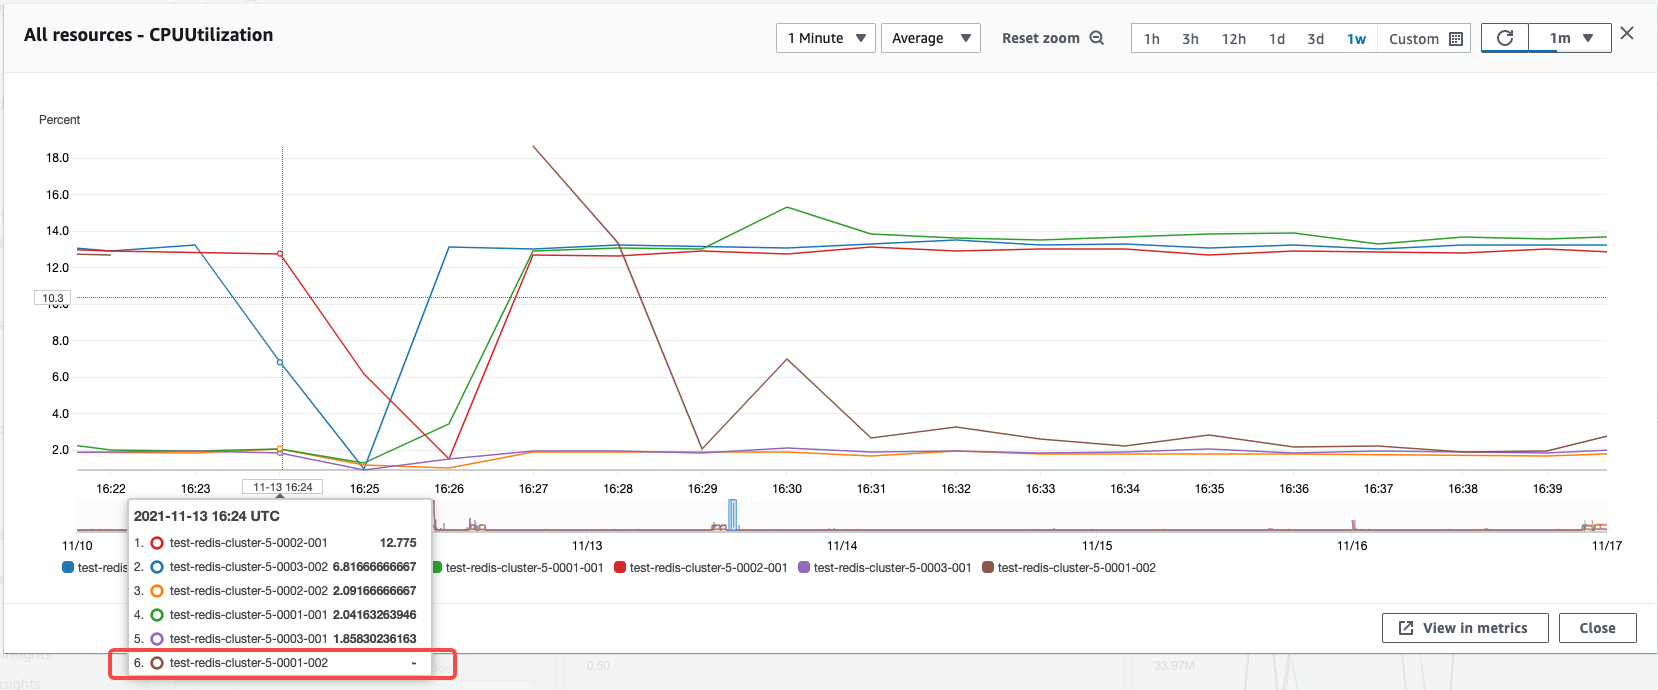
观察 ElastiCache Redis Cluster 在 Failover 时刻 CPU 负载变化,可以看到 0001-002 节点的负载变为 0,其他节点 CPU 负载正常。(中间 CPU 负载中断,是因为压测工具检测到 Failover 异常退出导致)
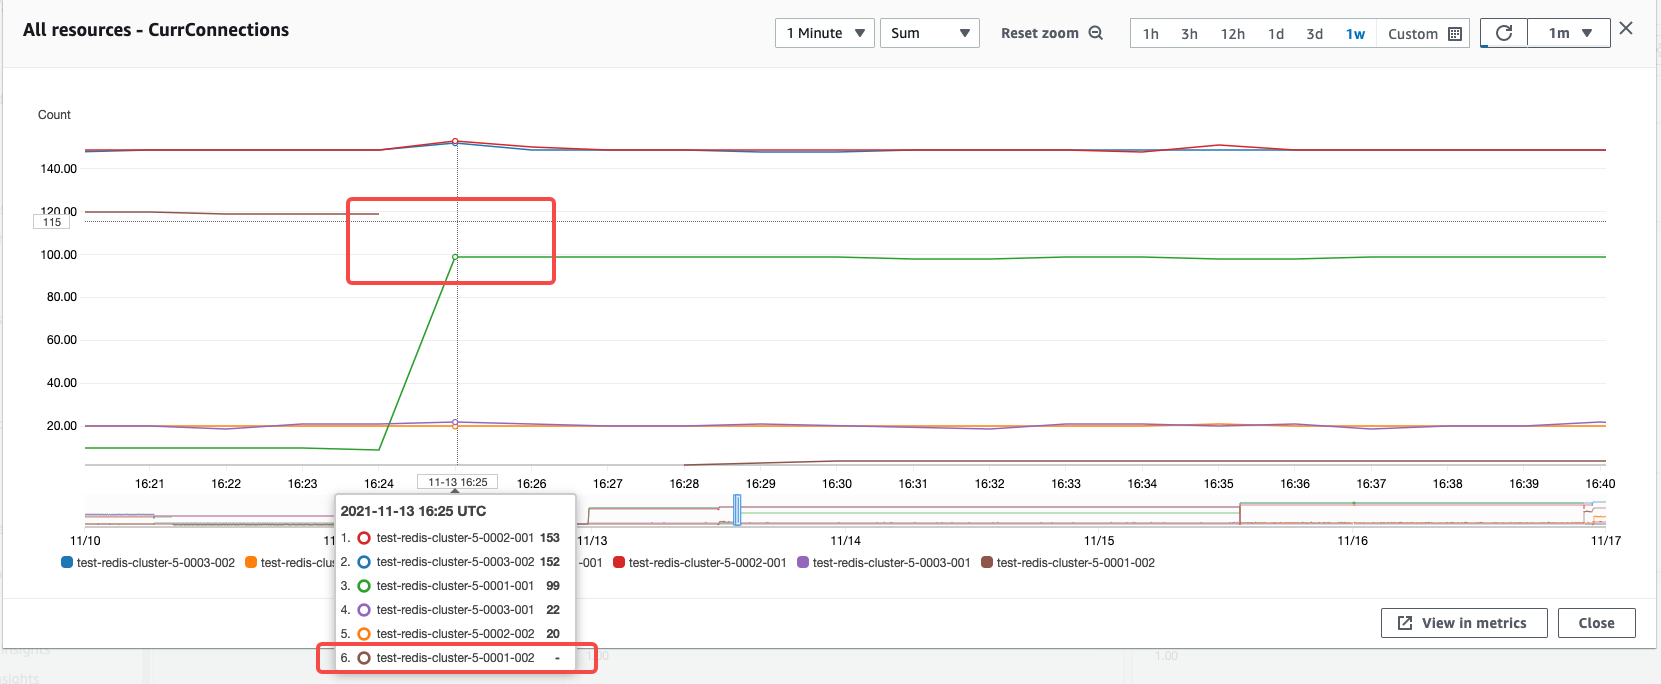
观察 ElastiCache Redis Cluster 在 Failover 时刻连接数变化,可以看到 0001-002 节点连接数降为 0,连接数在40s左右立刻被 0001-001 节点接管。证明在 Failover 期间, Overlord 集群是稳定的,且能很快和提升的新主节点重建连接,保证整套 Proxy 集群的接入稳定性。
总结
Overlord Proxy 代理集群方案 相比 Redis Cluster Proxy 方案, 经过了B站实际线上生产环境的应用,并且使用Golang开发,相比C语言更容易维护。更推荐经过测试验证后用来解决升级到Redis Cluster后业务代码需要修改适配问题。
参考链接
本篇作者