ELK/EFK日志系统
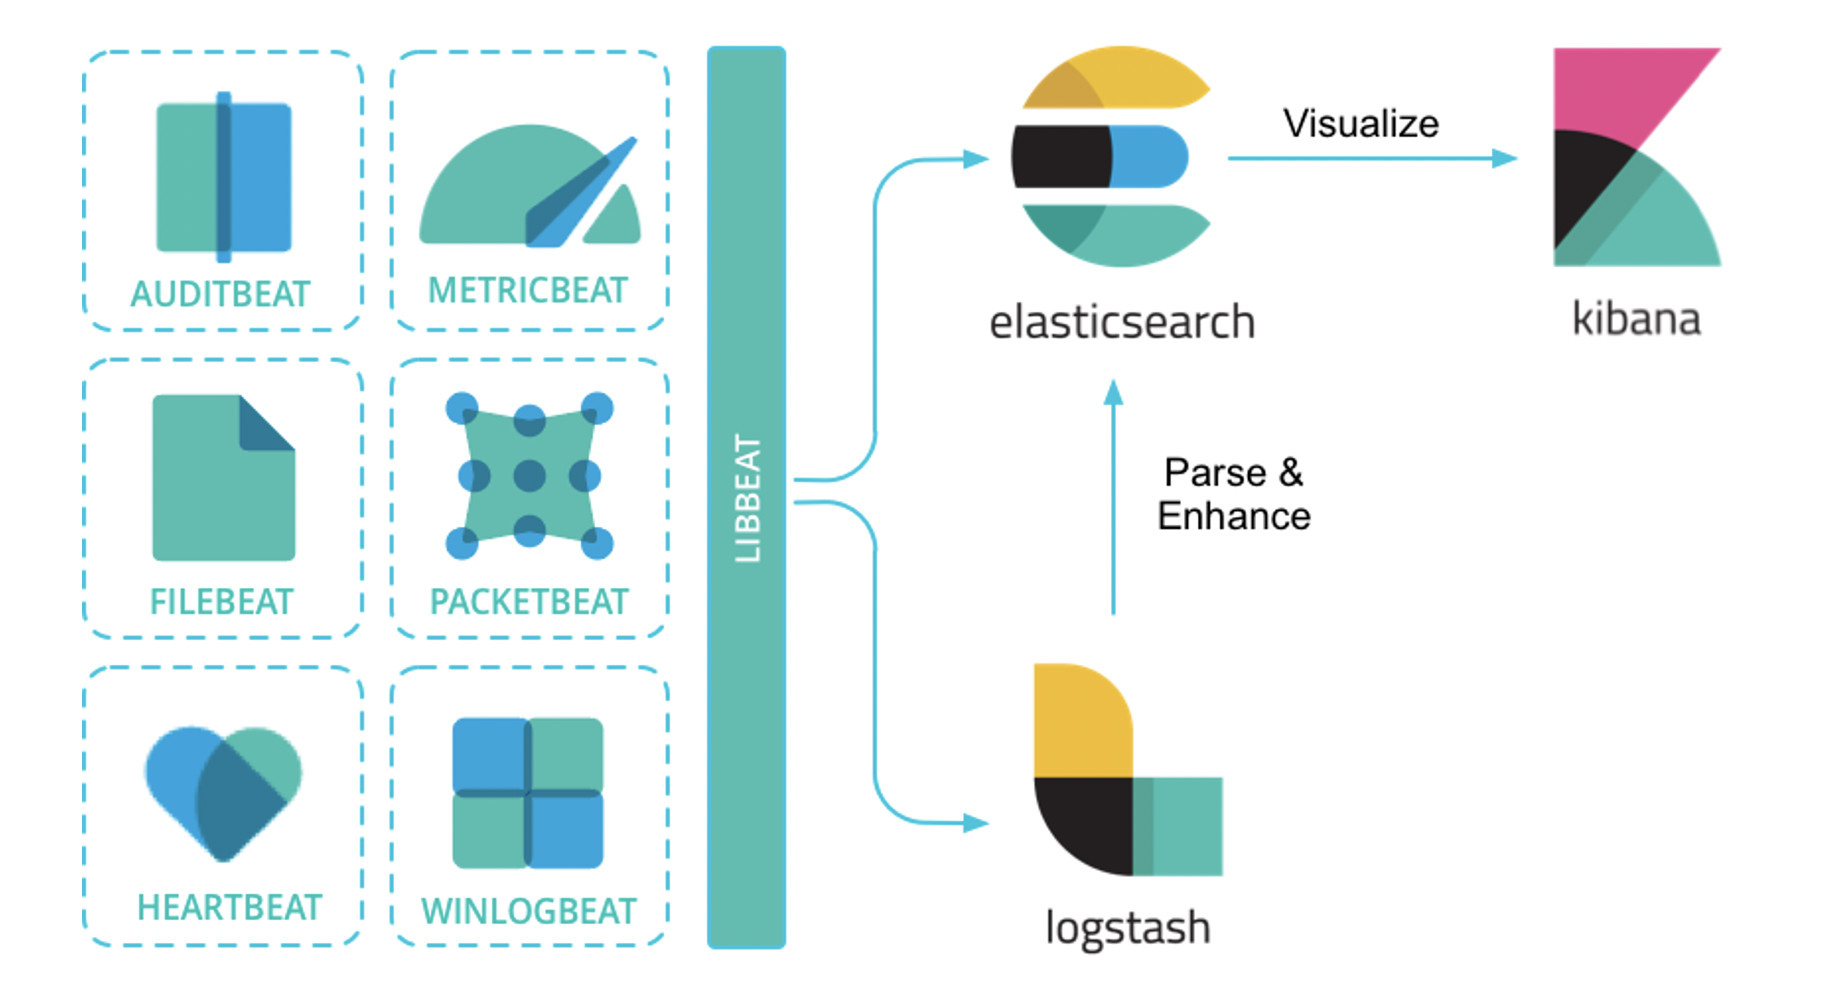
如果今天谈论到要部署一套日志系统,相信用户首先会想到的就是经典的ELK架构,或者现在被称为Elastic Stack。Elastic Stack架构为Elasticsearch + Logstash + Kibana + Beats的组合,其中,Beats负责日志的采集, Logstash负责做日志的聚合和处理,Elasticsearch作为日志的存储和搜索系统,Kibana作为可视化前端展示,整体架构如下图所示:

图片来自https://elastic-stack.readthedocs.io/en/latest/introduction.html
此外,在容器化场景中,尤其是在Kubernetes环境中,用户经常使用的另一套框架是EFK架构。其中,E还是Elasticsearch,K还是Kibana,其中的F代表Fluent Bit,一个开源多平台的日志处理器和转发器。Fluent Bit可以让用户从不同的来源收集数据/日志,统一并发送到多个目的地,并且它完全兼容Docker和Kubernetes环境。

图片来自https://docs.fluentbit.io/manual/installation/kubernetes
PLG日志系统
但是,Grafana Labs提供的另一个日志解决方案PLG目前也逐渐变得流行起来。PLG架构为Promtail + Loki + Grafana的组合,整体架构图下所示:

图片来自https://grafana.com/blog/2018/12/12/loki-prometheus-inspired-open-source-logging-for-cloud-natives/
其中,Grafana大家应该都比较熟悉,它是一款开源的可视化和分析软件,它允许用户查询、可视化、警告和探索监控指标。Grafana主要提供时间序列数据的仪表板解决方案,支持超过数十种数据源(还在陆续添加支持中)。
这里稍微介绍下另外两个软件Promtail和Loki。官方介绍Grafana Loki是一组可以组成一个功能齐全的日志堆栈组件,与其它日志系统不同的是,Loki只建立日志标签的索引而不索引原始日志消息,而是为日志数据设置一组标签,这意味着Loki的运营成本更低,效率也能提高几个数量级。

图片来自https://grafana.com/docs/loki/latest/architecture/
Loki的设计理念收到了很多Prometheus的启发,可以实现可水平扩展、高可用的多租户日志系统。Loki整体架构也是由不同的组件来协同完成日志收集、索引、存储等工作的,各个组件如下所示,有关Loki架构的更多信息这里不再展开描述,可以参考官方文档Loki’s Architecture进一步深入了解。最后,一句话形容下Loki就是like Prometheus, but for logs。

图片来自https://grafana.com/docs/loki/latest/architecture/
Promtail是一个日志收集的代理,它会将本地日志的内容发送到一个Loki实例,它通常部署到需要监视应用程序的每台机器/容器上。Promtail主要是用来发现目标、将标签附加到日志流以及将日志推送到Loki。截止到目前,Promtail可以跟踪两个来源的日志:本地日志文件和systemd日志(仅支持AMD64架构)。
这样看上去,PLG和ELK都能完成类似的日志管理工作,那它们之间的差别在哪里呢?
日志方案对比
首先,ELK/EFK架构功能确实强大,也经过了多年的实际环境验证,其中存储在Elasticsearch中的日志通常以非结构化JSON对象的形式存储在磁盘上,并且Elasticsearch为每个对象都建立了索引,以便进行全文搜索,然后用户可以特定查询语言来搜索这些日志数据。与之对应的Loki的数据存储是解耦的,既可以在磁盘上存储数据,也可以使用如Amazon S3的云存储系统。Loki中的日志带有一组标签名和值,其中只有标签对被索引,这种权衡使得它比完整索引的操作成本更低,但是针对基于内容的查询,需要通过LogQL再单独查询。
和Fluentd相比,Promtail是专门为Loki量身定制的,它可以为运行在同一节点上的Kubernetes Pods做服务发现,从指定文件夹读取日志。Loki采用了类似于Prometheus的标签方式。因此,当与Prometheus部署在同一个环境中时,因为相同的服务发现机制,来自Promtail的日志通常具有与应用程序指标相同的标签,统一了标签管理。
Kibana提供了许多可视化工具来进行数据分析,高级功能比如异常检测等机器学习功能。Grafana专门针对Prometheus和Loki等时间序列数据打造,可以在同一个仪表板上查看日志的指标。
在EKS上部署Promtail + Loki + Grafana解决方案
接下来,我们将演示如何在EKS上部署Promtail + Loki + Grafana组合,下面演示需要有满足一些前提条件:
- 一个正常运行的EKS集群
- 可以执行kubectl命令行的环境
- 可以执行helm命令行的环境
演示环境如下:
- EKS集群版本19.8
- EKS集群为2个托管节点
- Helm版本5.1
1) 部署Promtail + Loki + Grafana
首先,添加helm的repo信息。
$ helm repo add grafana https://grafana.github.io/helm-charts
然后,更新helm repo。
更新完成后,使用helm安装loki和grafana。默认情况下,Loki和Grafana都是安装在default命名空间的,可以添加 –namespace <命名空间> 参数将Loki和Grafana部署在指定的命名空间,这里演示创建一个新的命名空间loki,并将Loki和Grafana都安装在这里。其中grafana.enabled=true选项可以将Grafana一起进行部署,如果希望同时安装Prometheus,则也可以选择配置prometheus.enabled=true参数,演示中并未开启此参数。
$ kubectl create namespace loki
$ helm upgrade --install loki --namespace=loki grafana/loki-stack  --set grafana.enabled=true
正常安装会返回以下输出结果:
Binding
NAME: loki
LAST DEPLOYED: Thu May 13 12:38:52 2021
NAMESPACE: loki
STATUS: deployed
REVISION: 1
NOTES:
The Loki stack has been deployed to your cluster. Loki can now be added as a datasource in Grafana.

See http://docs.grafana.org/features/datasources/loki/ for more detail.
部署完成后,我们来检查下使用helm部署的资源情况:
$ kubectl -n loki get all

NAME                               READY   STATUS    RESTARTS   AGE
pod/loki-0                         1/1     Running   0          113s
pod/loki-grafana-b664d6c4f-qlg87   1/1     Running   0          113s
pod/loki-promtail-jm8x8            1/1     Running   0          113s
pod/loki-promtail-lb8jq            1/1     Running   0          113s

NAME                    TYPE        CLUSTER-IP      EXTERNAL-IP   PORT(S)    AGE
service/loki            ClusterIP   10.100.52.51    <none>        3100/TCP   114s
service/loki-grafana    ClusterIP   10.100.134.81   <none>        80/TCP     114s
service/loki-headless   ClusterIP   None            <none>        3100/TCP   114s

NAME                           DESIRED   CURRENT   READY   UP-TO-DATE   AVAILABLE   NODE SELECTOR   AGE
daemonset.apps/loki-promtail   2         2         2       2            2           <none>          114s

NAME                           READY   UP-TO-DATE   AVAILABLE   AGE
deployment.apps/loki-grafana   1/1     1            1           114s

NAME                                     DESIRED   CURRENT   READY   AGE
replicaset.apps/loki-grafana-b664d6c4f   1         1         1       114s

NAME                    READY   AGE
statefulset.apps/loki   1/1     114s
可以看到通过Helm部署后自动完成了Promtail + Loki + Grafana组合的安装,其中Promtail部署模式为daemonset,在每个计算节点上都有部署,来收集节点以及Pod上的日志信息,具体配置如下所示:
$ kubectl describe ds loki-promtail -n loki

Name:           loki-promtail
Selector:       app=promtail,release=loki
Node-Selector:  <none>
Labels:         app=promtail
                app.kubernetes.io/managed-by=Helm
                chart=promtail-2.2.0
                heritage=Helm
                release=loki
Annotations:    deprecated.daemonset.template.generation: 1
                meta.helm.sh/release-name: loki
                meta.helm.sh/release-namespace: loki
Desired Number of Nodes Scheduled: 2
Current Number of Nodes Scheduled: 2
Number of Nodes Scheduled with Up-to-date Pods: 2
Number of Nodes Scheduled with Available Pods: 2
Number of Nodes Misscheduled: 0
Pods Status:  2 Running / 0 Waiting / 0 Succeeded / 0 Failed
Pod Template:
  Labels:           app=promtail
                    release=loki
  Annotations:      checksum/config: 8c87a13d751c87f1b8726a725bffbe18c827c5e60d4a7aea47cd4871ea8271f3
                    prometheus.io/port: http-metrics
                    prometheus.io/scrape: true
  Service Account:  loki-promtail
  Containers:
   promtail:
    Image:      grafana/promtail:2.1.0
    Port:       3101/TCP
    Host Port:  0/TCP
    Args:
      -config.file=/etc/promtail/promtail.yaml
      -client.url=http://loki:3100/loki/api/v1/push
    Readiness:  http-get http://:http-metrics/ready delay=10s timeout=1s period=10s #success=1 #failure=5
    Environment:
      HOSTNAME:   (v1:spec.nodeName)
    Mounts:
      /etc/promtail from config (rw)
      /run/promtail from run (rw)
      /var/lib/docker/containers from docker (ro)
      /var/log/pods from pods (ro)
  Volumes:
   config:
    Type:      ConfigMap (a volume populated by a ConfigMap)
    Name:      loki-promtail
    Optional:  false
   run:
    Type:          HostPath (bare host directory volume)
    Path:          /run/promtail
    HostPathType:
   docker:
    Type:          HostPath (bare host directory volume)
    Path:          /var/lib/docker/containers
    HostPathType:
   pods:
    Type:          HostPath (bare host directory volume)
    Path:          /var/log/pods
    HostPathType:
Events:
  Type    Reason            Age   From                  Message
  ----    ------            ----  ----                  -------
  Normal  SuccessfulCreate  14m   daemonset-controller  Created pod: loki-promtail-lb8jq
  Normal  SuccessfulCreate  14m   daemonset-controller  Created pod: loki-promtail-jm8x8
Loki本身默认是通过statefulset的方式部署,这是为了避免在数据摄入组件崩溃时丢失索引,因此官方建议将Loki通过statefulset运行,并使用持久化存储来存储索引文件,具体配置如下所示:
$ kubectl describe sts loki -n loki

Name:               loki
Namespace:          loki
CreationTimestamp:  Thu, 13 May 2021 12:38:53 +0000
Selector:           app=loki,release=loki
Labels:             app=loki
                    app.kubernetes.io/managed-by=Helm
                    chart=loki-2.3.0
                    heritage=Helm
                    release=loki
Annotations:        meta.helm.sh/release-name: loki
                    meta.helm.sh/release-namespace: loki
Replicas:           1 desired | 1 total
Update Strategy:    RollingUpdate
Pods Status:        1 Running / 0 Waiting / 0 Succeeded / 0 Failed
Pod Template:
  Labels:           app=loki
                    name=loki
                    release=loki
  Annotations:      checksum/config: fd74389a2862aeb2df7c193d74824ebd1a14c8c061df4bc9f5bb6ce1cbae4b8c
                    prometheus.io/port: http-metrics
                    prometheus.io/scrape: true
  Service Account:  loki
  Containers:
   loki:
    Image:      grafana/loki:2.1.0
    Port:       3100/TCP
    Host Port:  0/TCP
    Args:
      -config.file=/etc/loki/loki.yaml
    Liveness:     http-get http://:http-metrics/ready delay=45s timeout=1s period=10s #success=1 #failure=3
    Readiness:    http-get http://:http-metrics/ready delay=45s timeout=1s period=10s #success=1 #failure=3
    Environment:  <none>
    Mounts:
      /data from storage (rw)
      /etc/loki from config (rw)
  Volumes:
   config:
    Type:        Secret (a volume populated by a Secret)
    SecretName:  loki
    Optional:    false
   storage:
    Type:       EmptyDir (a temporary directory that shares a pod's lifetime)
    Medium:
    SizeLimit:  <unset>
Volume Claims:  <none>
Events:
  Type    Reason            Age   From                    Message
  ----    ------            ----  ----                    -------
  Normal  SuccessfulCreate  10m   statefulset-controller  create Pod loki-0 in StatefulSet loki successful
最后Grafana是通过deployment来完成的,具体配置如下所示:
$ kubectl describe deployment loki-grafana -n loki

Name:                   loki-grafana
Namespace:              loki
CreationTimestamp:      Thu, 13 May 2021 12:38:53 +0000
Labels:                 app.kubernetes.io/instance=loki
                        app.kubernetes.io/managed-by=Helm
                        app.kubernetes.io/name=grafana
                        app.kubernetes.io/version=6.7.0
                        helm.sh/chart=grafana-5.7.10
Annotations:            deployment.kubernetes.io/revision: 1
                        meta.helm.sh/release-name: loki
                        meta.helm.sh/release-namespace: loki
Selector:               app.kubernetes.io/instance=loki,app.kubernetes.io/name=grafana
Replicas:               1 desired | 1 updated | 1 total | 1 available | 0 unavailable
StrategyType:           RollingUpdate
MinReadySeconds:        0
RollingUpdateStrategy:  25% max unavailable, 25% max surge
Pod Template:
  Labels:           app.kubernetes.io/instance=loki
                    app.kubernetes.io/name=grafana
  Annotations:      checksum/config: 19aac1c3228c4f4807da30538c8541c01e6b17fa3b518f80ab4f400621bb175c
                    checksum/dashboards-json-config: 01ba4719c80b6fe911b091a7c05124b64eeece964e09c058ef8f9805daca546b
                    checksum/sc-dashboard-provider-config: 01ba4719c80b6fe911b091a7c05124b64eeece964e09c058ef8f9805daca546b
                    checksum/secret: 416bf8ba1672c41e905574cab63bd1f658e30bc29309dcb7e68effdfbcb989f6
  Service Account:  loki-grafana
  Init Containers:
   grafana-sc-datasources:
    Image:      kiwigrid/k8s-sidecar:0.1.209
    Port:       <none>
    Host Port:  <none>
    Environment:
      METHOD:    LIST
      LABEL:     grafana_datasource
      FOLDER:    /etc/grafana/provisioning/datasources
      RESOURCE:  both
    Mounts:
      /etc/grafana/provisioning/datasources from sc-datasources-volume (rw)
  Containers:
   grafana:
    Image:       grafana/grafana:6.7.0
    Ports:       80/TCP, 3000/TCP
    Host Ports:  0/TCP, 0/TCP
    Liveness:    http-get http://:3000/api/health delay=60s timeout=30s period=10s #success=1 #failure=10
    Readiness:   http-get http://:3000/api/health delay=0s timeout=1s period=10s #success=1 #failure=3
    Environment:
      GF_SECURITY_ADMIN_USER:      <set to the key 'admin-user' in secret 'loki-grafana'>      Optional: false
      GF_SECURITY_ADMIN_PASSWORD:  <set to the key 'admin-password' in secret 'loki-grafana'>  Optional: false
    Mounts:
      /etc/grafana/grafana.ini from config (rw,path="grafana.ini")
      /etc/grafana/provisioning/datasources from sc-datasources-volume (rw)
      /var/lib/grafana from storage (rw)
  Volumes:
   config:
    Type:      ConfigMap (a volume populated by a ConfigMap)
    Name:      loki-grafana
    Optional:  false
   storage:
    Type:       EmptyDir (a temporary directory that shares a pod's lifetime)
    Medium:
    SizeLimit:  <unset>
   sc-datasources-volume:
    Type:       EmptyDir (a temporary directory that shares a pod's lifetime)
    Medium:
    SizeLimit:  <unset>
Conditions:
  Type           Status  Reason
  ----           ------  ------
  Available      True    MinimumReplicasAvailable
  Progressing    True    NewReplicaSetAvailable
OldReplicaSets:  loki-grafana-b664d6c4f (1/1 replicas created)
NewReplicaSet:   <none>
Events:
  Type    Reason             Age   From                   Message
  ----    ------             ----  ----                   -------
  Normal  ScalingReplicaSet  16m   deployment-controller  Scaled up replica set loki-grafana-b664d6c4f to 1
接下来,访问Grafana UI界面来查看部署结果。首先,通过以下命令获取Grafana管理员的密码:
$ kubectl get secret --namespace loki loki-grafana -o jsonpath="{.data.admin-password}" | base64 --decode ; echo
然后通过以下命令转发Grafana的接口,以便通过Web UI进行访问。默认情况下,端口转发的地址localhost,可以根据kubectl所在实例的情况补充设置–address <IP地址>。
$ kubectl port-forward --namespace loki service/loki-grafana 3000:80
打开localhost:3000或者<IP地址>:3000来查看Grafana,登录过程输入用户名admin和上面获得到的密码。

成功登录后可以正常进入到Grafana首页,如下图所示。

默认Loki数据源(http://loki:3100)已经添加进去了。

在Grafana侧边栏选择Explore进行快速日志查看,进入到Explore页面后选择Loki数据源,然后选择Logs标签,最后在Logs Labels中输入标签的查询条件,例如{namespace=”loki”},执行查询后就可以看到类似下图中的日志信息。

上面的日志信息是通过默认部署的Daemon Set的Promtail收集到的日志。
默认情况下,Loki的索引存储是通过boltdb-shipper来实现的,关于boltdb-shipper的更多信息请参考官方文档Single Store Loki (boltdb-shipper index type)。这些配置是通过secret(内容为loki.yaml的详细配置)挂载到Pod中的,查看Loki配置文件的默认值:
$ kubectl get secrets loki -n loki -o "jsonpath={.data['loki\.yaml']}" | base64 -d

auth_enabled: false
chunk_store_config:
  max_look_back_period: 0s
compactor:
  shared_store: filesystem
  working_directory: /data/loki/boltdb-shipper-compactor
ingester:
  chunk_block_size: 262144
  chunk_idle_period: 3m
  chunk_retain_period: 1m
  lifecycler:
    ring:
      kvstore:
        store: inmemory
      replication_factor: 1
  max_transfer_retries: 0
limits_config:
  enforce_metric_name: false
  reject_old_samples: true
  reject_old_samples_max_age: 168h
schema_config:
  configs:
  - from: "2020-10-24"
    index:
      period: 24h
      prefix: index_
    object_store: filesystem
    schema: v11
    store: boltdb-shipper
server:
  http_listen_port: 3100
storage_config:
  boltdb_shipper:
    active_index_directory: /data/loki/boltdb-shipper-active
    cache_location: /data/loki/boltdb-shipper-cache
    cache_ttl: 24h
    shared_store: filesystem
  filesystem:
    directory: /data/loki/chunks
table_manager:
  retention_deletes_enabled: false
  retention_period: 0s
其中store: boltdb-shipper和object_store: filesystem分别指定了使用boltdb-shipper和文件系统来作为索引和日志文件的存储,这些都需要额外的维护,因为Loki实现了计算存储分离,所以这里可以充分借助云上的资源来减轻运维管理的负担,在亚马逊云平台上可以使用Amazon DynamoDB作为索引实现快速的键值存储的读写,使用Amazon S3作为日志存储实现大规模日志存储,同时也具备极高的存储性价比,下面将演示这些内容的配置。
2) 使用DynamoDB作为索引,S3作为日志存储
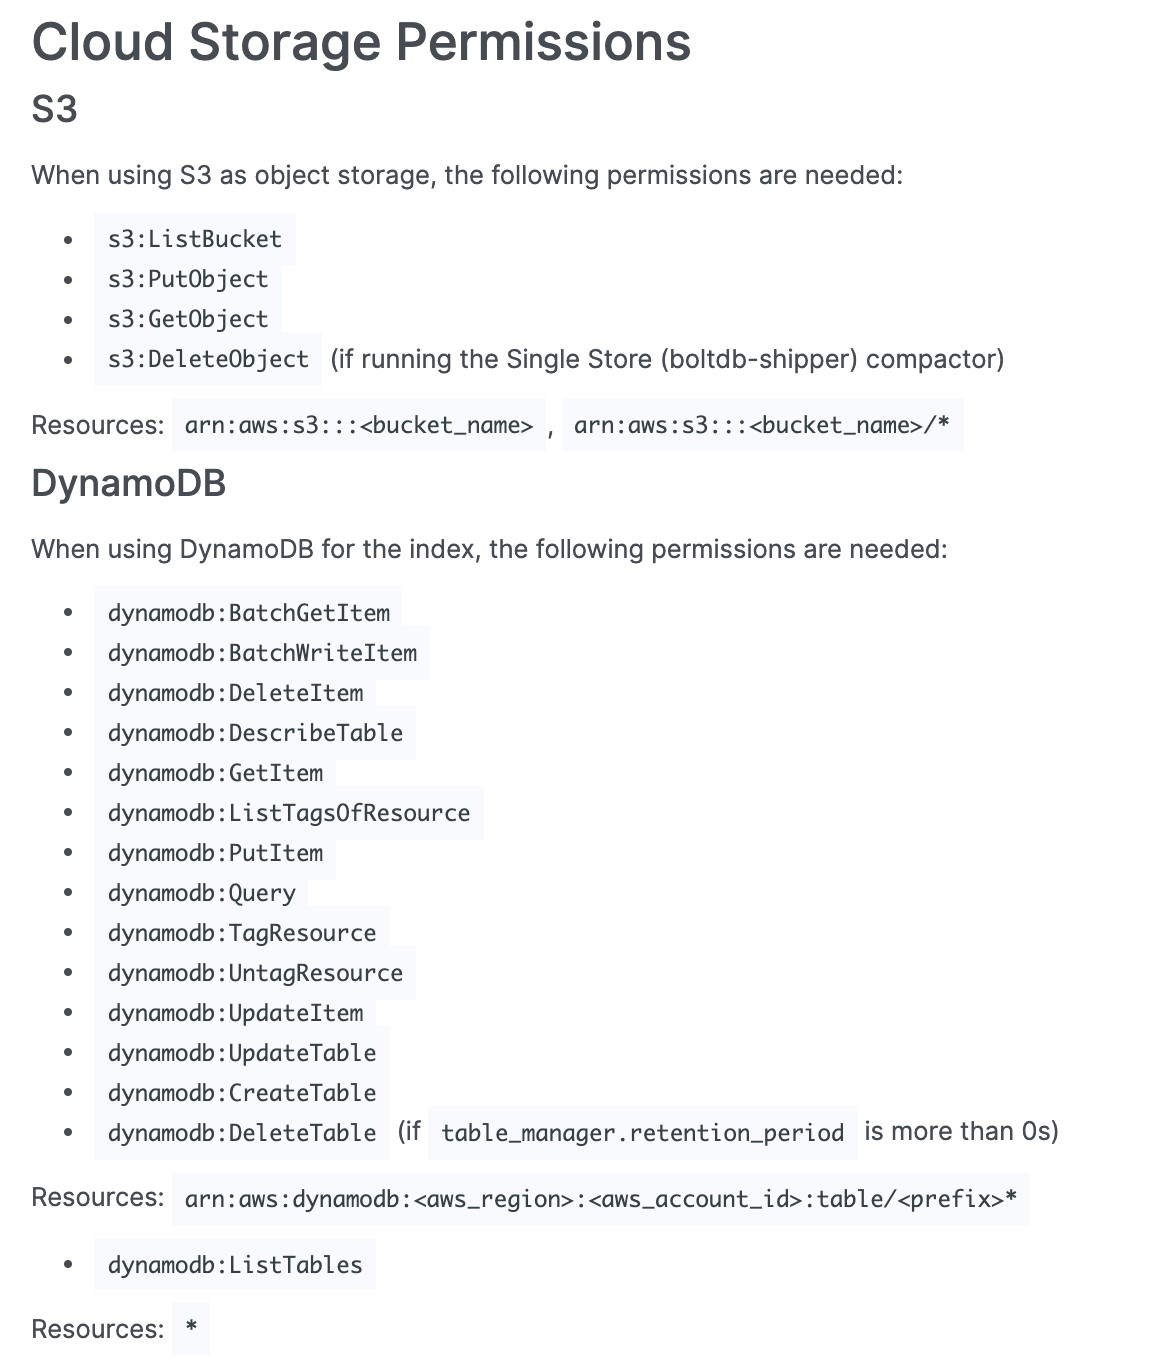
首先,节点要操作DynamoDB和S3就需要有足够的IAM权限:

具体权限请参考官方文档Loki Storage为EKS的节点配置相应权限。
接下来,要想真正使用DynamoDB作为Loki的索引存储、S3作为日志存储,需要配置loki.yaml文件,这里可以修改secret文件,也可以配置新的configmap来挂载到Pod上。无论采用哪一种方式,主要的修改内容为schema_config和storage_config,具体配置如下所示:
schema_config:
  configs:
  - from: "2020-10-24"
    index:
      period: 0
      prefix: loki_index
    object_store: s3
    schema: v11
    store: aws
server:
  http_listen_port: 3100
storage_config:
  aws:
    s3: s3://us-east-1/loki-shtian
    dynamodb:
      dynamodb_url: dynamodb://us-east-1
其中,schema_config 中的store: aws设置指定索引存储,object_store: s3设置指定日志存储,需要注意的是period的值需要设置为0,否则Loki将会为每个时间段的日志都创建出单独的索引表,设置为0可以保证只有一个DynamaDB表被创建出来,存储所有索引信息。prefix为我们指定的DynamoDB表的名称。
存储配置storage_config中分别填写了DynamaDB和S3的相关信息,这里的S3存储桶以之前创建的loki-shtian为例,请根据实际情况进行调整,示例选择的区域以美东区(us-east-1)为例。其他配置保持默认不变。
完成上述配置编写后,前文提到既可以通过修改secret对象loki来生效,也可以使用configmap单独配置挂载,这里以更新secrets对象为例,通过以下命令更新secret对象(假设当前路径下有配置好的loki.yaml文件):
$ kubectl -n loki create secret generic loki --from-file=./loki.yaml -o yaml --dry-run=client | kubectl apply -f -
之后,通过以下命令重启statefulset中的Pod:
$ kubectl -n loki rollout restart statefulset loki
查看Pod日志信息,如下所示,可以看到Loki会自动创建DynamoDB表loki_index,并按照默认的参数配置DynamoDB的WCU(1000)和RCU值(300),这些都可以参考官方文档Configuring Loki进行定制化配置。
$ kubectl -n loki logs -f loki-0

level=info ts=2021-05-13T15:17:41.673886077Z caller=table_manager.go:476 msg="creating table" table=loki_index
level=info ts=2021-05-13T15:19:41.603526262Z caller=table_manager.go:324 msg="synching tables" expected_tables=1
level=info ts=2021-05-13T15:19:42.627187815Z caller=table_manager.go:531 msg="provisioned throughput on table, skipping" table=loki_index read=300 write=1000
level=info ts=2021-05-13T15:21:41.603525185Z caller=table_manager.go:324 msg="synching tables" expected_tables=1
level=info ts=2021-05-13T15:21:42.623189111Z caller=table_manager.go:531 msg="provisioned throughput on table, skipping" table=loki_index read=300 write=1000
关于DynamaDB和S3的配置示例可以参考官方文档Loki Configuration Examples,详细的配置信息可以参考官方文档Configuring Loki。配置后的DynamoDB表使用h作为分区键,使用r作为排序键,如下图所示:

根据日志中的信息可以看到DynamoDB的WCU和RCU值配置为1000和300,如下图所示:

DynamoDB表使用c 作为索引的内容列,如下图所示:

查看S3中的日志数据,如下图所示:


再次查看Grafana界面,查询日志信息一切正常运行。

小结
本文首先简单介绍了经典的日志系统ELK/EFK架构,引出了Grafana新推出的PLG架构,并探讨了两种架构之间的对比和重点发展的方向。然后,本文介绍了在亚马逊云平台的EKS服务上部署Promtail + Loki + Grafana解决方案,以及配置使用Amazon DynamoDB和Amazon S3,以充分借助云服务的高性价比优势,降低用户维护管理成本。
由于篇幅有限,关于Loki的详细架构介绍和更多高级功能(如多租户)和高级配置(如DynamoDB详细配置)都没有展开,希望有机会会再进行讨论。关于和Prometheus共同部署的方案也是用户考虑使用PLG的重要因素,以此实现整体的可观测性解决方案,用户可以结合实际情况进行配合使用。
此外,亚马逊云科技也提供了Grafana和Prometheus的托管服务Amazon Managed Service for Grafana(AMG)和Amazon Managed Service for Prometheus(AMP),可以非常方便地与其他云服务快速集成,使用户可以轻松地可视化和分析规模的运营数据以及大规模监控容器化的应用程序。
参考资料:
https://grafana.com/docs/loki/latest/
https://elastic-stack.readthedocs.io/en/latest/introduction.html
https://grafana.com/blog/2018/12/12/loki-prometheus-inspired-open-source-logging-for-cloud-natives/
https://docs.fluentbit.io/manual/installation/kubernetes
本篇作者