In this tutorial, you create data analyses, visualize the data, create stories and share the analyses through data dashboards in the cloud using Amazon QuickSight.
Amazon QuickSight is fast, cloud-powered business intelligence service that can help you to build visualizations, perform ad hoc analysis, and get business insights from your data.
In this tutorial, you learn how to create a dataset, prepare the data, create an analysis, create a visual, modify the visual, add more visuals, add scenes to story, publish as dashboard and delete your AWS resources. A sample data source is provided for your use during this tutorial and available for download: Sales Orders.xlsx.zip. This data source is publically available as the Global Superstore data set on Kaggle.
The AWS services you use in this tutorial are AWS Free Tier eligible.
| About this Tutorial | |
|---|---|
| Time | 30 minutes |
| Cost | AWS Free Tier Eligible |
| Use Case | Analytics |
| Products | Amazon QuickSight |
| Audience | Developer |
| Level | Beginner |
| Last Updated | August 10, 2020 |
Step 1. Create an AWS Account
The resources created and used in this tutorial are AWS Free Tier eligible.
Already have an account? Sign-in
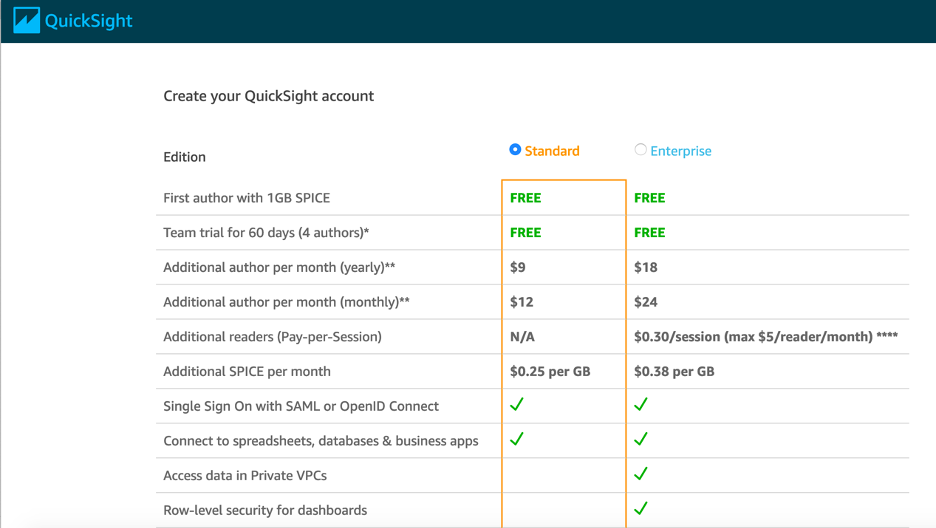
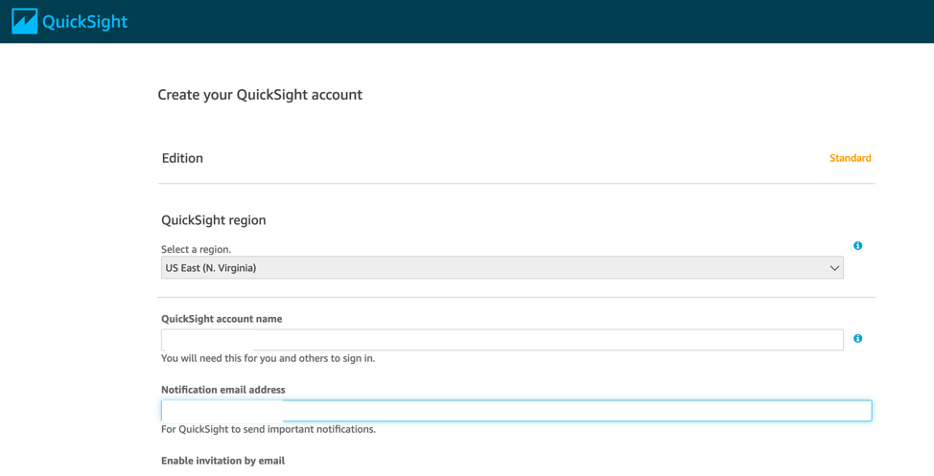
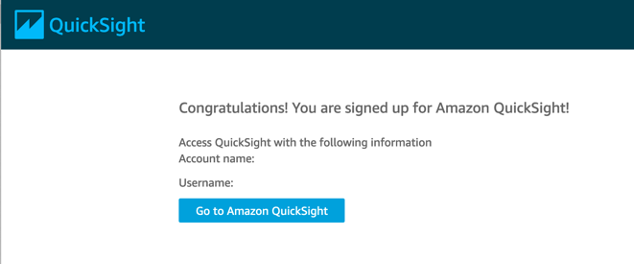
Step 2. Create your Amazon QuickSight account
Complete the following steps to create your Amazon QuickSight account.
Note: For more information, see Setting up Amazon QuickSight in the Amazon QuickSight documentation.
a. Open the Amazon QuickSight landing page and choose Sign up for QuickSight.

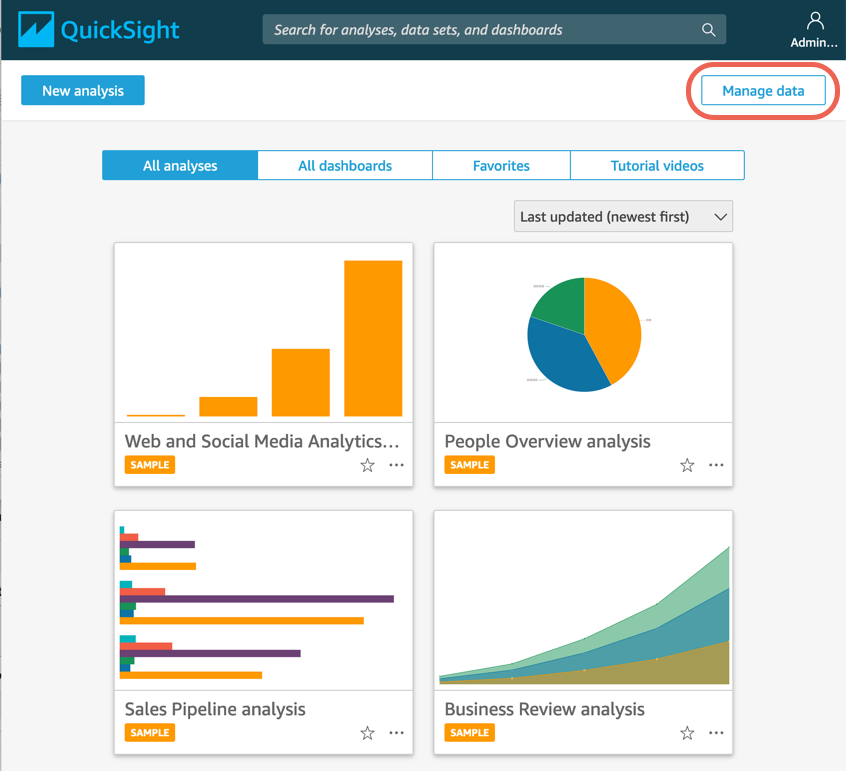
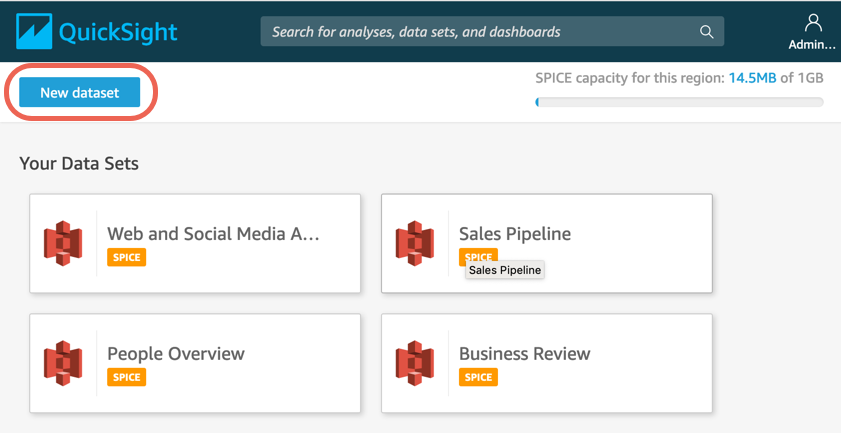
Step 3. Create the dataset
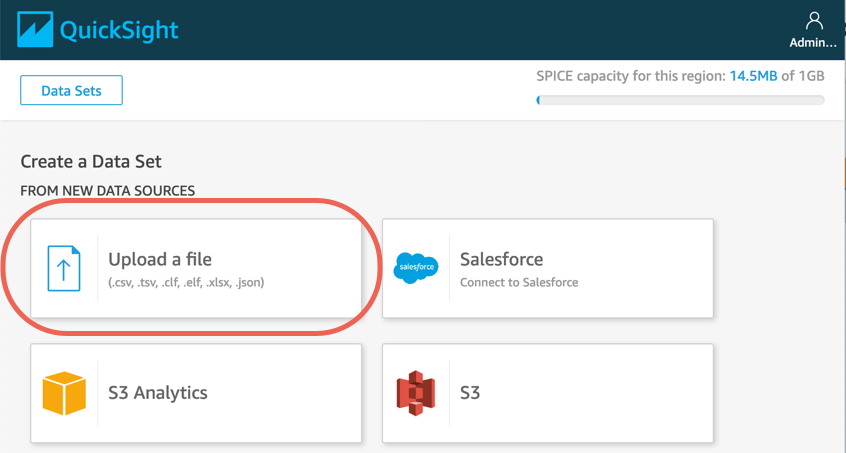
Complete the following steps to upload your Sales Orders.xlsx sample data source and create a new dataset.
Note: For more information, see Creating Datasets in the Amazon QuickSight documentation.
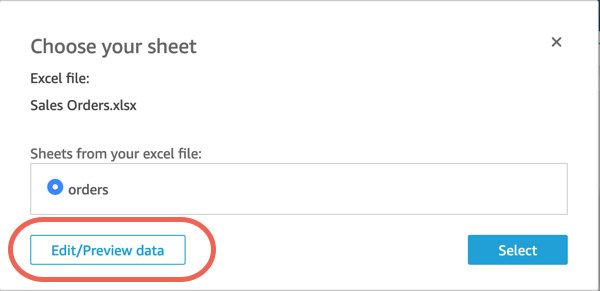
d. In the Choose your sheet dialog box, select orders and then choose Edit/Preview data.
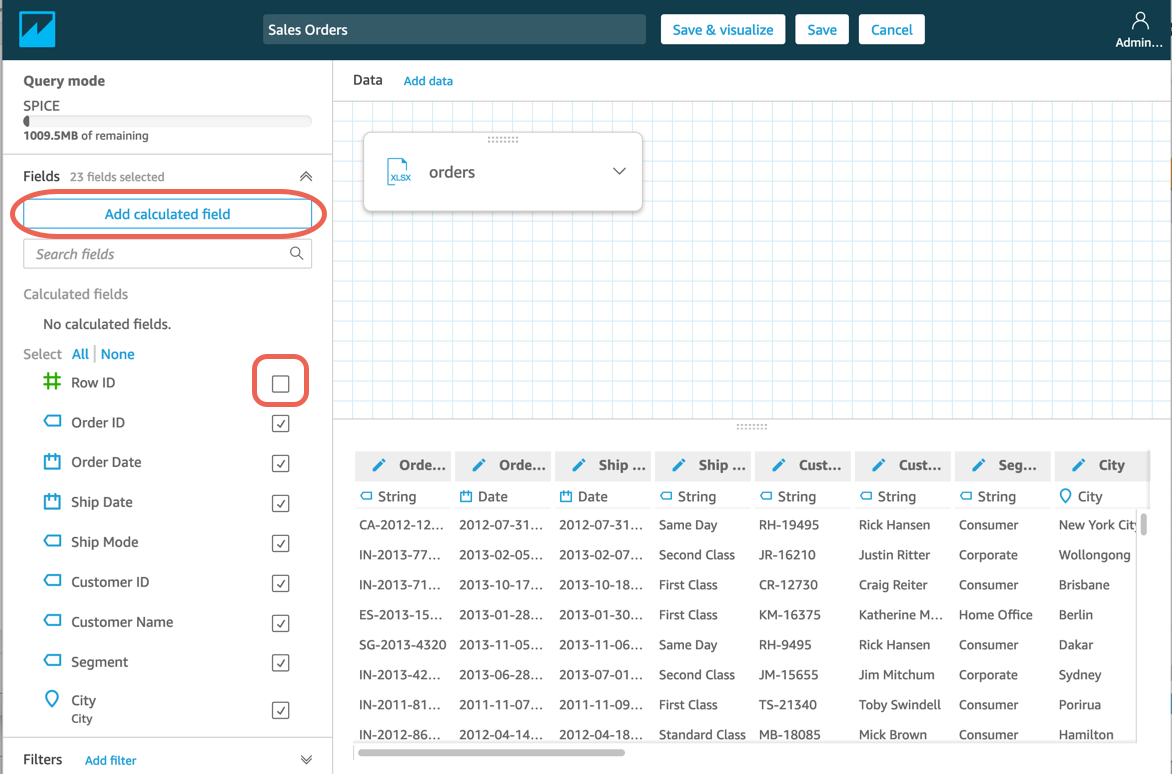
Step 4. Prepare the data
Now that you have uploaded your data set, you need to prepare the data so that it is ready for reports. Preparing the data can include standarizing field names, removing fields, or adding calculations.
Complete the following steps to prepare the data.
Note: For more information, see Editing a data set in the Amazon QuickSight documentation.
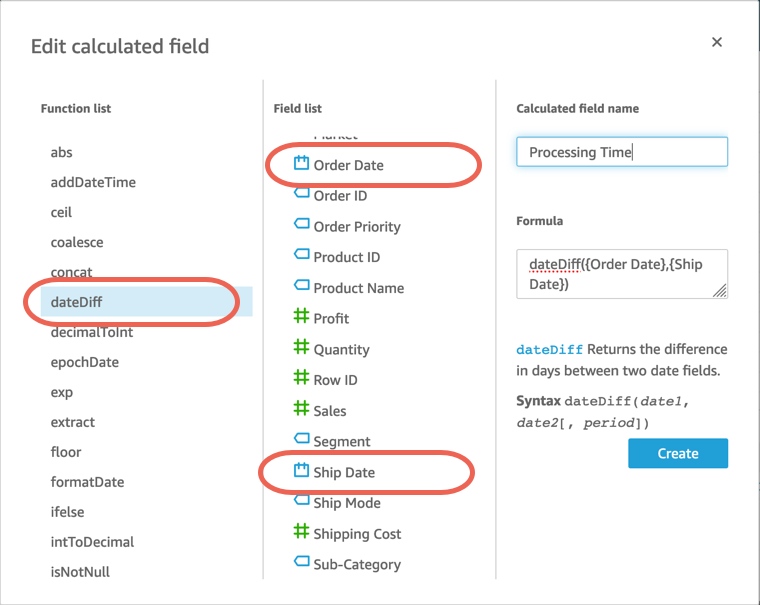
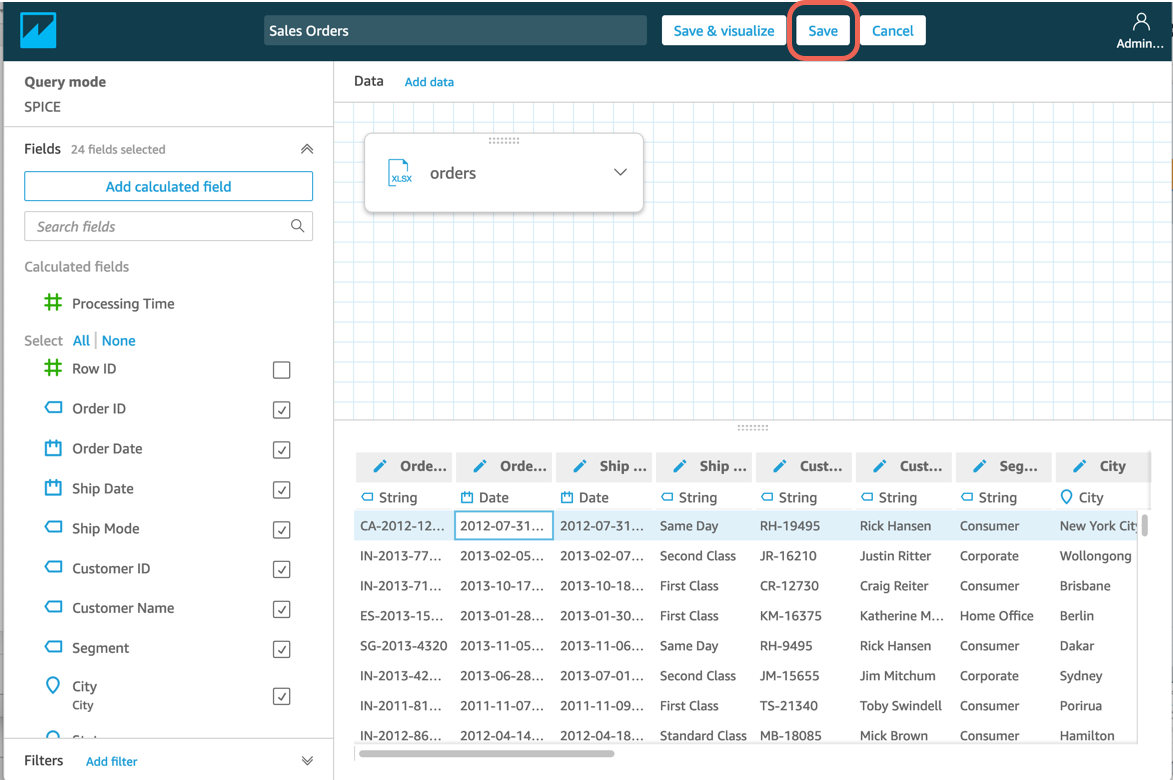
a. On the Edit/Preview data screen, clear the check box for Row ID. This removes the Row ID field from the data set. Then, choose Add calculated field.
b. In the Edit calculated field dialog, in the Functions list, choose dateDiff. Then, in the Field list, choose Order Date, type a comma, and choose Ship Date. Name the Calculated field Processing Time. The formula for your new calculated field should appear as dateDiff({OrderDate},{ShipDate}). Choose Create.
c. Choose Save.
Step 5. Create an analysis
Complete these steps to create a new analysis from your prepared Sales Orders data set.
Note: For more information, see the Working with Analyses in the Amazon QuickSight documentation.
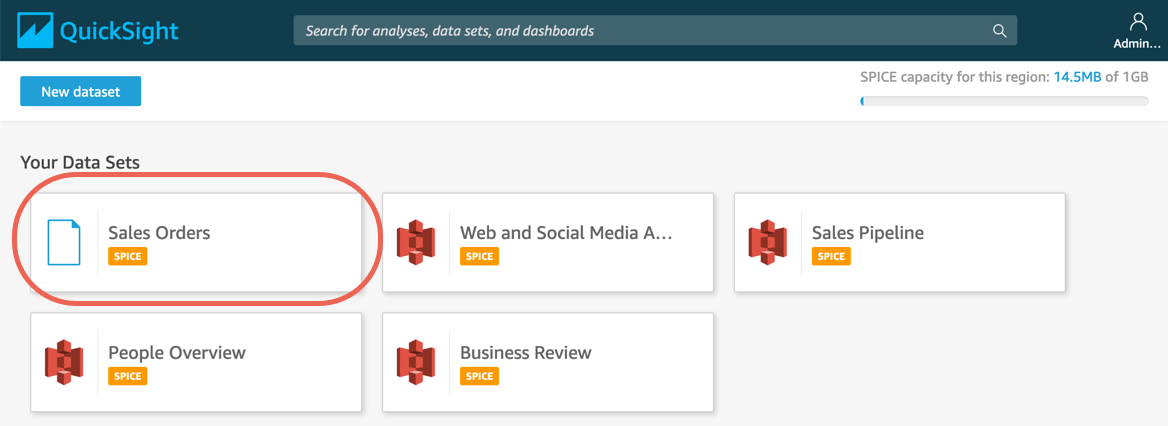
a. On the Your Data Sets dashboard, choose Sales Orders.
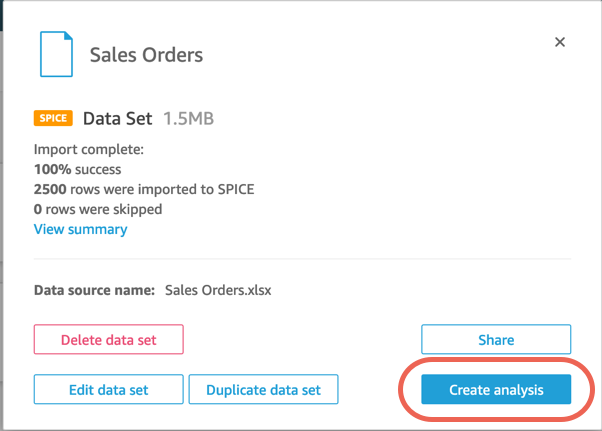
b. Choose Create analysis.
Step 6. Create a visual
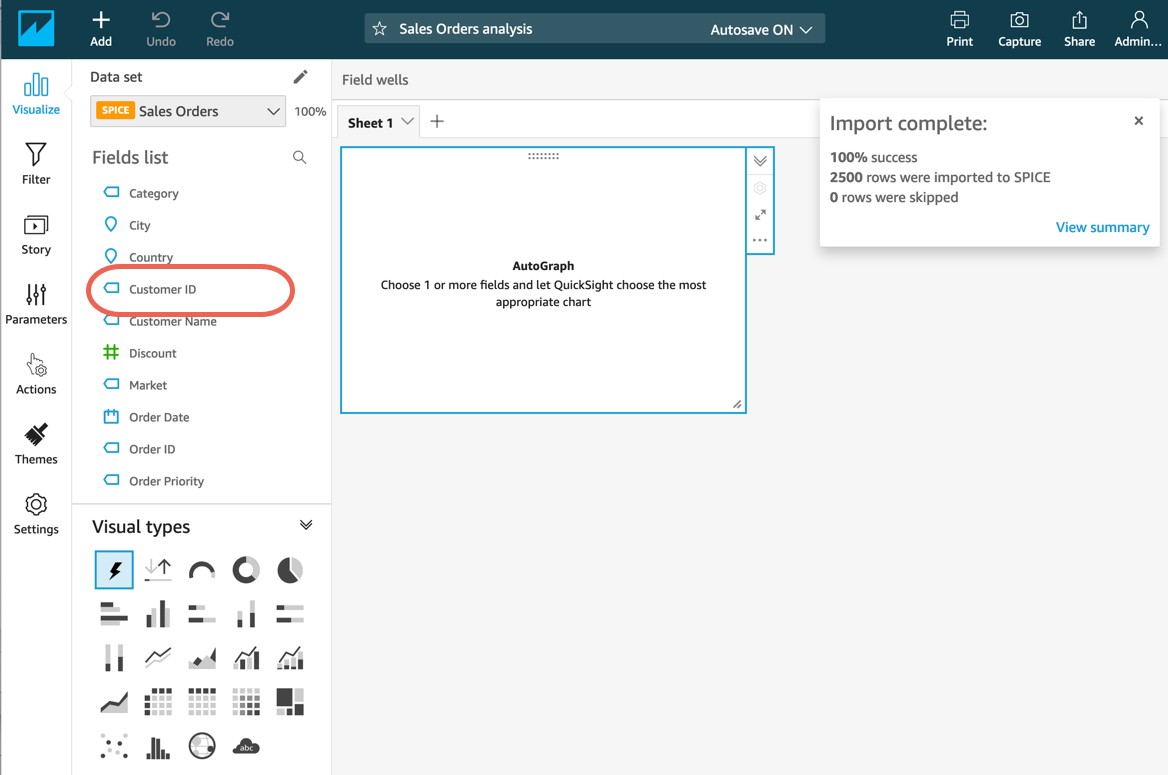
Follow these steps to create the first visual in the analysis. For this step, you use AutoGraph to dynamically create a visual based on the Customer ID field.
Note: For more information, see Creating an Amazon QuickSight Visual in the Amazon QuickSight documentation.
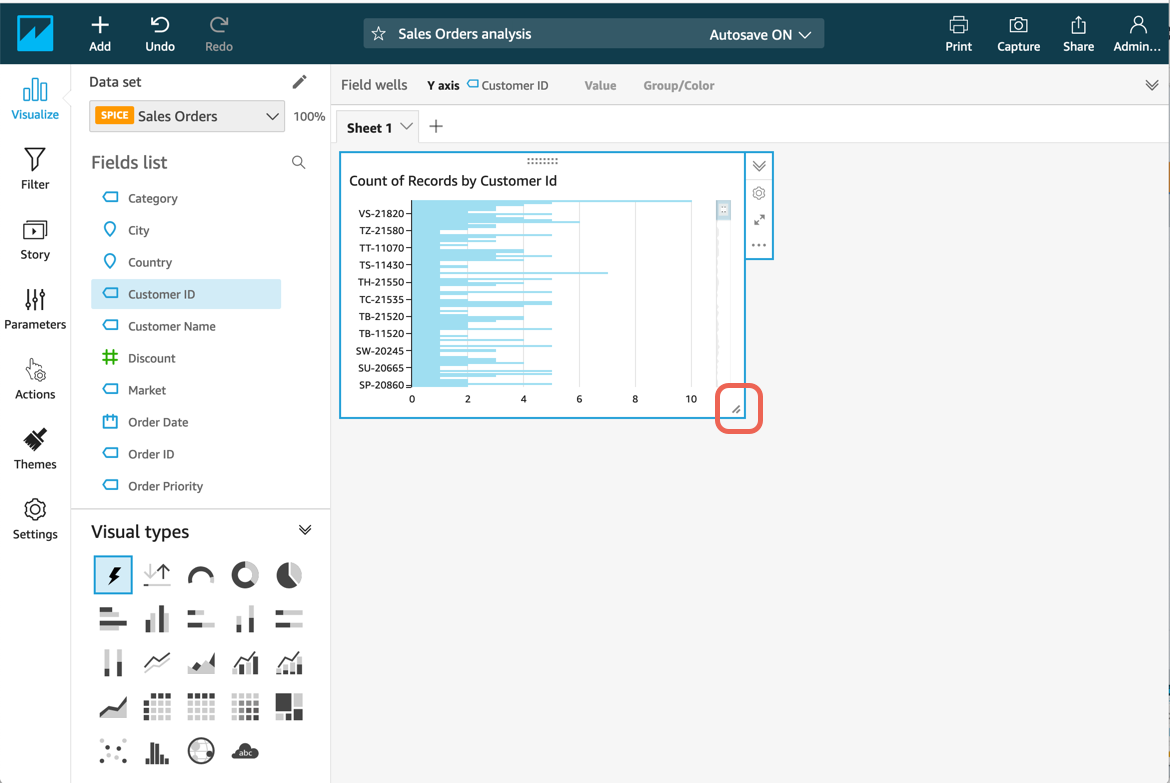
a. In the Fields list, choose Customer ID. The AutoGraph generates showing a Count of Records by Customer ID.
b. Click and drag the corner of the graph to resize the window.
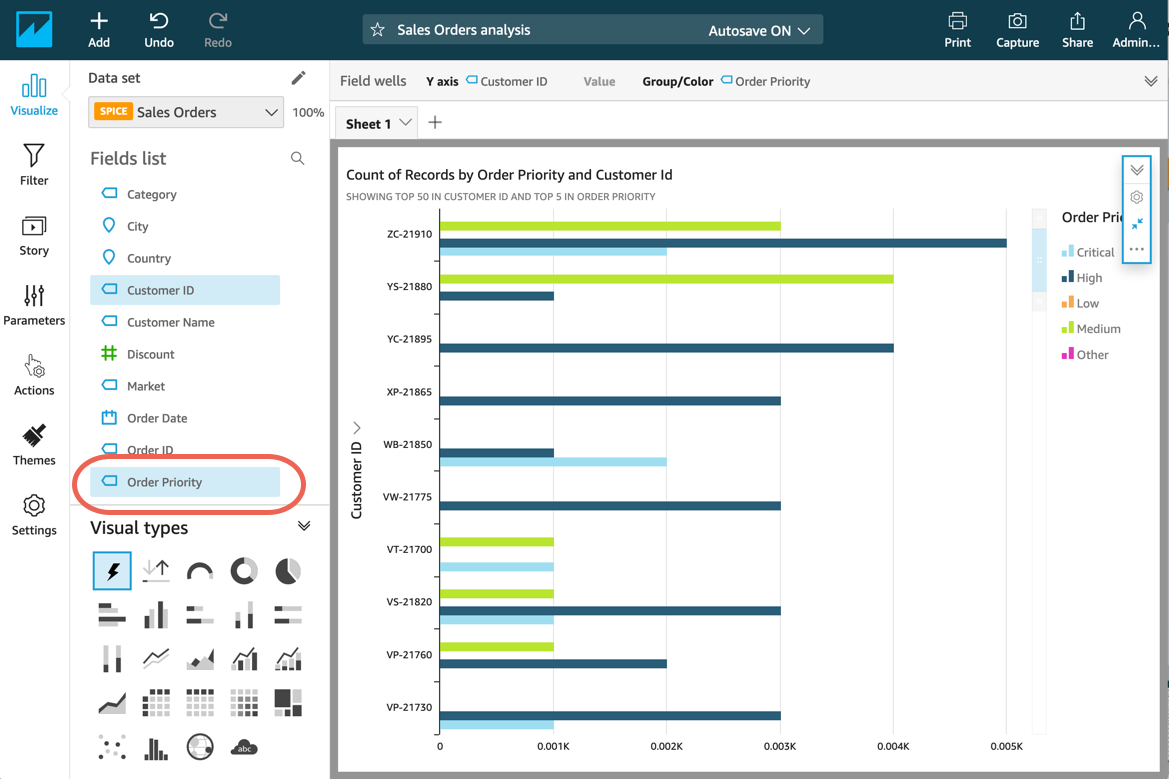
Step 7. Modify the visual
Now that you created your first visual, you can make changes to the visual, such as adding a filter or changing the visual type.
Follow these steps to make changes to the visual.
Note: For more information, see Working with Amazon QuickSight Visuals.
a. In the Fields list, choose Order Priority. Now, you have a count of records by priority placed by each customer.
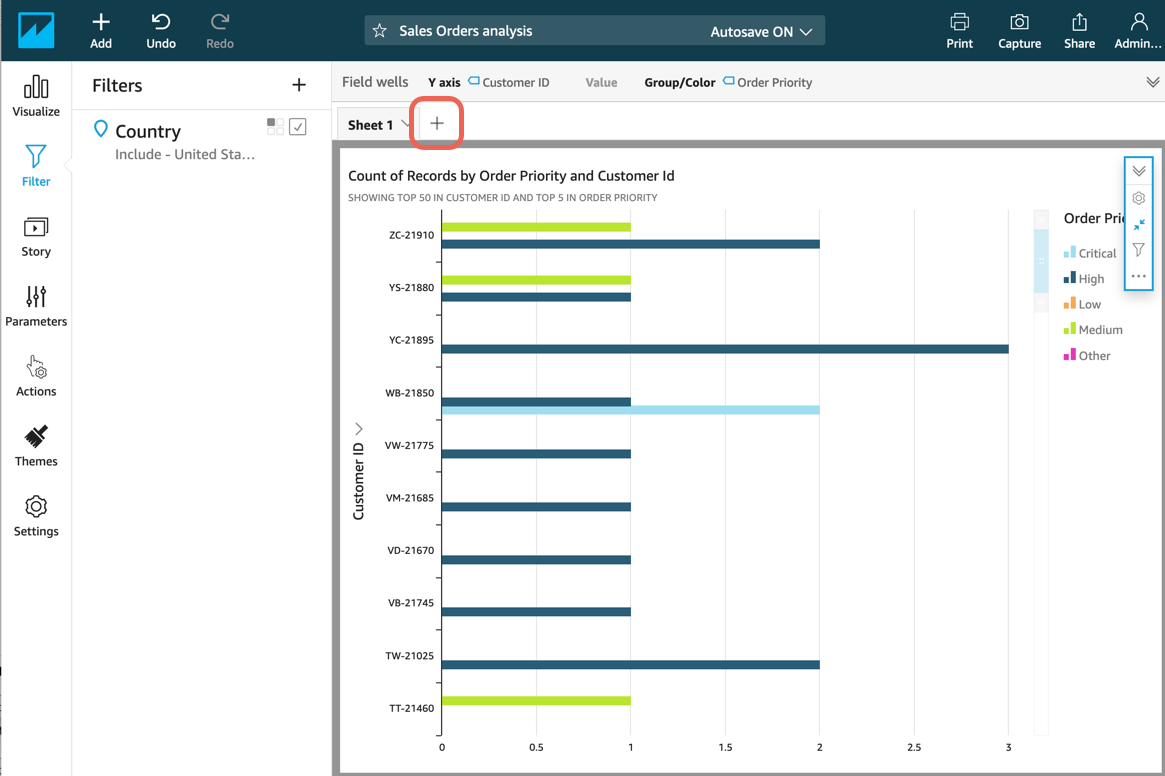
b. In the left menu bar, choose Filter, then choose Create one and select Country.
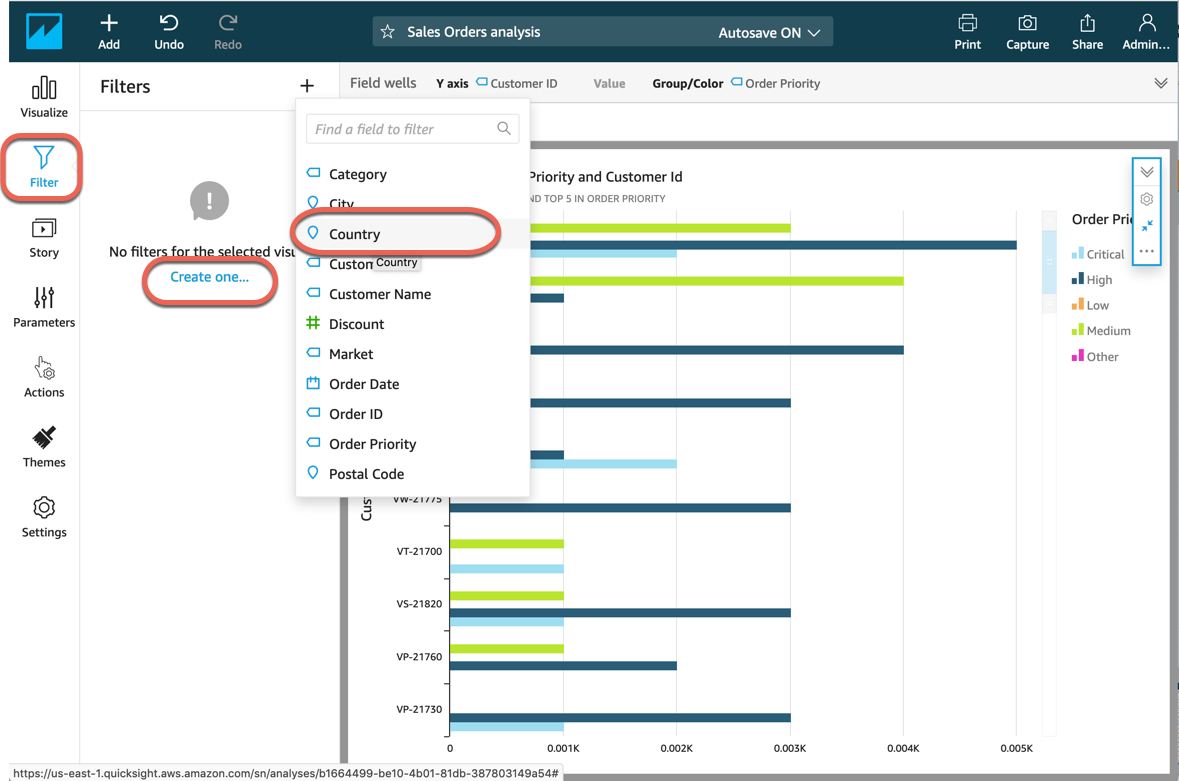
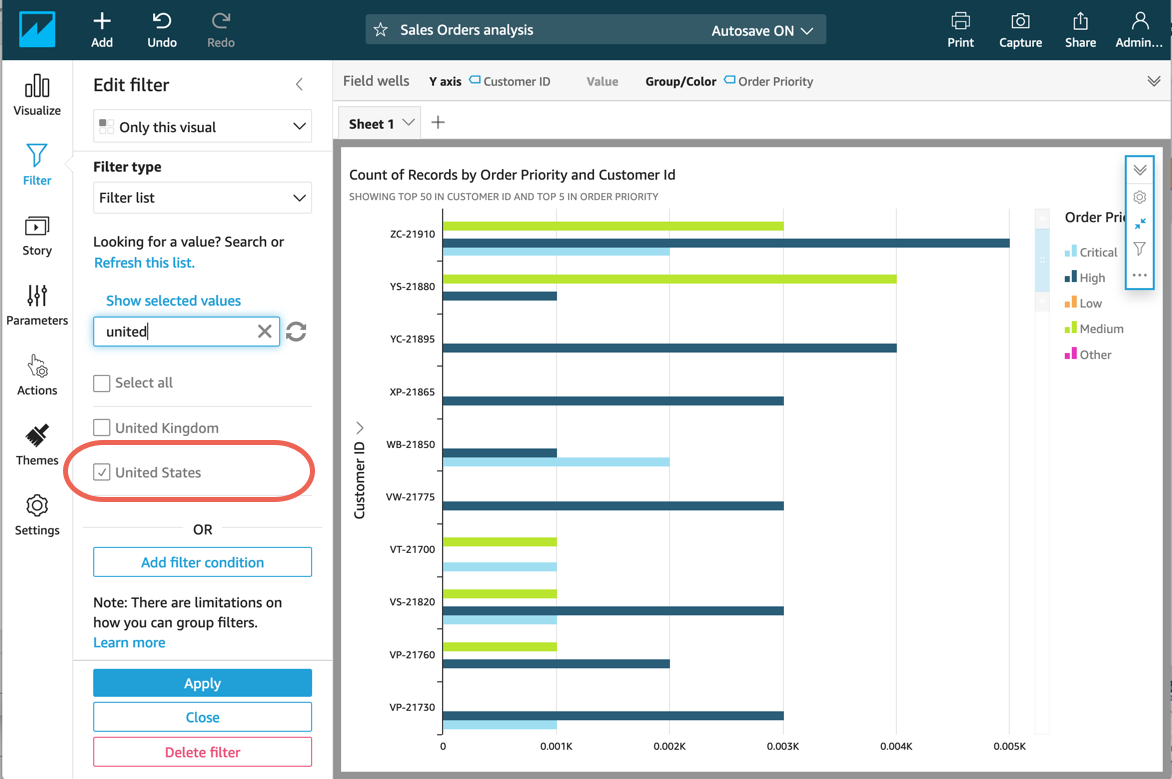
c. Select the Country filter to edit it. In the Edit filter dialog, select the check box for United States and choose Apply. Then, choose Close. Now, the count of records by priority and customer ID are displayed only for the United States.
Step 8. Add more visuals
Complete the following steps to add more visuals to your analysis. You can resize and arrange them in the workspace.
Note: For more information, see Working with Visuals in the Amazon QuickSight documentation.
a. Choose Add (+ icon) to create a new visual within the same analysis.
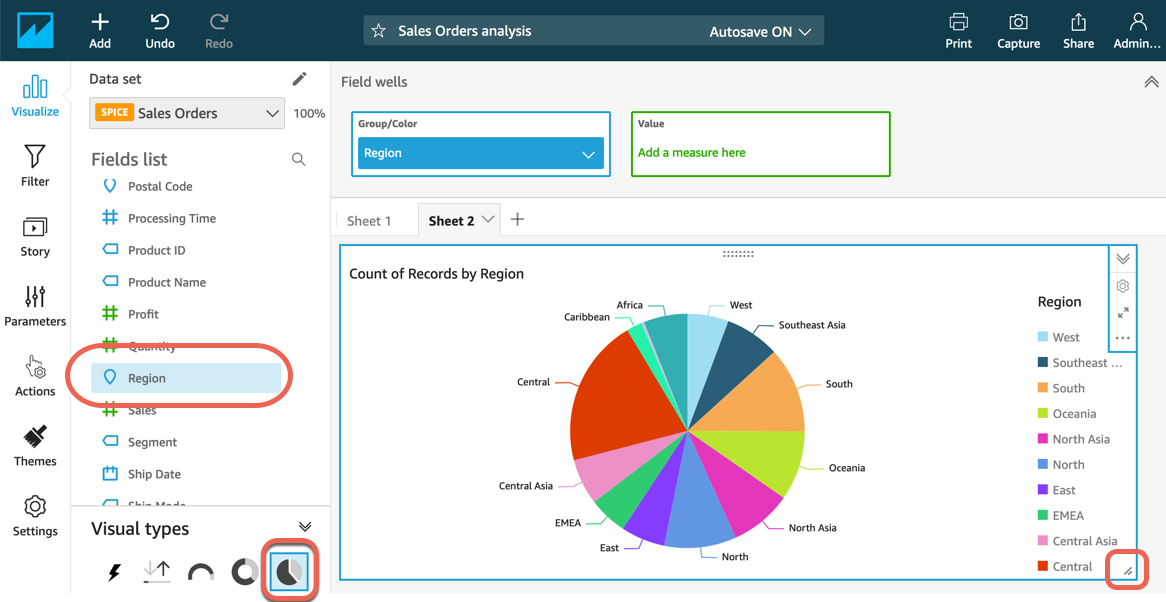
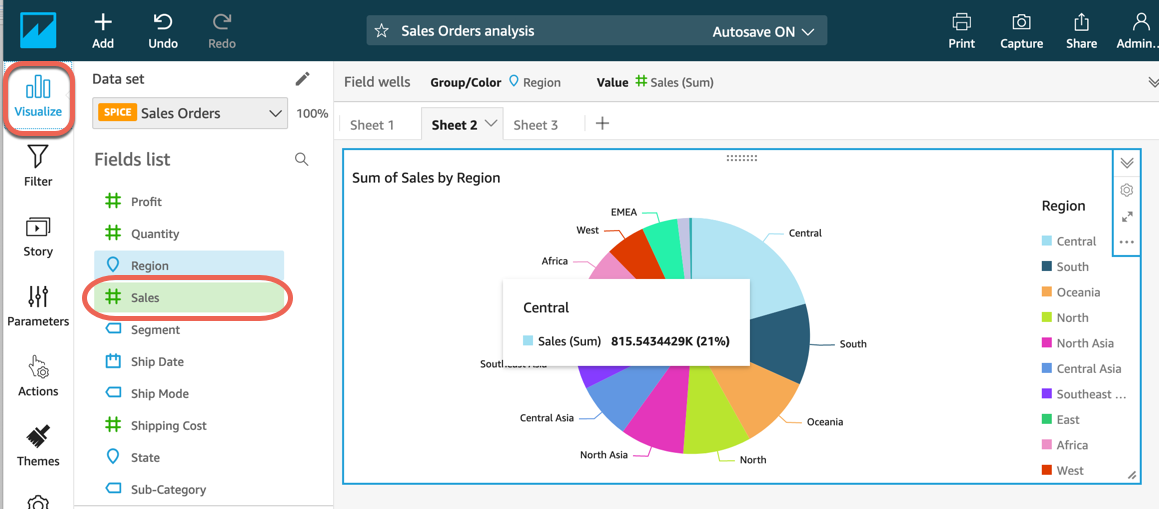
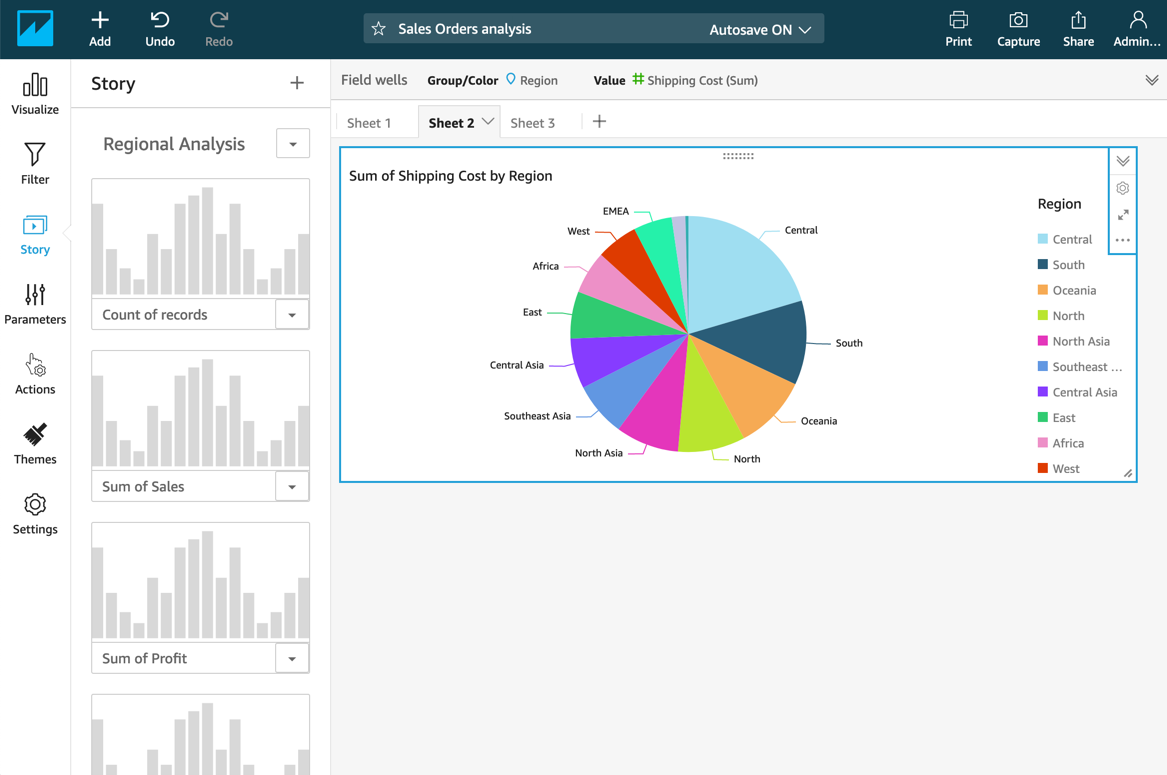
b. For Visual types, choose Pie chart, and in the Fields list, choose Region. Resize the workspace by selecting and dragging the bottom right corner.
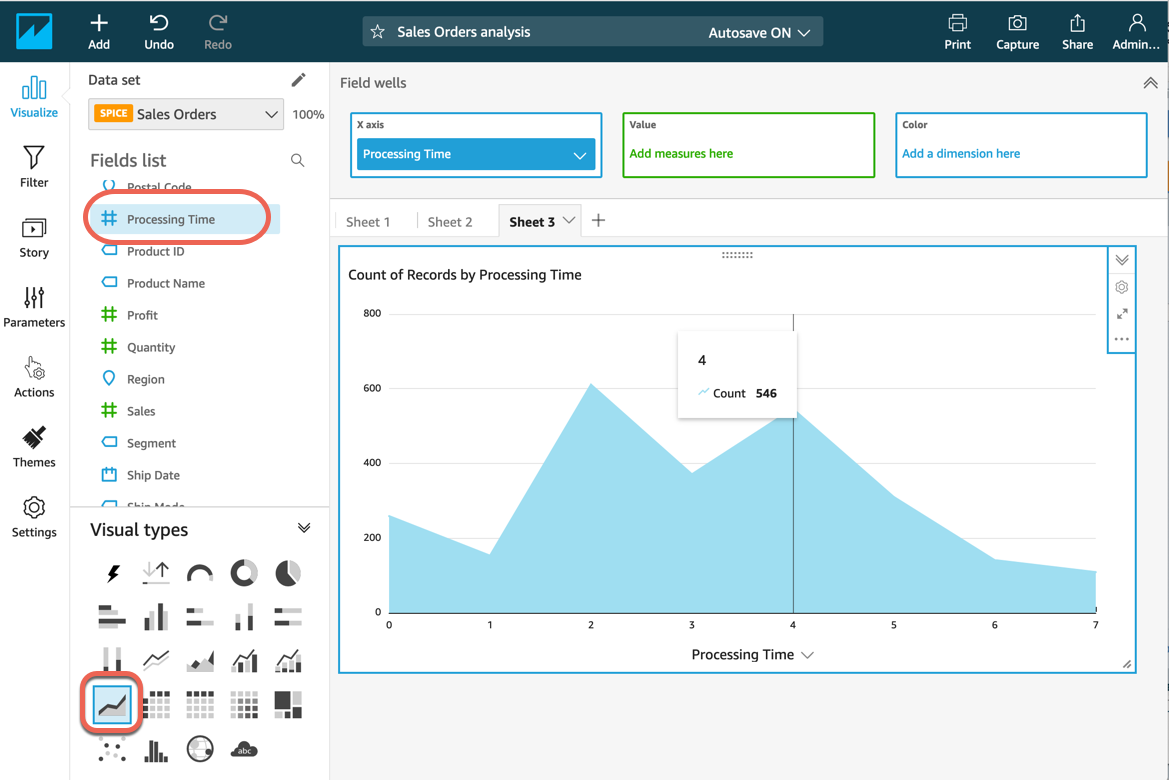
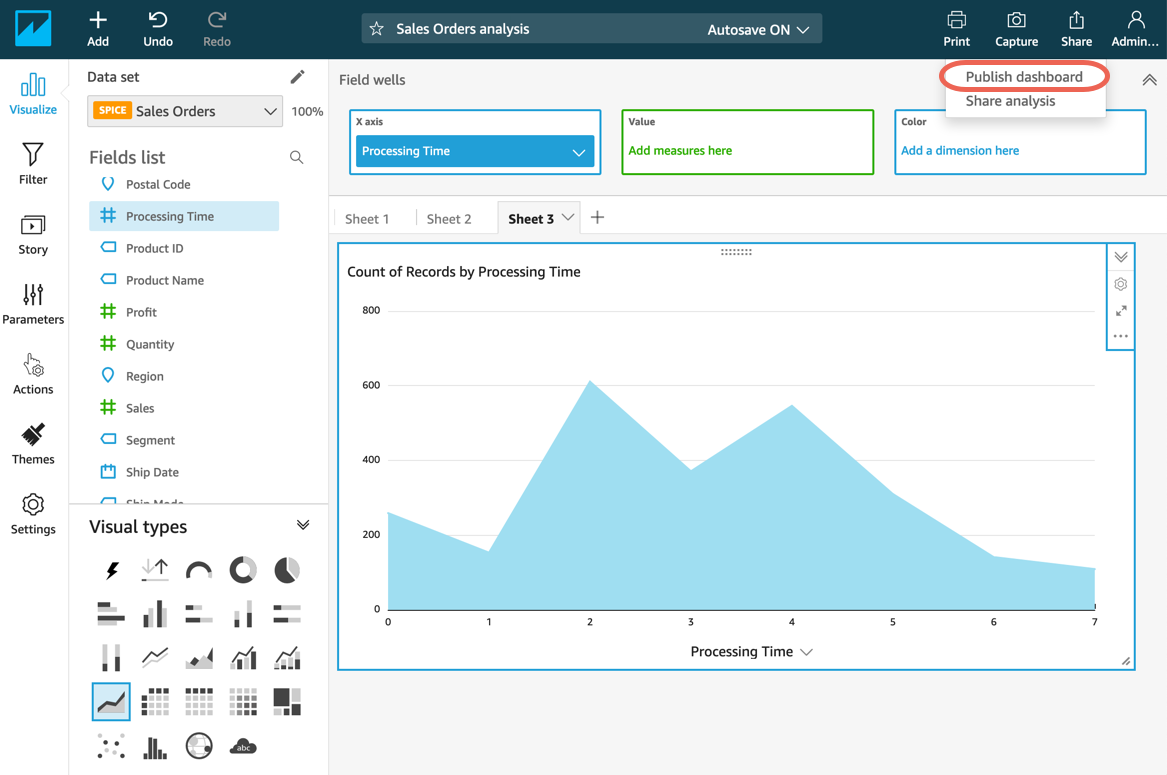
c. Choose Add (+ icon) to create a third visual. For Visual type, choose Stacked area line chart. In the Fields list, choose Processing Time. Resize the workspace by selecting and dragging the bottom right corner.
The chart shows 546 orders have a Processing Time of 4 days.
Step 9. Publish as a dashboard
Complete the following steps to publish the analysis as a dashboard. This step helps you to share insights with other users.
Note: For more information, see Working with Dashboards in the Amazon QuickSight documentation.
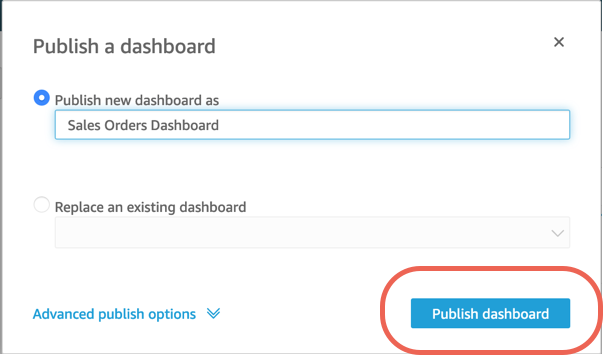
a. On the Sales Orders analysis workspace, choose Share, then choose Publish dashboard.
b. Give the dashboard a name and choose Publish dashboard. You will be prompted to share the dashboard with users, but for this tutorial, you can close the window without sharing.
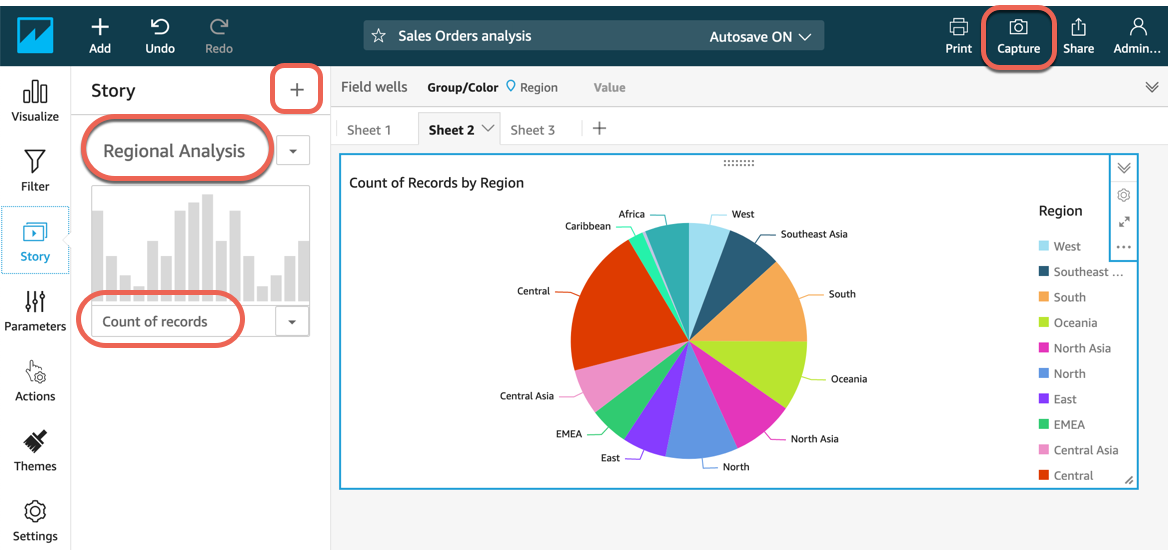
Step 10. Create a story
Complete the following steps to capture the Sales Order analysis into a story. A story creates a narrative about an aspect of the data analysis.
Note: For more information, see Working with Stories in the Amazon QuickSight documentation.
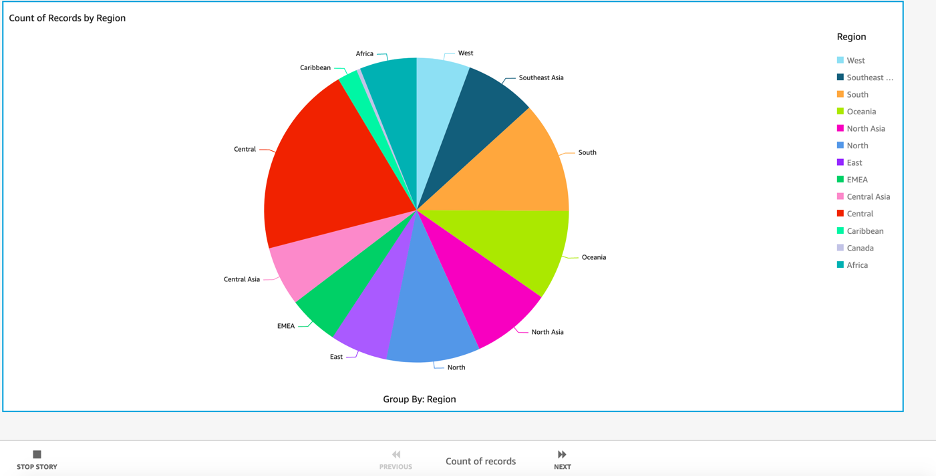
d. Choose the play icon to start playing the story from the desired scene. Use PREVIOUS and NEXT to navigate through scenes in the story.
Step 11. Clean up
In this step, you delete the resources you used in this lab.
Important: Deleting resources that are not actively being used reduces costs and is a best practice. Not deleting your resources will result in charges to your account.
a. Delete the dashboard: On the QuickSight home page, choose All dashboards. Choose the details icon (...) of the Sales Orders dashboard and choose Delete. When prompted to confirm, choose Delete.
b. Delete the analysis: Choose All analyses. Choose the details icon (...) of the Sales Orders analysis and choose Delete. When prompted to confirm, choose Delete.
c. Delete the data: Choose Manage data. Choose the Sales Orders data set and then choose Delete data set. When prompted to confirm, choose Delete.
d. Manage QuickSight usage and subscription: For information on the QuickSight trial, SPICE capacity, adding readers, or managing your subscription, see Managing Amazon QuickSight Usage. For information on pricing after the Amazon QuickSight 60-day trial, see Amazon QuickSight Pricing.
Congratulations
You created data analyses, visualized the data, created stories, and shared the analyses through data dashboards using Amazon QuickSight.
Recommended next steps
Explore Amazon QuickSight ML insights
Take a tour of Amazon QuickSight
Watch the Amazon QuickSight product demo videos.
Learn more about Amazon QuickSight
Learn more with Amazon QuickSight resources.