Listing Thumbnail

    PRTG Network Monitor Freeware

     Info
    Deployed on AWS
    AWS Free Tier
    PRTG monitors all the systems, devices, traffic, and applications in your IT infrastructure.

    Overview

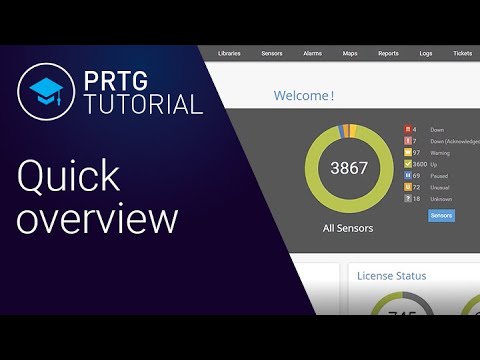
    Play video

    PRTG monitors all the systems, devices, traffic, and applications in your IT infrastructure. Everything is included, there is no need for additional plugins or downloads! PRTG is a powerful and easy-to-use solution, which is suitable for businesses of all sizes. Should you be interested in a PRTG Server hosted by Paessler, please find out more on https://www.paessler.com/prtg-hosted-monitor  .

    Highlights

    • "SNMP: ready-to-use and custom options WMI and Windows Performance Counters SSH: for Linux/Unix and macOS systems Traffic analysis using flow protocols or packet sniffing HTTP requests REST APIs returning XML or JSON Ping, SQL, and many more"
    • "Create dashboards with the PRTG map designer, and integrate all your network components using more than 300 different map objects such as device and status icons, traffic charts, top lists, and more. "
    • PRTG comes with many built-in mechanisms for notifications, such as email, push, or HTTP requests. With our free apps for Android and iOS, you can get push notifications delivered directly to your phone.

    Details

    Delivery method

    Delivery option
    64-bit (x86) Amazon Machine Image (AMI)

    Latest version

    Operating system
    Win2022 1809

    Deployed on AWS

    Unlock automation with AI agent solutions

    Fast-track AI initiatives with agents, tools, and solutions from AWS Partners.
    AI Agents

    Features and programs

    Buyer guide

    Gain valuable insights from real users who purchased this product, powered by PeerSpot.
    Buyer guide

    Financing for AWS Marketplace purchases

    AWS Marketplace now accepts line of credit payments through the PNC Vendor Finance program. This program is available to select AWS customers in the US, excluding NV, NC, ND, TN, & VT.
    Financing for AWS Marketplace purchases

    Pricing

    PRTG Network Monitor Freeware

     Info
    Pricing is based on actual usage, with charges varying according to how much you consume. Subscriptions have no end date and may be canceled any time.
    Additional AWS infrastructure costs may apply. Use the AWS Pricing Calculator  to estimate your infrastructure costs.

    Usage costs (12)

     Info
    Dimension
    Cost/hour
    t3.medium
    Recommended
    $0.00
    t3.micro
    AWS Free Tier
    $0.00
    m5.2xlarge
    $0.00
    t3.large
    $0.00
    t3.2xlarge
    $0.00
    m5.large
    $0.00
    m5.8xlarge
    $0.00
    t3.small
    $0.00
    t3.xlarge
    $0.00
    m5.4xlarge
    $0.00

    Vendor refund policy

    Please check our terms and conditions: https://www.paessler.com/terms-conditions 

    How can we make this page better?

    We'd like to hear your feedback and ideas on how to improve this page.
    We'd like to hear your feedback and ideas on how to improve this page.

    Legal

    Vendor terms and conditions

    Upon subscribing to this product, you must acknowledge and agree to the terms and conditions outlined in the vendor's End User License Agreement (EULA) .

    Content disclaimer

    Vendors are responsible for their product descriptions and other product content. AWS does not warrant that vendors' product descriptions or other product content are accurate, complete, reliable, current, or error-free.

    Usage information

     Info

    Delivery details

    64-bit (x86) Amazon Machine Image (AMI)

    Amazon Machine Image (AMI)

    An AMI is a virtual image that provides the information required to launch an instance. Amazon EC2 (Elastic Compute Cloud) instances are virtual servers on which you can run your applications and workloads, offering varying combinations of CPU, memory, storage, and networking resources. You can launch as many instances from as many different AMIs as you need.

    Additional details

    Usage instructions

    1. Launch the product via 1-click.
    2. Find the instance in the AWS console and copy the instance's public IP from the details there.
    3. Access the application via web browser with the public ip of your instance http://public_ip (NOTE: Has to be HTTP, not HTTPS; for setting up SSL please see https://www.paessler.com/manuals/prtg/using_your_own_ssl_certificate )
    4. Login using the username 'prtgadmin' and for the password use the the instance_id of the instance with a capital I at the beginning as the password. e.g. I-1234 instead of i-1234
    5. To receive notifications from PRTG, please change the email for the prtgadmin account by going to Setup - Account Settings - My Account (Optional)
    6. There you can also change the password for your PRTG installation if you'd like. (Optional)
    7. For all other directions about using your instance, please refer to our user manual https://www.paessler.com/manuals/prtg . There are also lots of videos on https://www.paessler.com/learn/videos  explaining several aspects of PRTG.

    Support

    AWS infrastructure support

    AWS Support is a one-on-one, fast-response support channel that is staffed 24x7x365 with experienced and technical support engineers. The service helps customers of all sizes and technical abilities to successfully utilize the products and features provided by Amazon Web Services.

    Similar products

    Customer reviews

    Ratings and reviews

     Info
    5
    1 ratings
    5 star
    4 star
    3 star
    2 star
    1 star
    100%
    0%
    0%
    0%
    0%
    1 AWS reviews
    |
    154 external reviews
    Star ratings include only reviews from verified AWS customers. External reviews can also include a star rating, but star ratings from external reviews are not averaged in with the AWS customer star ratings.
    Gowtham S.

    Best network monitoring tool

    Reviewed on Sep 01, 2025
    Review provided by G2
    What do you like best about the product?
    It is very helpful in monitoring our data in cloud and manages network traffics
    It greatly helps in improving performance of network
    it provide notification via messages or email as convenient which helps to understand issues and act accordingly anytime
    What do you dislike about the product?
    I believe the application is very costly for any startup companies
    It really requires skilled technicians, which increases in training cost
    It takes large amount of storage space for running its functionality
    What problems is the product solving and how is that benefiting you?
    It definitely helped in solving network and database monitoring issues and drastically improved network performance and speed
    They provide support in serval platforms
    it creates its own dashboards and represents it which helps us to understand the progress and also present it to management level
    Sujay G.

    "Powerful, Flexible, and User-Friendly Monitoring"

    Reviewed on Aug 29, 2025
    Review provided by G2
    What do you like best about the product?
    Easy to get started — auto-discovery made setup quick and I had monitoring running within a day.

    Alerts are accurate and reliable, I only get notified for real issues instead of endless false alarms.

    One tool covers almost everything: servers, switches, applications, and even custom scripts.

    Cost-effective, stable, and gives real-time visibility without adding unnecessary complexity.
    What do you dislike about the product?
    Desktop and mobile apps could use improvements in usability.

    Missing features like better syslog handling, deeper cloud integration, and easier automation.

    Licensing based on sensors can get expensive quickly since one server consumes multiple sensors.

    Support and roadmap updates could be more responsive.
    What problems is the product solving and how is that benefiting you?
    Helps identify server and network issues before they affect end users.

    Saves time by consolidating bandwidth, device, and application monitoring into one tool.

    Reliable alerts cut down on false positives, allowing me to focus on fixing real issues.

    Improves stability and reduces downtime by giving full visibility across the environment.
    KAKR J.

    PRTG Network Monitor — Practical, fast-to-deploy monitoring for small to mid-sized ops teams

    Reviewed on Aug 20, 2025
    Review provided by G2
    What do you like best about the product?
    1. Fast time‑to‑value: automatic discovery and a large library of preconfigured sensors let you start monitoring servers, switches, interfaces and common services in hours, not days.
    2. Clear, actionable visibility: intuitive dashboards, maps and dependable alerts make it easy for on‑call staff and NOC teams to spot and prioritize real issues at a glance.
    3. Friendly for small teams: the Windows installer and solid documentation kept our rollout smooth — we had meaningful monitoring running the same day without hiring extra staff.
    4. Reliable core functionality: uptime, bandwidth, CPU/memory and service checks are robust and help surface trends before they become incidents.
    What do you dislike about the product?
    1. Sensor‑based licensing: costs can climb quickly once you count interfaces, VMs and multiple service checks — plan your sensor estimate up front.
    2. Windows‑only core: the primary deployment is Windows-centric, which can limit multi‑platform collector strategies for cloud‑first or heterogeneous environments.
    3. Customization and integrations: building bespoke sensors, scripting and API workflows is more manual and less polished than some integration‑focused alternatives.
    4. UX gaps in editing: map/dashboard editing can feel dated (limited undo/copy‑paste and HTML-centric tweaks), which slows iterative refinement.
    What problems is the product solving and how is that benefiting you?
    1. Early detection and reduced downtime: PRTG gives reliable alerts on failing links, overloaded interfaces and resource spikes so we fix problems before users notice, lowering MTTR.
    2. Centralized operational visibility: it consolidates network and server health into a single pane, simplifying troubleshooting and daily ops for a small team.
    3. Practical NOC-ready displays: straightforward dashboards and maps let us present useful status views on TVs and shareable dashboards without heavy customization.
    4. Cost/scale trade-off clarity: for teams that want quick, dependable monitoring with minimal staffing, PRTG delivers strong ROI — but larger or highly integrated environments should validate sensor counts, hardware sizing and API needs through a short pilot.
    jreddy k.

    I used PRTG every day — reliable visibility and useful automation, just plan for growth

    Reviewed on Aug 20, 2025
    Review provided by G2
    What do you like best about the product?
    1. Fast to stand up: discovery gave me a working view of switches, firewalls and servers in under an hour — good for quick pilots.
    2. Clear visualizations: maps and dashboards made it easy to communicate status to ops and non-technical stakeholders during weekly reviews.
    3. Remote probes work: placing probes at regional sites kept polling local and kept our central server responsive over flaky WAN links.
    4. Practical automation: I built a small script PRTG can run to restart a hung service; that eliminated repeated manual fixes for a known issue.
    5. Useful historical data: daily/weekly reports and trends helped me validate ISP outages and plan capacity changes.
    What do you dislike about the product?
    1. Sensor-based licensing can surprise you — costs rose faster than expected when we added interface counters and flow sensors.
    2. The web UI can slow when many sensors or very complex dashboards are open at once; splitting dashboards helped but required extra setup.
    3. Deeply custom reports required exporting data and some scripting; built-in templates cover common needs but aren’t infinitely flexible.
    4. Mobile dashboards can feel sluggish loading large historic charts.
    What problems is the product solving and how is that benefiting you?
    1. One-pane troubleshooting: I stopped hopping between tools; interface and flow stats let me find congested links and correlate them to server spikes quickly.
    2. Reduced repetitive work: small automated actions handled common problems overnight, so the team could focus on higher-value incidents.
    3. Strong vendor evidence: historical reports provided clear proof of multi-hour ISP outages and helped get SLA credits.
    4. Fewer repetitive tickets: small automatic remediations handled common faults overnight, freeing our NOC to focus on higher-priority incidents.
    5. Clear evidence for vendors: scheduled reports and historical data helped me document outages and get faster responses from ISPs
    Prajwal H.

    Versatile Monitoring for Data Engineers: Not Just for Networks

    Reviewed on Aug 20, 2025
    Review provided by G2
    What do you like best about the product?
    As a data engineer, I use PRTG nearly every day to keep tabs on both our core infrastructure and data pipelines. Its interface is straightforward—with just a bit of setup, I was monitoring API performance, message queue depths, and resource usage across hybrid cloud and on-prem environments. PRTG’s breadth of built-in sensors plus the ability to add custom ones gives me a lot of flexibility to monitor exactly what matters for our ETL processes. Integrating PRTG data into our dashboards via its API and webhook support has made our troubleshooting much faster, especially when we need to correlate issues across different systems.
    What do you dislike about the product?
    Implementation was smooth for IT basics, but custom data pipeline monitoring required more scripting knowledge and the documentation for advanced sensors could be clearer for non-ops users. While customer support is responsive, some of our issues (like setting up custom alerts for data workflow failures) have needed multiple follow-ups. Exporting long-term logs into our analytics platform is more manual than I’d hoped. Also, direct integrations with popular modern data tools are limited, so frequent customization is part of the routine.
    What problems is the product solving and how is that benefiting you?
    PRTG helps us monitor the health and performance of both our core infrastructure and our data pipelines. By setting up custom sensors, we can track queue depths, API uptime, database servers, and ETL bottlenecks all in one dashboard. This central view lets us catch and resolve issues before they disrupt business-critical data flows, saving troubleshooting time and improving uptime.
    View all reviews