
Sold by: digitalis.io
Deployed on AWS
Free Trial
AWS Free Tier
Digitalis.IO Monitoring Stack is a complete production-ready observability solution for cloud environments. It deploys Grafana, Prometheus, Loki, Tempo, Mimir, and Alertmanager with minimal effort on AWS, Hetzner Cloud, or Exoscale. Designed for simplicity and scalability, it enables real-time monitoring of metrics, logs, and traces, along with intelligent alerting and long-term storage. The stack can be launched in minutes using AWS CloudFormation or Terraform, making it ideal for both quick tests and enterprise-grade deployments. With integrated dashboards, distributed tracing, and log aggregation, this solution helps teams achieve full visibility into their infrastructure and applications.
Overview
Image
Monitoring Stack
Video
Product video
Digitalis.IO Monitoring Stack delivers a comprehensive observability platform that combines best-in-class open-source tools into a single, production-ready solution. It includes Grafana for interactive dashboards, Prometheus for metrics collection, Loki for log aggregation, Tempo for distributed tracing, Mimir for long-term metric storage, and Alertmanager for intelligent alert routing. This stack is designed to simplify monitoring across diverse environments, providing deep visibility into applications, infrastructure, and services. Deployment is fast and flexible. Users can launch the stack on AWS using CloudFormation for a quick, no-code experience or leverage Terraform for full infrastructure-as-code control. The solution supports auto-scaling, high availability, and integration with AWS services such as CloudWatch and S3 for secure, long-term data retention. For multi-cloud strategies, it also offers deployment options for Hetzner Cloud and Exoscale, ensuring cost-effective and privacy-focused alternatives. Once deployed, the stack provides a centralized hub for metrics, logs, and traces. Grafana dashboards allow teams to visualize performance trends, troubleshoot issues, and create actionable alerts. Prometheus scrapes application and infrastructure metrics, while Loki aggregates logs efficiently for fast querying. Tempo enables distributed tracing to analyze request flows across microservices, and Mimir ensures virtually unlimited retention for historical data. Alertmanager intelligently routes notifications to channels like Slack, PagerDuty, or email, reducing alert fatigue and improving incident response. The monitoring stack is ideal for a wide range of use cases, including Kubernetes cluster monitoring, application performance analysis, centralized log management, and infrastructure health checks. It supports OpenTelemetry for trace instrumentation and integrates seamlessly with existing observability workflows. Security best practices are built in, including TLS support, IAM role integration, and network access restrictions. Digitalis.IO specializes in cloud infrastructure, DevOps automation, and observability solutions. This monitoring stack reflects our commitment to helping organizations deploy modern, cloud-native applications with confidence. Whether you need a quick test environment or a robust enterprise-grade setup, Digitalis.IO Monitoring Stack offers the flexibility, scalability, and reliability required dynamic cloud ecosystems.
Highlights
- Deploy a complete observability stack in minutes with Grafana, Prometheus, Loki, Tempo, Mimir, and Alertmanager. Gain full visibility into metrics, logs, and traces while enabling intelligent alerting and long-term storage. Designed for simplicity and scalability, this solution works seamlessly on AWS and other cloud platforms.
- Choose between quick CloudFormation deployment or full Terraform control for infrastructure-as-code. The stack supports auto-scaling, high availability, and integration with AWS services like CloudWatch and S3, making it ideal for both rapid testing and enterprise-grade monitoring environments.
- Centralize monitoring for Kubernetes clusters, applications, and infrastructure with pre-integrated dashboards and OpenTelemetry support. Visualize performance trends, troubleshoot issues, and route alerts to Slack, PagerDuty, or email, ensuring faster incident response and improved operational reliability.
Details
Sold by
Categories
Delivery method
Delivery option
64-bit (x86) Amazon Machine Image (AMI)
Latest version
Operating system
Debian 13
Deployed on AWS
New
Introducing multi-product solutions
You can now purchase comprehensive solutions tailored to use cases and industries.

Features and programs
Financing for AWS Marketplace purchases
AWS Marketplace now accepts line of credit payments through the PNC Vendor Finance program. This program is available to select AWS customers in the US, excluding NV, NC, ND, TN, & VT.

Pricing
Free trial
Try this product free for 5 days according to the free trial terms set by the vendor. Usage-based pricing is in effect for usage beyond the free trial terms. Your free trial gets automatically converted to a paid subscription when the trial ends, but may be canceled any time before that.
Pricing is based on actual usage, with charges varying according to how much you consume. Subscriptions have no end date and may be canceled any time.
Additional AWS infrastructure costs may apply. Use the AWS Pricing Calculator to estimate your infrastructure costs.
If you are an AWS Free Tier customer with a free plan, you are eligible to subscribe to this offer. You can use free credits to cover the cost of eligible AWS infrastructure. See AWS Free Tier for more details. If you created an AWS account before July 15th, 2025, and qualify for the Legacy AWS Free Tier, Amazon EC2 charges for Micro instances are free for up to 750 hours per month. See Legacy AWS Free Tier for more details.
Dimension | Cost/hour |
|---|---|
t3.large Recommended | $0.02 |
t2.micro | $0.02 |
t3.micro | $0.02 |
r5d.24xlarge | $0.02 |
r5b.xlarge | $0.02 |
r7i.16xlarge | $0.02 |
i4i.32xlarge | $0.02 |
r8i.48xlarge | $0.02 |
m7i.xlarge | $0.02 |
g2.2xlarge | $0.02 |
Vendor refund policy
Refunds are evaluated on a case by case basis. Please contact our support team with your request, including your AWS account ID and product details. Refunds will be processed promptly upon approval, typically within 5 business days. Annual subscription cancellations may be allowed according to terms. Refund requests must be directed to the seller.

Legal
Vendor terms and conditions
Upon subscribing to this product, you must acknowledge and agree to the terms and conditions outlined in the vendor's End User License Agreement (EULA) .
Content disclaimer
Vendors are responsible for their product descriptions and other product content. AWS does not warrant that vendors' product descriptions or other product content are accurate, complete, reliable, current, or error-free.
Delivery details
64-bit (x86) Amazon Machine Image (AMI)
Amazon Machine Image (AMI)
An AMI is a virtual image that provides the information required to launch an instance. Amazon EC2 (Elastic Compute Cloud) instances are virtual servers on which you can run your applications and workloads, offering varying combinations of CPU, memory, storage, and networking resources. You can launch as many instances from as many different AMIs as you need.
Version release notes
Alloy: v1.16.1 Grafana: v13.0.1-security-01 Loki: v3.7.2 Mimir: v3.0.3 Prometheus: v3.11.3 Tempo: v2.10.5
Adds security fixes and mitigations:
CVE-2026-31431 (Copy Fail) -> algif_aead CVE-2026-43284 / CVE-2026-46300 -> esp4, esp6 (Dirty Frag / Fragnesia) CVE-2026-43500 -> rxrpc (Dirty Frag)
Additional details
Usage instructions
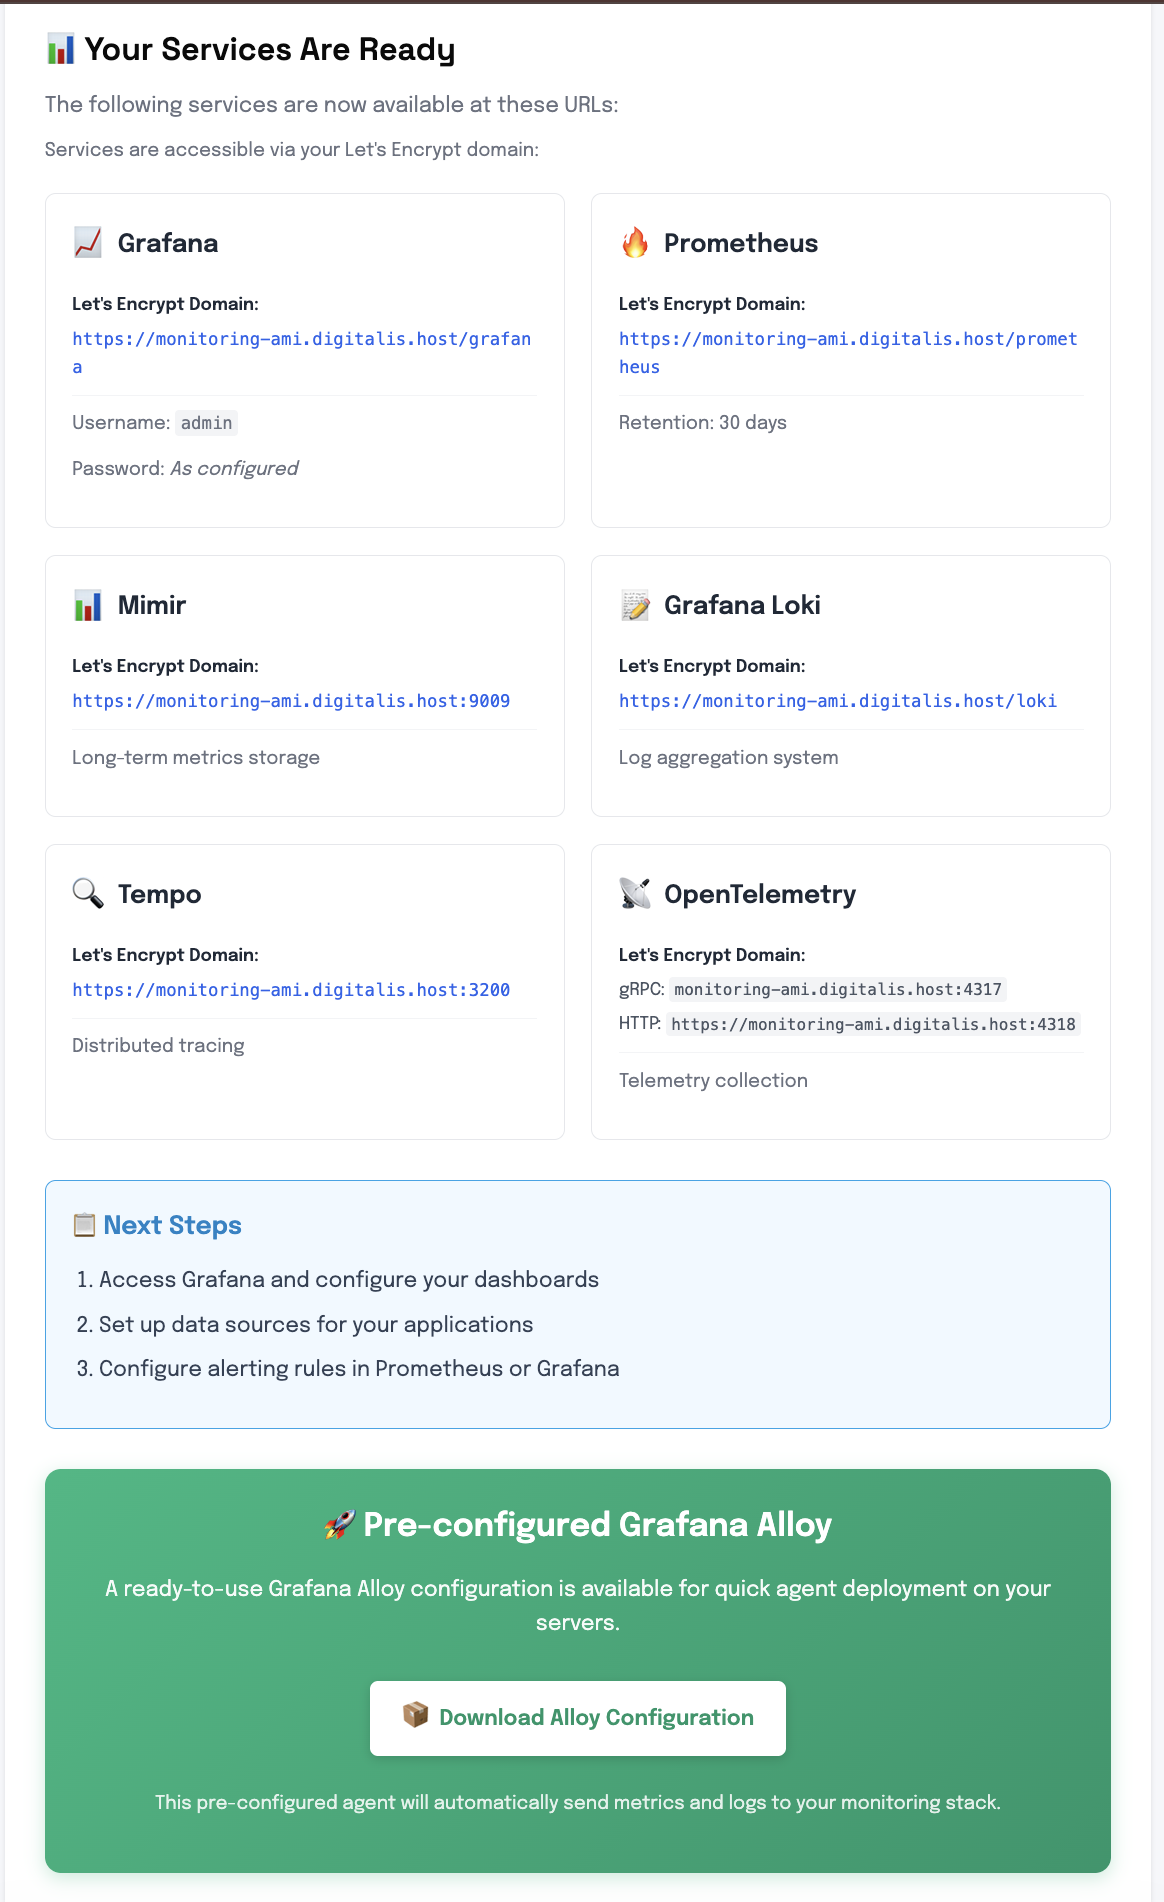
Launch the EC2 instance and browse to the wizard to perform the initial configuration at https://<instance-ip>:9443. It is highly recommended to deploy this AMI using Terraform or Cloudformation. See full instructions in the link below.
Resources
Vendor resources
Support
Vendor support
AWS infrastructure support
AWS Support is a one-on-one, fast-response support channel that is staffed 24x7x365 with experienced and technical support engineers. The service helps customers of all sizes and technical abilities to successfully utilize the products and features provided by Amazon Web Services.
Similar products

Digitalis.IO Monitoring Stack is a complete production-ready observability solution for cloud environments. It deploys Grafana, Prometheus, Loki, Tempo, Mimir, and Alertmanager with minimal effort on AWS, Hetzner Cloud, or Exoscale. Designed for simplicity and scalability, it enables real-time monitoring of metrics, logs, and traces, along with intelligent alerting and long-term storage. The stack can be launched in minutes using AWS CloudFormation or Terraform, making it ideal for both quick tests and enterprise-grade deployments. With integrated dashboards, distributed tracing, and log aggregation, this solution helps teams achieve full visibility into their infrastructure and applications.

VM pre-loaded with everything a developer needs: Headlamp UI for easy cluster management, ArgoCD for GitOps, VS Code Server for in-browser coding, and essential databases. Deploy, code, and manage your apps instantly. Ready to code in minutes.

VM pre-loaded with everything a developer needs: Headlamp UI for easy cluster management, ArgoCD for GitOps, VS Code Server for in-browser coding, and essential databases. Deploy, code, and manage your apps instantly. Ready to code in minutes.

PCI Compliant Hardened Ubuntu 24.04 is a security enhanced server image built by Digitalis.IO's DevOps and Security engineers. Designed for banking and financial environments, it follows strict PCI guidelines and industry best practices to provide a hardened, production ready Ubuntu foundation with minimized attack surface and reinforced system integrity.
Customer reviews
No customer reviews yet
Be the first to review this product . We've partnered with PeerSpot to gather customer feedback. You can share your experience by writing or recording a review, or scheduling a call with a PeerSpot analyst.