
Sold by: TrackIt
Deployed on AWS
AWS Free Tier
Visualize CloudFront traffic, cache performance, and WAF security in a pre-built Grafana dashboard. Fully serverless with no infrastructure to manage. Optionally includes WAF threat analysis and video metadata extraction.
Overview
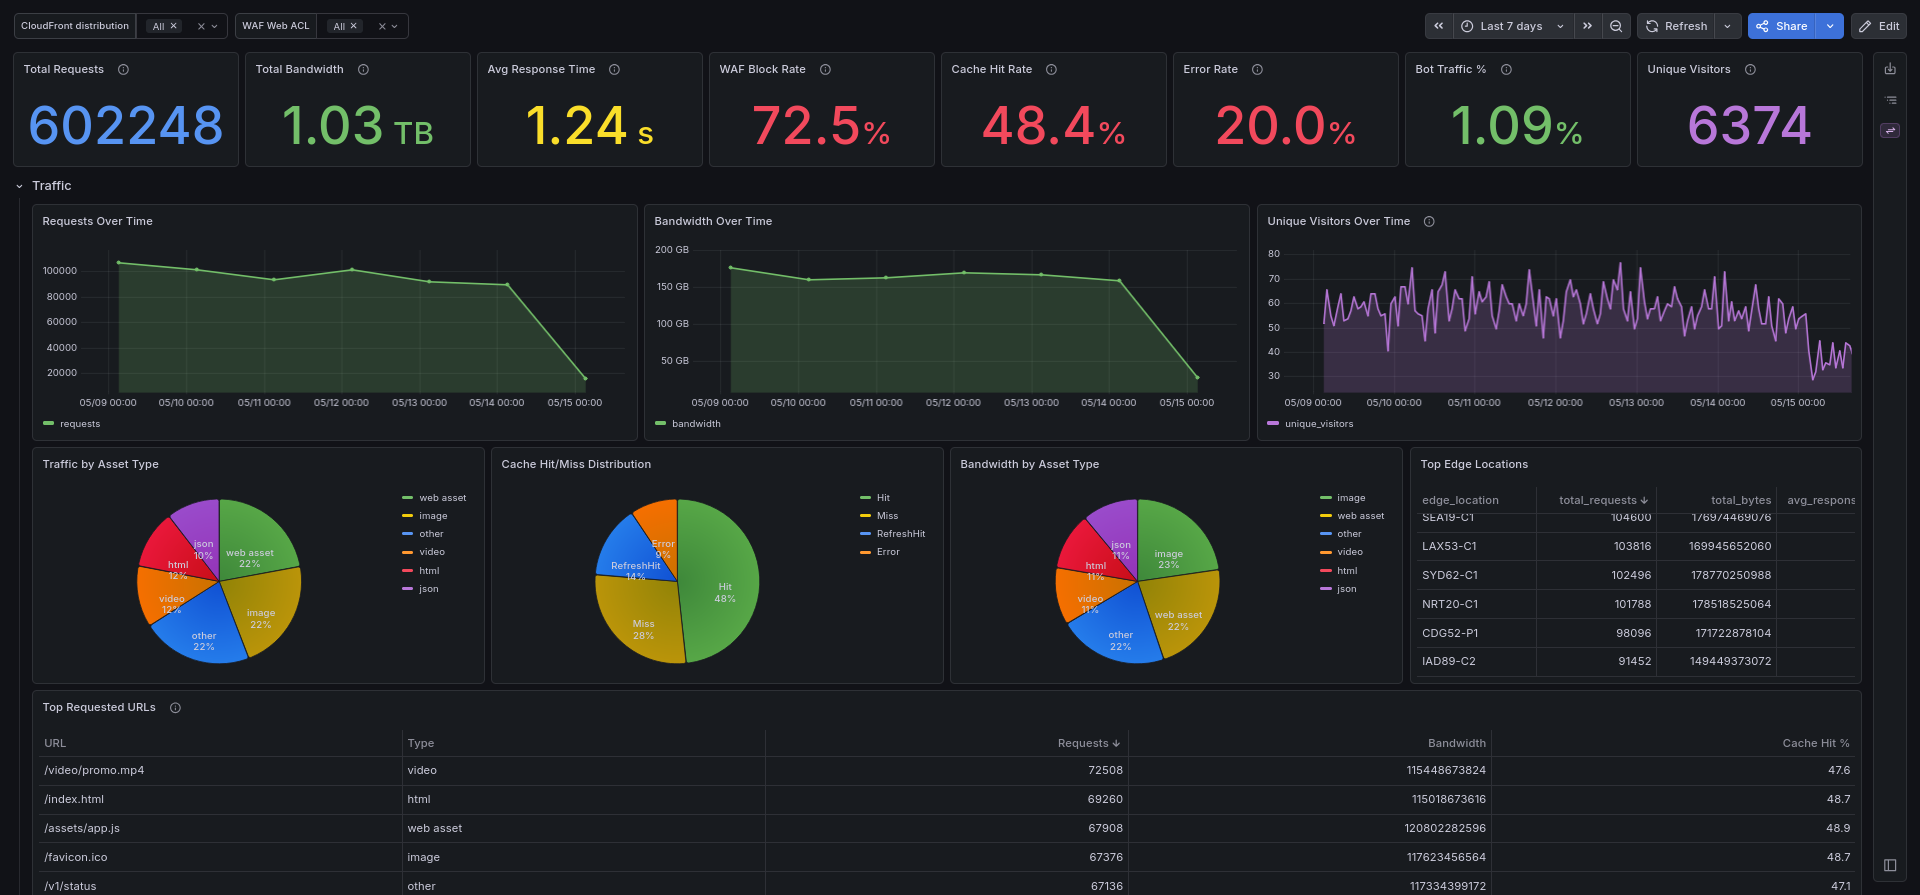
Image
Overview
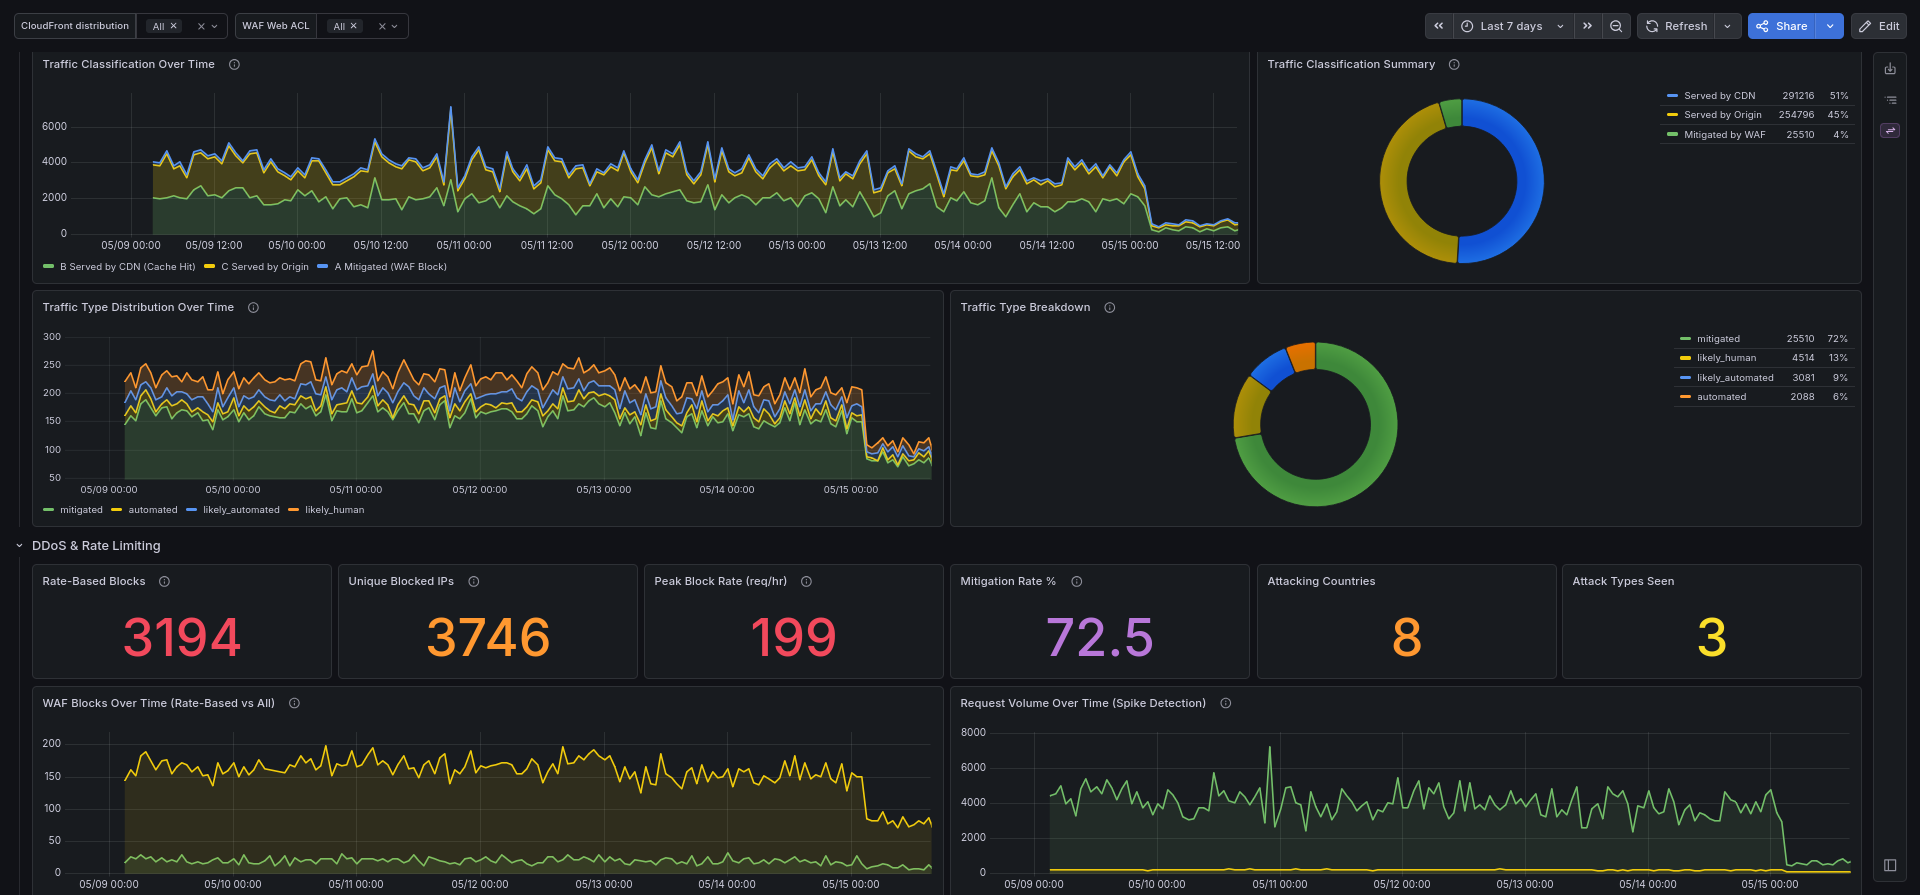
Image
Traffic
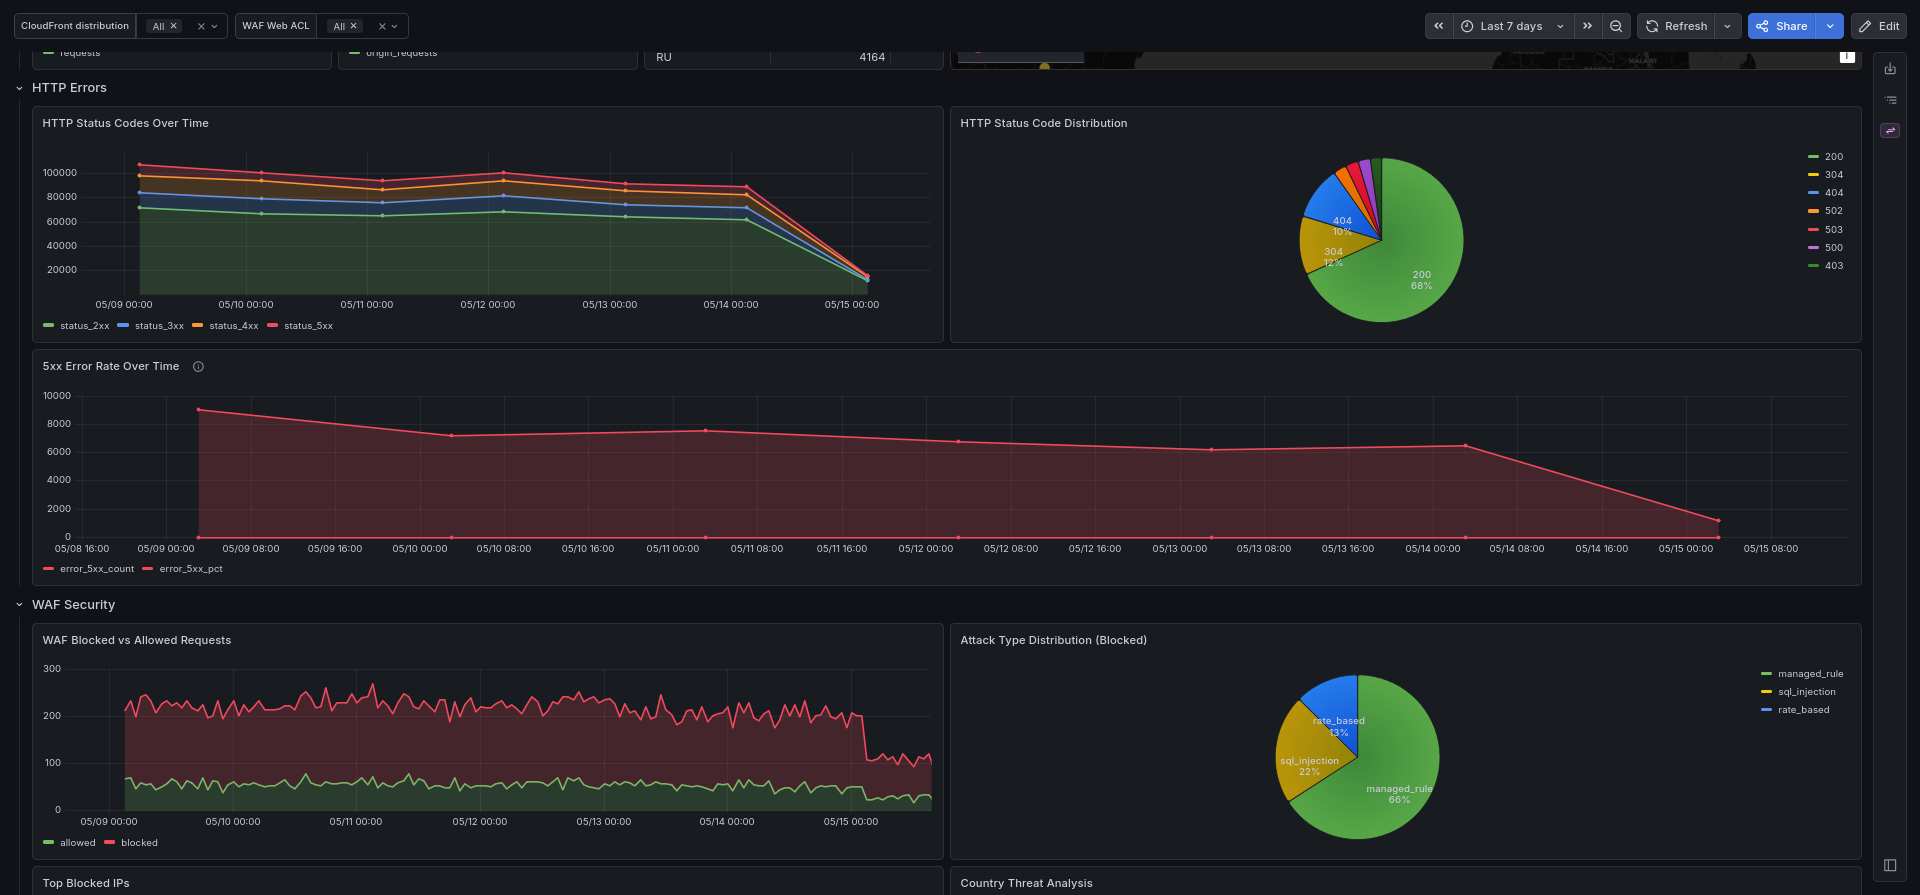
Image
Http Errors
CloudFront Log Analytics Dashboard provides a complete, production-ready analytics solution for Amazon CloudFront distributions and AWS WAF. It deploys a pre-built Grafana dashboard backed by a fully serverless ETL pipeline using AWS Glue, Amazon Athena, and AWS Step Functions with no infrastructure to manage and no servers to maintain.
The dashboard covers traffic analytics (requests, bandwidth, cache hit rate, response times, error rates, edge location breakdown), WAF security (blocked requests, attack types, top offenders, bot detection, TLS fingerprint analysis, DDoS and rate limit insights), and traffic classification with a Cloudflare-style breakdown of mitigated, automated, and human traffic. Multi-distribution and multi-WAF support lets you filter by CloudFront distribution or Web ACL. HTTP method anomaly detection helps spot unusual POST or PUT spikes that may indicate attacks. ASN tracking identifies abusive networks and hosting providers. Video metadata extraction via MediaInfo (resolution, bitrate, duration) is available as an optional feature.
The pipeline runs hourly with incremental processing via Glue job bookmarks, keeping data fresh at minimal cost. Partitions are managed automatically via Athena Partition Projection, no crawlers, no maintenance. This product requires an internet connection to deploy. The following artifacts are downloaded from the seller's S3 bucket at deployment time: dashboard.json (Grafana dashboard configuration), mediainfo.zip and mediainfo_lib.zip (optional video metadata extraction). No customer data is collected or transmitted externally.
Highlights
- Complete CloudFront & WAF analytics in one dashboard
- Fully serverless, zero maintenance
- Built for scale, priced for efficiency
Details
Sold by
Categories
Delivery method
Delivery option
CloudFront & WAF Analytics Dashboard - Full Deployment
64-bit (x86) Amazon Machine Image (AMI)
Latest version
Operating system
AmazonLinux 2023
Deployed on AWS
New
Introducing multi-product solutions
You can now purchase comprehensive solutions tailored to use cases and industries.

Features and programs
Financing for AWS Marketplace purchases
AWS Marketplace now accepts line of credit payments through the PNC Vendor Finance program. This program is available to select AWS customers in the US, excluding NV, NC, ND, TN, & VT.

Pricing
This product is available free of charge. Free subscriptions have no end date and may be canceled any time.
Additional AWS infrastructure costs may apply. Use the AWS Pricing Calculator to estimate your infrastructure costs.
Vendor refund policy
This is a free product, and no software charges are applied. Therefore, refunds are not applicable. For any questions, support, or feedback, please contact us at support@trackit.io .

Legal
Vendor terms and conditions
Upon subscribing to this product, you must acknowledge and agree to the terms and conditions outlined in the vendor's End User License Agreement (EULA) .
Content disclaimer
Vendors are responsible for their product descriptions and other product content. AWS does not warrant that vendors' product descriptions or other product content are accurate, complete, reliable, current, or error-free.
Delivery details
64-bit (x86) Amazon Machine Image (AMI)
Amazon Machine Image (AMI)
An AMI is a virtual image that provides the information required to launch an instance. Amazon EC2 (Elastic Compute Cloud) instances are virtual servers on which you can run your applications and workloads, offering varying combinations of CPU, memory, storage, and networking resources. You can launch as many instances from as many different AMIs as you need.
Version release notes
Initial release of the CloudFront & WAF Analytics Dashboard.
Key features in this version:
- Interactive Grafana dashboard for CloudFront metrics (traffic, cache performance, HTTP errors, geographic data).
- Optional AWS WAF log analytics integration (security, blocked requests, and bot detection panels).
- Cost-efficient serverless ETL pipeline utilizing AWS Glue, Amazon Athena, and Amazon S3.
- Automation of hourly and daily log processing tasks.
- Optional video playback metadata analysis via pymediainfo.
- Secure deployment options supporting HTTPS access.
Additional details
Usage instructions
This product is designed to be deployed using the automated CloudFormation templates provided.
-
Locate the Root CloudFormation Template URL: https://a-project-marketplace-assets-394125495069.s3.us-east-1.amazonaws.com/infra.yaml
-
Deploy the Stack:
- Go to the AWS CloudFormation Console.
- Click "Create stack" (with new resources) and enter the template URL above.
- Fill in the required parameters:
- AmiId: [Leave default - will be populated by your subscription]
- CloudFrontLogsBucketName: The S3 bucket name delivering your CloudFront logs.
- CloudFrontLogsKeyPrefix: The prefix path to your CloudFront logs.
- WafLogsBucketName (Optional): The S3 bucket name delivering WAF logs.
- GrafanaAdminPassword: Secure password to access your Grafana dashboard (min 8 chars).
- AllowedCidrBlock: IP range permitted to access the dashboard (e.g., your_office_ip/32 or 0.0.0.0/0).
- Proceed through the steps and click "Submit".
-
Access the Dashboard:
- Once the stack status is CREATE_COMPLETE, go to the "Outputs" tab of your stack.
- Copy the "GrafanaDashboardUrl" and open it in your browser.
- Log in using username "admin" and the password you specified during deployment.
Support
Vendor support
TrackIt provides email support for the CloudFront & WAF Analytics Dashboard. Customers can reach our support team at support@trackit.io for assistance with deployment troubleshooting, configuration, or general questions.
Support is available Monday through Friday, from 9:00 AM to 6:00 PM CET / 9:00 AM to 6:00 PM EST. For custom integration requests or advanced consulting needs, please contact our team via our website.
AWS infrastructure support
AWS Support is a one-on-one, fast-response support channel that is staffed 24x7x365 with experienced and technical support engineers. The service helps customers of all sizes and technical abilities to successfully utilize the products and features provided by Amazon Web Services.
Similar products
Hydrolix provides turnkey, real-time observability into your Amazon CloudFront, AWS Elemental and Amazon WAF logs with pre-built dashboard visualizations and long term data retention, at 75% less the cost of other providers. Ingest and analyze petabyte scale data in less than ten seconds. Spot performance and security issues instantly.

This product has charges associated with it for seller support. Deploy Redash on AWS with Meetrix preconfigured AMI, an open source data visualization and dashboarding platform for querying, analyzing, and sharing insights from multiple data sources.

OneData Software protects web applications using AWS WAF v2 to block malicious traffic, SQL injection, cross-site scripting, and other common web exploits. They configure custom WAF rule sets tailored to each application, integrate WAF with other security services (like Shield Advanced), and monitor/adjust rules to maintain strong defence. This helps keep customer-facing apps secure, compliant, and available.

The Complete OWASP Top 10 Ruleset delivers comprehensive web application protection to protect against the OWASP Top 10 web application threats
Customer reviews
No customer reviews yet
Be the first to review this product . We've partnered with PeerSpot to gather customer feedback. You can share your experience by writing or recording a review, or scheduling a call with a PeerSpot analyst.