Sold by: Observe, Inc.
Deployed on AWS
Observe Inc. is redefining modern AI-powered observability at scale. The only company to offer a platform built on an open data lake with a proprietary Knowledge Graph and AI SRE, Observe enables users to troubleshoot faster at drastically lower cost.
4.3
Overview
Image
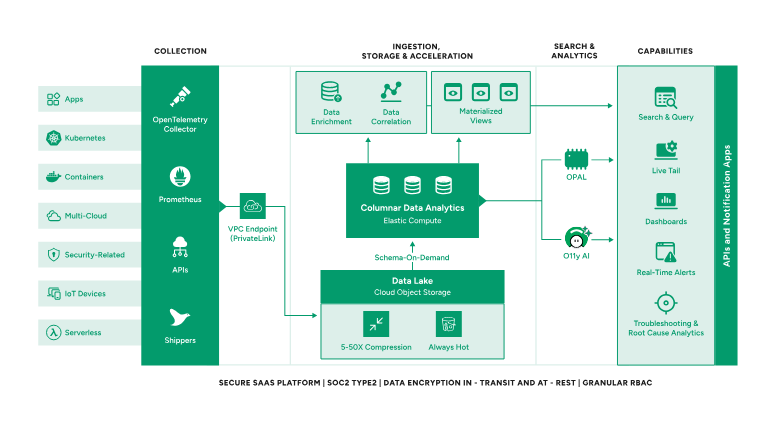
Observe Architecture Diagram
Video
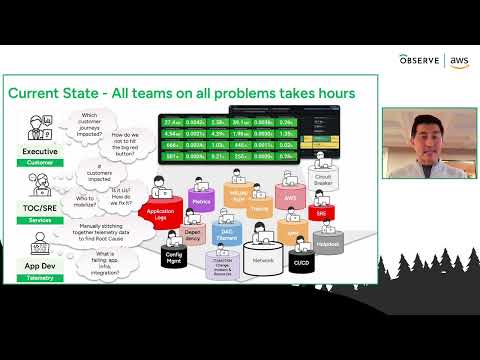
Product video
Observe is an AI-powered observability platform, engineered for scale. It ingests petabytes of telemetry per day, then structures that data using the O11y Knowledge Graph to enable fast search and correlation across logs, metrics, and traces.
With O11y AI, engineers can troubleshoot complex incidents using natural language, accelerating root cause analysis and resolution.
Built on a Snowflake data lake, Observe delivers significantly greater cost efficiency when storing and analyzing telemetry at scale.
Highlights
- Performance at Scale: Ingest 100s of TBs and run 10s of millions of queries per day without degrading performance, so you can support multiple teams and use cases on Observe.
- Faster Troubleshooting: Resolve incidents faster using O11y AI and context-aware correlation across logs, metrics, and traces, resulting in 3x faster incident resolution (MTTR) and increased engineering productivity.
- Cost-Efficient for Massive Datasets: Reduce costs by 70% and avoid vendor lock-in by using an open data lake. Ingest and retain more telemetry to avoid blind spots.
Details
Sold by
Categories
Delivery method
Deployed on AWS
New
Introducing multi-product solutions
You can now purchase comprehensive solutions tailored to use cases and industries.

Features and programs
Financing for AWS Marketplace purchases
AWS Marketplace now accepts line of credit payments through the PNC Vendor Finance program. This program is available to select AWS customers in the US, excluding NV, NC, ND, TN, & VT.

Pricing
Pricing is based on the duration and terms of your contract with the vendor. This entitles you to a specified quantity of use for the contract duration. If you choose not to renew or replace your contract before it ends, access to these entitlements will expire.
Additional AWS infrastructure costs may apply. Use the AWS Pricing Calculator to estimate your infrastructure costs.
Dimension | Description | Cost/12 months |
|---|---|---|
Observe Usage | One unit is $20K worth of compute and storage | $20,000.00 |
Dimensions summary
This listing uses a single pricing dimension: Observe Usage, measured in Units. Each unit represents a fixed amount of compute and storage. You commit to a volume of telemetry data you plan to ingest, then draw down against that commitment as you use compute and storage. Pricing scales with the number of units you purchase, so buying more units raises your total commitment. Because the model is contract-based on committed usage, your costs stay predictable. If you exceed your committed volume, the vendor works with you to adjust capacity rather than sending overage bills.
Top-of-mind questions for buyers
One unit represents a fixed pool of compute and storage that you draw down as you use the platform. Compute runs your queries and processes ingested telemetry. Storage holds your logs, metrics, and traces. You consume from this pool based on how much data you ingest and how many queries you run.
You will not receive an overage bill. If your ingestion exceeds the committed volume tied to your units, the vendor works with you to right-size your capacity instead. This keeps your costs predictable rather than triggering automatic surprise charges when usage climbs.
The volume of telemetry you ingest and the number of queries you run both draw down the pool. Compute scales with query activity, and storage scales with retained data. Data is compressed and elastic compute scales on demand, so you consume based on actual work performed.
www.observeinc.com+1
Helpful?
Vendor refund policy
Custom pricing options
Request a private offer to receive a custom quote.

Legal
Vendor terms and conditions
Upon subscribing to this product, you must acknowledge and agree to the terms and conditions outlined in the vendor's End User License Agreement (EULA) .
Content disclaimer
Vendors are responsible for their product descriptions and other product content. AWS does not warrant that vendors' product descriptions or other product content are accurate, complete, reliable, current, or error-free.
Delivery details
Software as a Service (SaaS)
SaaS delivers cloud-based software applications directly to customers over the internet. You can access these applications through a subscription model. You will pay recurring monthly usage fees through your AWS bill, while AWS handles deployment and infrastructure management, ensuring scalability, reliability, and seamless integration with other AWS services.
Resources
Vendor resources
Support
Vendor support
Observe provides world class support, including an assigned Data Engineer. Please feel free to reach out to us via support@observeinc.com
AWS infrastructure support
AWS Support is a one-on-one, fast-response support channel that is staffed 24x7x365 with experienced and technical support engineers. The service helps customers of all sizes and technical abilities to successfully utilize the products and features provided by Amazon Web Services.
Updated weekly
By Observe, Inc.
By Honeycomb.io
Top
10
In Application Performance and UX Monitoring
Top
10
In Generative AI, Log Analysis
Top
10
In Log Analysis
Sentiment is AI generated from actual customer reviews on AWS and G2
Functionality
Ease of use
Customer service
Cost effectiveness
Positive reviews
Mixed reviews
Negative reviews
AI generated from product descriptions
Data Ingestion and Query Performance
Ingests petabytes of telemetry per day with capability to process hundreds of terabytes and execute tens of millions of queries daily without performance degradation
Knowledge Graph Architecture
Utilizes O11y Knowledge Graph to structure and correlate data across logs, metrics, and traces for fast search and correlation capabilities
Natural Language Processing for Incident Analysis
Implements O11y AI to enable troubleshooting of complex incidents using natural language queries for accelerated root cause analysis
Open Data Lake Foundation
Built on Snowflake data lake architecture providing open data storage without vendor lock-in and enabling cost-efficient telemetry retention
Multi-Signal Correlation
Correlates and contextualizes data across logs, metrics, and traces to provide unified observability across multiple teams and use cases
AI-Powered Root Cause Analysis
Automatically investigates alerts and pinpoints root causes with 5x faster analysis capabilities.
Natural Language Query Interface
Enables querying of observability data using conversational natural language to identify issues and receive actionable insights.
Real-Time Anomaly Detection
Detects system anomalies in real-time to prevent incidents before they impact users.
OpenTelemetry Integration
Supports standardized OpenTelemetry integration for unified data collection across logs, metrics, and traces in cloud-native environments including Kubernetes, serverless, and microservices.
Multi-Tiered Storage Architecture
Implements multi-tiered storage and data management capabilities to optimize telemetry data retention and reduce storage costs.
Event-Based Telemetry Model
Utilizes event-based telemetry architecture to capture and analyze detailed observability data across distributed systems.
Distributed Tracing Capability
Implements distributed tracing functionality to identify and locate issues buried deeply within application stacks across complex services.
Advanced Query Engine
Provides a powerful query engine capable of slicing data across billions of rows and thousands of fields to identify hidden patterns and anomalies.
Multi-Level Data Drill-Down
Enables drilling down from high-level service performance metrics to individual user-level issues without requiring correlation across different data types.
Cloud Native Application Observability
Designed for observability of cloud native applications with integrated support for monitoring service performance and troubleshooting distributed services.
Standard contract
No
Customer reviews
Anonymous
Unified Observability Speeds Troubleshooting, Though the Learning Curve Is Steep
Reviewed on Nov 05, 2026
Review provided by G2
What do you like best about the product?
I like that Observe by Snowflake brings logs, metrics, and traces together in one place. The dashboard makes it super easy to monitor everything, and the worksheets and datasets let me dig deeper when I need to investigate an issue. I also really like being able to correlate different types of data, which makes troubleshooting and identifying the root cause of a problem much faster. It takes away a lot of the time I usually spend looking for information to solve problems with my systems. The initial setup was very simple and straightforward.
What do you dislike about the product?
I think Observe by Snowflake can be a little complex. The learning curve is quite steep, and I think everything could be easier to navigate.
What problems is the product solving and how is that benefiting you?
Observe by Snowflake takes away a lot of the time I usually spend looking for information to solve problems with my systems.
Computer Software
AI-Powered Observability on Snowflake That Unifies Logs, Metrics, and Traces
Reviewed on Oct 31, 2026
Review provided by G2
What do you like best about the product?
Observe by Snowflake is an AI-powered observability platform built natively on the Snowflake AI Data Cloud to unify logs, metrics, and traces.
Key Capabilities
• AI SRE: Automates troubleshooting, root-cause analysis, and agentic workflows using natural language via the UI, CLI, and MCP Server.
• Observability Context Graph: Maps service semantics and relationships to reason about complex distributed systems and AI agents.
Key Capabilities
• AI SRE: Automates troubleshooting, root-cause analysis, and agentic workflows using natural language via the UI, CLI, and MCP Server.
• Observability Context Graph: Maps service semantics and relationships to reason about complex distributed systems and AI agents.
What do you dislike about the product?
While Observe by Snowflake provides cost savings and deep data integration, users and industry analysis highlight several drawbacks, limitations, and growing pains with the platform:
1. High Tech Debt and Internal Scaling Pains
Following its acquisition by Snowflake, the platform has faced standard post-acquisition integration hurdles. According to employee reviews on Blind, internal scaling has led to significant technical debt and legacy design issues that engineering teams are actively trying to resolve.
2. Rigid UX Focused Strictly on Observability
A common critique revolves around the scope of its interface. On Reddit, opinions are mixed regarding its core architecture.
1. High Tech Debt and Internal Scaling Pains
Following its acquisition by Snowflake, the platform has faced standard post-acquisition integration hurdles. According to employee reviews on Blind, internal scaling has led to significant technical debt and legacy design issues that engineering teams are actively trying to resolve.
2. Rigid UX Focused Strictly on Observability
A common critique revolves around the scope of its interface. On Reddit, opinions are mixed regarding its core architecture.
What problems is the product solving and how is that benefiting you?
This platform unifies your system logs, metrics, and traces into a single telemetry lakehouse.
The problems it solves
• The “data silo” tax: Traditional monitoring often forces you to bounce between separate tools for logs, dashboard metrics, and APM traces, which makes root-cause analysis slower and more fragmented.
• Massive ingestion costs: Many traditional observability tools charge exorbitant rates to ingest and store large data volumes, pushing teams to aggressively sample data or delete historical records just to control spend.
• Slow incident resolution: When a microservice or an AI agent breaks in production, manually hunting through unclear or unmapped dependencies to understand why it failed can take hours.
The problems it solves
• The “data silo” tax: Traditional monitoring often forces you to bounce between separate tools for logs, dashboard metrics, and APM traces, which makes root-cause analysis slower and more fragmented.
• Massive ingestion costs: Many traditional observability tools charge exorbitant rates to ingest and store large data volumes, pushing teams to aggressively sample data or delete historical records just to control spend.
• Slow incident resolution: When a microservice or an AI agent breaks in production, manually hunting through unclear or unmapped dependencies to understand why it failed can take hours.
Financial Services
Fast, unified observability with helpful AI troubleshooting
Reviewed on Oct 27, 2026
Review provided by G2
What do you like best about the product?
The clean interface and having logs, metrics, and traces in one place. Queries stay fast on large data volumes, and the AI-assisted troubleshooting surfaces likely causes quickly, so we spend less time digging during incidents.
What do you dislike about the product?
The learning curve for its query language can be steep at first, and some integrations take extra setup to get the data shaped the way you want. Pricing can also be hard to predict as data volumes grow, so it takes some monitoring to keep costs in check.
What problems is the product solving and how is that benefiting you?
It solves the problem of scattered telemetry. Instead of piecing together logs, metrics, and traces from different tools, we get one connected view, so we find root causes faster and resolve incidents sooner. It plugs into our existing stack without much hassle, and the onboarding and support helped us get up and running quickly. Overall, less time firefighting and a better return on what we spend.
Marketing and Advertising
Observe’s Relational Telemetry Makes Troubleshooting Fast and Intuitive
Reviewed on Oct 19, 2026
Review provided by G2
What do you like best about the product?
Instead of forcing you to hunt through disconnected silos of logs, metrics, and traces, Observe links them into a relational model. It maps technical telemetry to actual business entities like shopping carts, user sessions, or customer accounts. This turns troubleshooting from a frustrating text-search problem into an instant graph-traversal exercise
What do you dislike about the product?
While the UI relies heavily on a streamlined visual layout, users note that unlocking the platform's advanced workflows, deep customizations, and unique metrics still requires writing SQL and manual data engineering. Teams transitioning from traditional, point-and-click tools like Datadog often face a steep learning curve to grasp how to manually format and tune the platform's dataset models.
What problems is the product solving and how is that benefiting you?
• The "Three Silos" Problem: Traditional monitoring treats logs, metrics, and traces as three separate buckets of data. When an outage occurs, engineers waste critical minutes manually matching timestamps across different tabs.
• The Observability Tax: As applications generate more data, incumbent legacy platforms charge skyrocketing, volume-based ingestion fees. This forces companies to throw away valuable logs to stay under budget.
• Context Disconnect: Engineers often see that a server's CPU is spiking, but they cannot easily tell which specific customer account or shopping cart session is causing the traffic.
• The Observability Tax: As applications generate more data, incumbent legacy platforms charge skyrocketing, volume-based ingestion fees. This forces companies to throw away valuable logs to stay under budget.
• Context Disconnect: Engineers often see that a server's CPU is spiking, but they cannot easily tell which specific customer account or shopping cart session is causing the traffic.
Dean M.
Observe Helps Teams Troubleshoot Faster Without Jumping Between Tools
Reviewed on Oct 16, 2026
Review provided by G2
What do you like best about the product?
What I like about Observe is the potential to make troubleshooting easier while keeping costs down. The AI capabilities are interesting, but I think the real value is how quickly teams can identify and resolve issues without having to jump between multiple tools. Of course, that depends on how well it performs in practice.
What do you dislike about the product?
One thing I don't particularly like about Observe is the learning curve. I understand that observability is inherently complex, but if you're building a tool that's supposed to make troubleshooting easier, why does it take so much effort to get comfortable using it? The whole point should be to reduce complexity, not introduce another layer of it. I shouldn't need to spend hours understanding how the platform organizes and connects data before I can start getting meaningful answers. AI is great sure, but I question how useful they really are if users still need significant technical knowledge to validate what the AI is telling them. For me, a good observability platform shouldn't just be powerful; it should make complicated information easier to understand and act on. Otherwise, we're just moving the complexity from one place to another and calling it innovation.
What problems is the product solving and how is that benefiting you?
Observe helps address the challenge of having operational data scattered across multiple systems, making it difficult and time-consuming to identify the root cause of issues. By bringing logs, metrics, and traces into one platform, it makes troubleshooting more centralized and gives teams better visibility into what's actually happening. The biggest benefit for me is the potential to reduce the time spent investigating problems. Instead of jumping between different tools and trying to piece everything together, I can get a clearer picture of where things are going wrong. I also appreciate the potential cost savings, especially as the volume of data grows. That said, I think there's still room to improve the learning curve and make the platform more intuitive. A tool designed to simplify troubleshooting shouldn't require so much effort to learn in the first place.