AWS IoT SiteWise Features
Ingest
Gateway management
Configure, deploy, manage, and monitor active edge gateways across all facilities through the SiteWise console or APIs. View the status of all production lines by monitoring the health of your individual gateways remotely using the SiteWise console, or on premises using AWS OpsHub for SiteWise. You can also use the Amazon CloudWatch Metrics console to view gateway metrics to monitor the health, status, and performance of your gateway resources.
On-premises data collection, processing, and monitoring
AWS IoT SiteWise includes AWS IoT SiteWise Edge, on-premises software used to collect, organize, and process equipment data locally before sending it to the AWS cloud. SiteWise Edge runs on local hardware such as third-party industrial gateways and computers, and automates securely connecting to and reading data from your industrial equipment, on-site data servers, or historian databases. SiteWise Edge collects data using multiple industrial protocols, including OPC-UA and MQTT, as well as a wide range of protocols supported through partners. Once data is collected, you can filter data streams (for example, air temperature above a user-specified threshold), define asset metrics such as Overall Equipment Effectiveness (OEE), or customize how data is processed. Once processed, you can send data to the cloud and for longer-term storage and analysis you can send the data to other AWS services such as Amazon S3 and Amazon Timestream.
AWS IoT SiteWise also has MQTT enabled SiteWise Edge gateways, enabling a publish and subscribe data topology (pub-sub) and hub and spoke integration methodology between software components at the edge. The pub-sub and hub and spoke concepts use the open source MQTT standard for data transport , simplifying integrations between existing equipment, middleware, and production systems without the need to learn proprietary APIs or to have deep programming skills. AWS IoT SiteWise also uses REST APIs to allow any edge or cloud application to send data to AWS IoT SiteWise.
Buffered ingestion
Define which data sets are needed in the cloud at different velocities (hot, warm, or cold) to support a variety of use cases – from near real-time monitoring to analytical insights. AWS IoT SiteWise will take care of ingesting data through the most cost-efficient path.
Store
Time series storage integrated with your industrial data lake
Contextualize
Asset modeling
Use AWS IoT SiteWise to build models of your physical operations that represent your assets, processes, and facilities, which will help you understand industrial data in the context of your equipment. Once your models are created, you can define an asset hierarchy to accurately represent relationships between devices and equipment within a single facility or across multiple facilities. SiteWise provides APIs which allow you to bulk import metadata currently available in other systems. For example, you can import your asset definitions and hierarchies for an equipment model currently defined in your historians or SCADA. This capability can help reduce the time it takes to create, update, and managed asset models and hierarchies in SiteWise. You can also create reusable components to derive new nested asset models and express variations between asset models easily.
Asset transforms and metrics
Map data streams and define static or computed equipment and process properties across all facilities so they're readily available for analysis. Using a built-in library of operators and functions, you can create two types of custom computations: transforms and metrics. You can define transforms that trigger when equipment data arrives and metrics computed at user-defined intervals that can be configured for an asset or rolled up from a group of assets. AWS IoT SiteWise also automatically computes commonly used statistical aggregates—such as average, sum, and count—over multiple time periods (for example, one minute or one hour) for equipment data, transforms, and metrics. Visualize these auto-computed aggregates using AWS IoT SiteWise Monitor web applications, or retrieve them to be used from your industrial applications.
Analyze
Data retrieval
SiteWise supports performant retrieval of operational data for near real-time insights and analytical workloads. You can use SQL for ad-hoc analysis or to offload data for Business Intelligence (BI) and Artificial Intelligence (AI) / Machine Learning (ML) applications. Also, you can use an ODBC driver allowing direct integration with BI tools like Tableau, Power BI, and Excel for enhanced data visualization and reporting on operational data without customer development of middleware.
In addition, custom edge and cloud applications can use query APIs to easily retrieve asset data and computed metrics from the AWS IoT SiteWise time series data store, or a publish/subscribe interface to consume a near real-time stream of structured IoT data. You can leverage advanced SQL operations including string manipulation, aggregation functions, multi-field sorting, and datetime operations for time-based analytics. Custom edge applications can also call the same AWS IoT SiteWise query APIs on the AWS IoT SiteWise Edge software running on premises, retrieving asset data and metrics without relying on cloud connectivity.
Alarms
To assess equipment performance, define and update alarms using an integration with Amazon CloudWatch. Set specific alarm rules, choose their severity, and select notification methods like email or SMS. Operators can then manage these alarms and even link them to other AWS services for integrated notifications. AWS IoT SiteWise Monitor and/or SiteWise Grafana plugin allow for a visual representation of these alarms, comparing them with real-time and historical data, and offering a comprehensive view through charts and tables, simplifying equipment monitoring and corrective action planning.
Anomaly Detection
Identify and visualize changes in equipment or operating conditions with native anomaly detection, unlocking Predictive Maintenance use cases. AWS IoT SiteWise automatically manages machine learning models, enabling customers to detect equipment anomalies without any machine learning expertise. You can improve model accuracy, using historical equipment anomaly data. Flexible inference schedule allows you to optimize frequency and cost of insights. Once you schedule inference, the prediction model monitors the data it receives from your equipment and identifies anomalies and trends.
Visualize
Industrial data dashboard
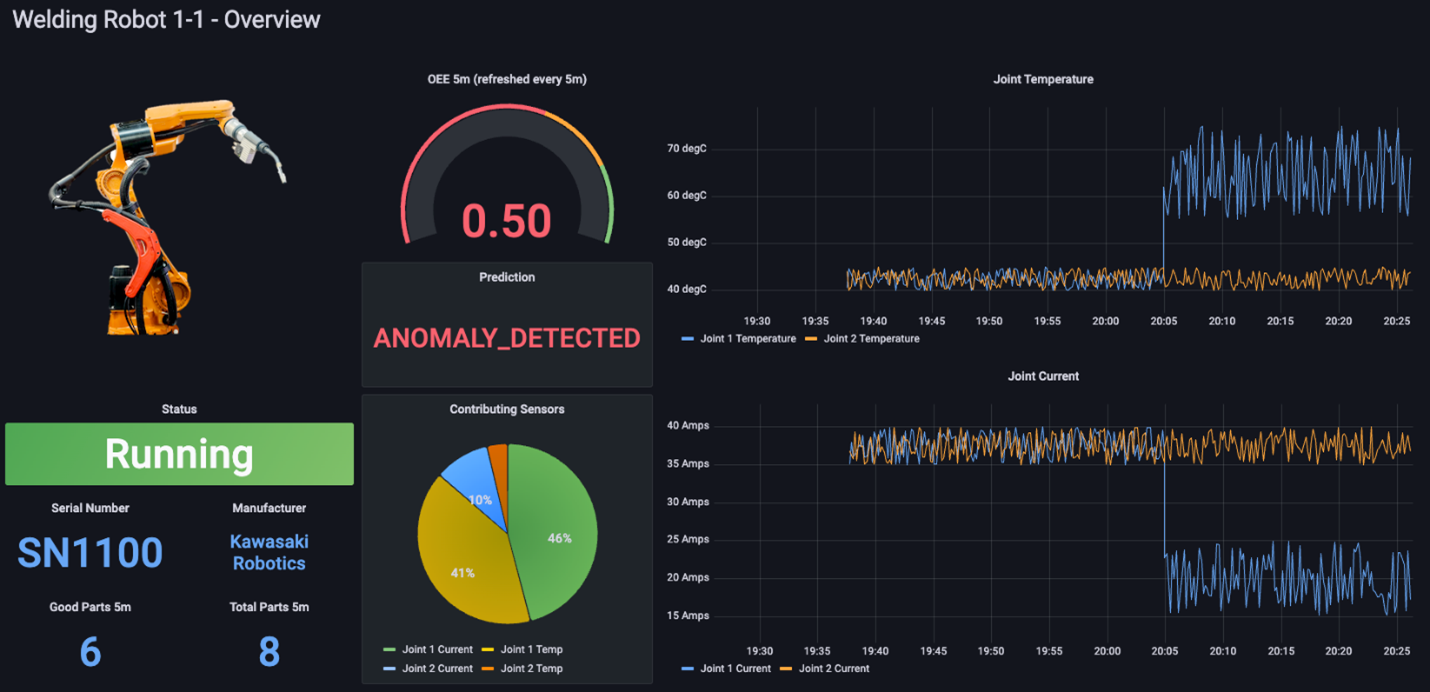
Create no-code, fully managed web applications using AWS IoT SiteWise Grafana plugin. With this feature, you can visualize and interact with operational data from devices and equipment connected to AWS IoT services. You can automatically discover and display asset data ingested and modeled with AWS IoT SiteWise. View asset data and computed metrics in near real time, or compare and analyze historical time series data from multiple assets and time periods. Visualize data using line and bar charts, add thresholds, and monitor data against these thresholds. Users can access the web applications from a browser on any web-enabled desktop, tablet, or phone, and sign in with their corporate credentials through a single sign-on (SSO) experience. Administrators can create one or more web applications to easily share access to asset data with any team in their organization and accelerate insights.
Figure 1: Amazon Managed Grafana using IoT SiteWise plugin
AI Assistant
Generative AI-powered industrial assistant
Get started with AWS IoT SiteWise
Did you find what you were looking for today?
Let us know so we can improve the quality of the content on our pages