
Sold by: cloudimg
Deployed on AWS
Free Trial
AWS Free Tier
This product has charges associated with it for seller support. Pre-configured Grafana OSS AMI with nginx reverse proxy - launch a full observability platform in under five minutes with no manual setup. Backed by 24/7 cloudimg support.
Overview
Image
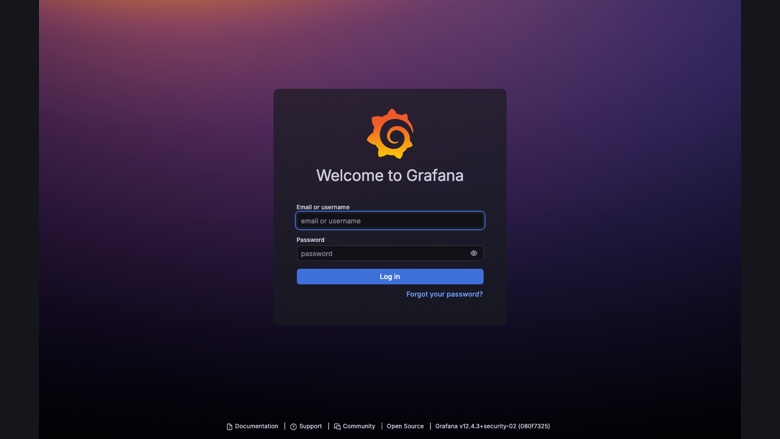
Grafana sign-in page
Image
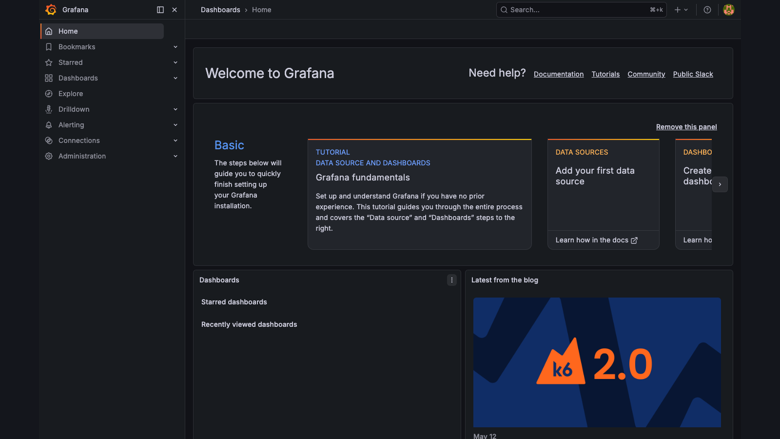
Home dashboard
Image
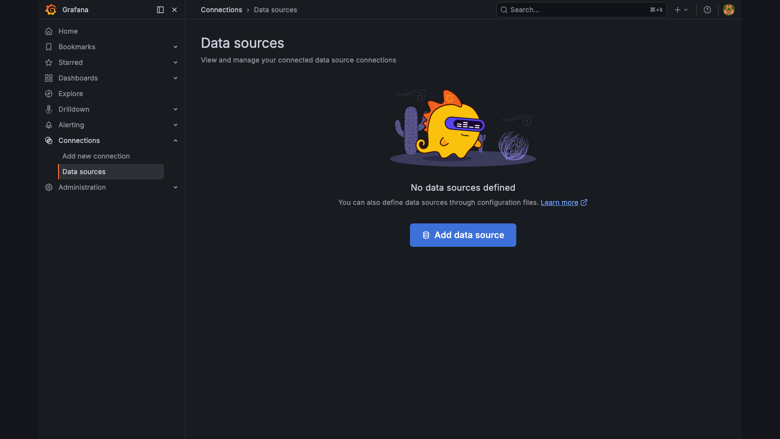
Data sources page
Image
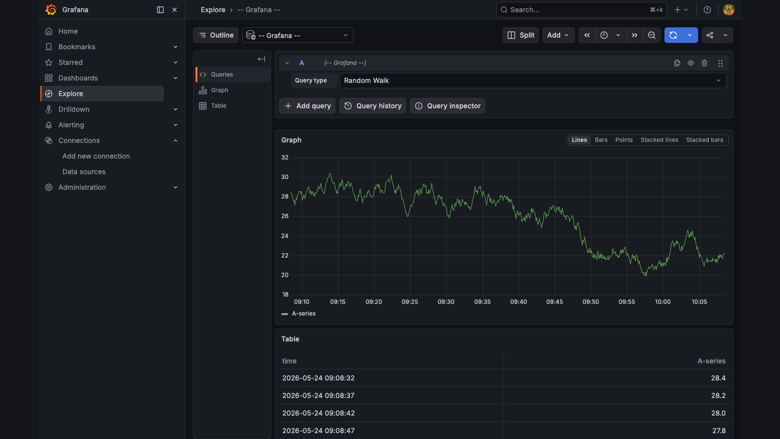
Explore view
This is a repackaged open source software product wherein additional charges apply for cloudimg support services.
Grafana OSS - Production-Ready Observability by cloudimg
This is a repackaged open source software product wherein additional charges apply for cloudimg support services.
Why This AMI Over Manual Installation
Deploying Grafana from scratch requires installing dependencies, configuring systemd services, setting up a reverse proxy, hardening credentials, and tuning permissions. This AMI eliminates that entire workflow. Launch an EC2 instance, and within minutes you have a fully operational Grafana platform with nginx already proxying traffic, a unique administrator password generated automatically, and no default credentials to rotate. Compared to other Grafana AMIs, this image ships with a hardened first-boot process that prevents credential reuse across instances - a common security gap in community images.
Application Stack
- Grafana OSS (latest12.x line) running as a systemd service on a dedicated data volume with bundled SQLite for single-instance deployments
- nginx reverse proxy on port 80 forwarding to Grafana on127.0.0.1:3000 - the upstream is never exposed to the public internet
- Secure first-boot service generates a fresh administrator password unique to each instance, rotates the Grafana admin user via grafana-cli, and stores the credential in a root-only file
Instance Requirements and Sizing
- Minimum recommended instance: t3.small (2 vCPU, 2 GB RAM) for light workloads with fewer than 10 dashboards and a handful of data sources
- Production workloads: t3.medium or larger for environments with dozens of dashboards, multiple concurrent users, and frequent alerting evaluations
- Storage: 20 GB EBS volume minimum; scale based on data retention needs
- Architecture: x86_64 (AMD64)
- Network: Security group must allow inbound TCP port 80; no additional ports required for standard operation
- Scaling note: SQLite is suitable for single-instance deployments; for high-availability or multi-node setups, consider an external PostgreSQL or MySQL database
Security Posture
- No shared or default credentials ship in the image
- nginx ensures Grafana listens only on localhost, reducing attack surface
- Administrator password stored with0600 permissions readable only by root
- EBS encryption is supported - enable it at launch for data-at-rest protection
- For data-in-transit encryption (HTTPS/TLS), configure a certificate on nginx or terminate TLS at an Application Load Balancer
Getting Started Workflow
- Launch the AMI on your chosen EC2 instance type with port 80 open in your security group
- SSH into the instance and retrieve the generated admin password from /root/.grafana_admin_password
- Browse to the instance public IP or DNS to reach the Grafana sign-in page
- Log in with username "admin" and the retrieved password
- Add your first data source (Prometheus, CloudWatch, InfluxDB, Loki, Elasticsearch, PostgreSQL, MySQL, or any of dozens of supported connectors)
- Build dashboards, configure alert rules, and invite team members
Use Cases
- SRE Golden Signals Monitoring: Connect Prometheus, build dashboards tracking latency, traffic, errors, and saturation across your EC2 fleet, and set alert thresholds that notify your on-call team via Slack or PagerDuty
- Infrastructure and application monitoring for teams running workloads on AWS
- Business intelligence and KPI dashboards pulling from PostgreSQL or MySQL
- Log analytics with Loki or Elasticsearch backends
- IoT and time-series exploration for sensor data and device telemetry
- Multi-cloud cost visibility aggregating billing metrics across providers
cloudimg Support
24/7 technical support by email and live chat with a one-hour average response time for critical issues. Our engineers provide expert assistance with Grafana deployment, data source configuration, dashboard authoring, alerting rules, plugin management, and version upgrades.
All product and company names are trademarks or registered trademarks of their respective holders. Use of them does not imply any affiliation with or endorsement by them.
Highlights
- Launch a complete Grafana observability platform in minutes with zero manual setup. The AMI ships with Grafana OSS 12.x, nginx reverse proxy on port 80, and a dedicated data volume - eliminating the typical multi-step installation of dependencies, service configuration, and proxy setup. Unlike bare community images, this deployment is production-structured from first boot with the upstream Grafana port never exposed to the public internet.
- Every instance generates a cryptographically unique administrator password on first boot - no shared or default credentials exist in the image. The one-shot service rotates the Grafana admin account via grafana-cli and stores the password in a root-only file (0600 permissions). This eliminates the credential-reuse risk common in AMIs that ship with static default passwords, reducing your attack surface from the moment the instance starts.
- 24/7 technical support from cloudimg engineers with a one-hour average response time for critical issues. Get expert help with Grafana deployment, data source integration (Prometheus, CloudWatch, Loki, Elasticsearch), dashboard authoring, alert configuration, plugin management, and version upgrades - so your team can focus on building observability rather than troubleshooting infrastructure.
Details
Sold by
Categories
Delivery method
Delivery option
64-bit (x86) Amazon Machine Image (AMI)
Latest version
Operating system
Ubuntu 24.04
Deployed on AWS
New
Introducing multi-product solutions
You can now purchase comprehensive solutions tailored to use cases and industries.

Features and programs
Financing for AWS Marketplace purchases
AWS Marketplace now accepts line of credit payments through the PNC Vendor Finance program. This program is available to select AWS customers in the US, excluding NV, NC, ND, TN, & VT.

Pricing
Free trial
Try this product free for 7 days according to the free trial terms set by the vendor. Usage-based pricing is in effect for usage beyond the free trial terms. Your free trial gets automatically converted to a paid subscription when the trial ends, but may be canceled any time before that.
Pricing is based on actual usage, with charges varying according to how much you consume. Subscriptions have no end date and may be canceled any time. Alternatively, you can pay upfront for a contract, which typically covers your anticipated usage for the contract duration. Any usage beyond contract will incur additional usage-based costs.
Additional AWS infrastructure costs may apply. Use the AWS Pricing Calculator to estimate your infrastructure costs.
If you are an AWS Free Tier customer with a free plan, you are eligible to subscribe to this offer. You can use free credits to cover the cost of eligible AWS infrastructure. See AWS Free Tier for more details. If you created an AWS account before July 15th, 2025, and qualify for the Legacy AWS Free Tier, Amazon EC2 charges for Micro instances are free for up to 750 hours per month. See Legacy AWS Free Tier for more details.
Dimension | Description | Cost/hour |
|---|---|---|
m5.large Recommended | m5.large | $0.08 |
t3.micro | t3.micro instance type | $0.04 |
t2.micro | t2.micro instance type | $0.04 |
r7i.large | r7i.large instance type | $0.08 |
r6id.32xlarge | r6id.32xlarge instance type | $0.24 |
r5d.12xlarge | r5d.12xlarge instance type | $0.24 |
r7iz.metal-32xl | r7iz.metal-32xl instance type | $0.24 |
i3.2xlarge | i3.2xlarge instance type | $0.24 |
m6idn.2xlarge | m6idn.2xlarge instance type | $0.24 |
m8i-flex.4xlarge | m8i-flex.4xlarge instance type | $0.24 |
Vendor refund policy
Refunds available on request.

Legal
Vendor terms and conditions
Upon subscribing to this product, you must acknowledge and agree to the terms and conditions outlined in the vendor's End User License Agreement (EULA) .
Content disclaimer
Vendors are responsible for their product descriptions and other product content. AWS does not warrant that vendors' product descriptions or other product content are accurate, complete, reliable, current, or error-free.
Delivery details
64-bit (x86) Amazon Machine Image (AMI)
Amazon Machine Image (AMI)
An AMI is a virtual image that provides the information required to launch an instance. Amazon EC2 (Elastic Compute Cloud) instances are virtual servers on which you can run your applications and workloads, offering varying combinations of CPU, memory, storage, and networking resources. You can launch as many instances from as many different AMIs as you need.
Version release notes
Initial release of Grafana OSS 12 observability and dashboarding platform.
Additional details
Usage instructions
Connect via SSH on port 22 as the default login user for your operating system variant (the user guide lists it per variant). Grafana is reverse-proxied by nginx on port 80; browse to http://<instance-public-ip>/ and sign in as the 'admin' user. Retrieve the generated administrator password with: sudo cat /root/grafana-credentials.txt. Restrict port 80 to trusted networks until you have placed TLS in front of the deployment. To enable HTTPS, follow the reverse proxy section of the user guide.
Resources
Vendor resources
Support
Vendor support
cloudimg Support
cloudimg provides 24/7 technical support for this Grafana OSS AMI by email and live chat. Our engineers specialize in Grafana deployment, data source configuration, dashboard authoring, alerting, plugin management, performance tuning, and version upgrades.
Response Times:
- Critical issues (service down): one-hour average response
- General inquiries: handled during the same business day
What We Help With:
- Initial deployment and instance sizing guidance
- Connecting data sources (Prometheus, CloudWatch, InfluxDB, Loki, Elasticsearch, PostgreSQL, MySQL)
- Dashboard creation and optimization
- Alert rule configuration and notification channels
- nginx proxy configuration and TLS setup
- Troubleshooting performance or connectivity issues
- Grafana upgrades and plugin compatibility
Instance Requirements:
- Minimum: t3.small (2 vCPU, 2 GB RAM) for light workloads
- Recommended: t3.medium or larger for production with multiple dashboards and concurrent users
- Storage: 20 GB EBS minimum
- Network: Security group must allow inbound TCP port 80
- Time to login: instance is accessible within minutes of launch
How to Reach Us: Email support@cloudimg.co.uk or use live chat. For refund requests or billing questions, contact us via the same channels and we will respond promptly.
AWS infrastructure support
AWS Support is a one-on-one, fast-response support channel that is staffed 24x7x365 with experienced and technical support engineers. The service helps customers of all sizes and technical abilities to successfully utilize the products and features provided by Amazon Web Services.
Similar products

This product has charges associated with it for seller support. Reduce downtime with pre-configured Nagios Core on AWS. Monitor networks, servers, and apps with 24/7 cloudimg expert support on Alma Linux 9 or Ubuntu.

This product has charges associated with it for seller support. Deploy Oracle Database 19c Standard Edition on Windows Server in minutes with production-ready ENA networking up to 25 Gbps and24x7 cloudimg engineer support.

This product has charges associated with it for seller support. Migrate from CentOS 8 EOL to Alma Linux 8 in under 60 seconds with zero licensing fees. 1:1 RHEL 8 compatible, AWS-optimized, backed by 24/7 support with guaranteed 24hr response SLA.

This product has charges associated with it for seller support. Pre-configured Jenkins CI/CD server on Windows for .NET and DevOps teams. Launch in minutes with guaranteed 24-hour response support from cloudimg.

This product has charges associated with it for seller support. Oracle Database 19c Standard Edition AMI pre-configured on enterprise Linux with BYOL licensing. Deploy production-ready Oracle on AWS with 24/7 expert support from cloudimg.
Customer reviews
No customer reviews yet
Be the first to review this product . We've partnered with PeerSpot to gather customer feedback. You can share your experience by writing or recording a review, or scheduling a call with a PeerSpot analyst.