
Sold by: Amazon Web Services
AWS Free Tier
IDP Monitor is an operations dashboard for your IDP Accelerator deployment. It shows what your document pipeline is doing right now and what it has cost you: document volume and status, per-stage latency, failures with error categories, throttling across Bedrock, Textract, Lambda and DynamoDB, low-confidence documents, the human review queue, and cost broken down by document type, pipeline stage, configuration version and model. Every chart drills down to the documents behind it. An AI Assistant answers plain-language questions about your data, assembles a view of the relevant widgets on the fly, and can run those questions on a schedule and notify you with the results. Reads only your stack's own reporting data, inside your own AWS account.
Overview
Once an IDP Accelerator pipeline is in production, the questions change. Is throughput keeping up? Which document type is failing, and why? What did yesterday cost, and which configuration version or model drove it? Which documents came back with low confidence and are sitting in human review? Answering these from raw CloudWatch logs, Step Functions histories and reporting tables is slow, and it gets slower as volume grows. IDP Monitor puts the answers on one screen. It installs into your existing IDP Accelerator stack as a subscription feature and adds a Monitoring tab to the IDP Web UI, secured by the same Cognito user pool as the rest of the application.
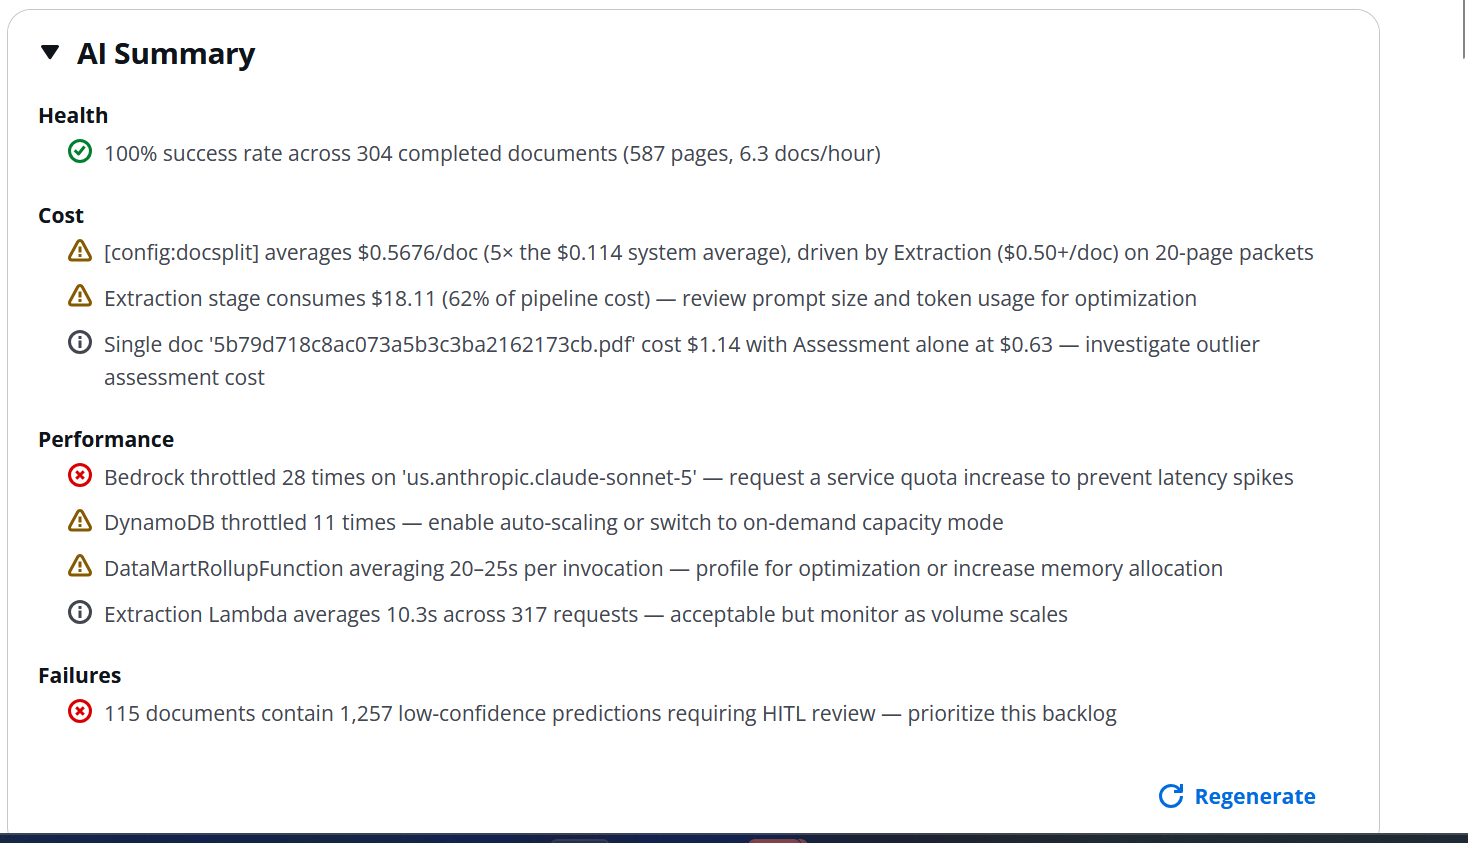
The dashboard is built from a library of widgets you can turn on and arrange per dashboard. Operations widgets cover live in-progress status, completed volume over time, per-stage latency with percentiles, a failures table with error details, throttle and rate-limit events, workflow concurrency and capacity, low-confidence alerts, human-in-the-loop queue tracking, document type distribution, and the configuration versions in use across recent documents. Cost widgets show spend over time, cost by document type, by configuration version, by pipeline stage, and by Bedrock model, alongside the cost of the pipeline's own Lambda and control-plane components and a ranked list of your most expensive documents. Time ranges run from the last hour to the last 30 days or a custom window, and every chart drills into the underlying documents. Data comes from hourly and daily rollups queried through Amazon Athena over the accelerator's reporting bucket, with DynamoDB for in-flight state, so the dashboard stays fast on large volumes without adding load to your processing path. A collapsible AI Summary widget uses Amazon Bedrock to write a health narrative from the current metrics; it stays collapsed and costs nothing until you expand it, and its model, categories, level of detail and custom instructions can be tuned per dashboard.
The AI Assistant turns the dashboard into a conversation. Ask a question in plain language, such as why costs rose last week or which document types are throttling, and a purpose-built agent running on Amazon Bedrock queries your Athena tables, answers in text, and assembles an AI Insights view from the widgets most relevant to the question, with suggested follow-ups. Views you find useful can be saved as named dashboards. Any question can also be scheduled: the assistant runs it on a cron schedule you choose, stores the results, and raises an in-app notification when they are ready, so a daily cost check or a Monday-morning failure review happens without anyone logging in. Dashboard configurations are versioned, with private and shared versions, per-user active selection, and side-by-side comparison. Everything runs inside your own AWS account and region against your own stack's data. No document content, metrics or configuration leaves it.
Highlights
- One screen for pipeline health and cost. Live in-progress status, volume, per-stage latency, failures with error categories, throttling across Bedrock, Textract, Lambda and DynamoDB, low-confidence alerts and the human review queue, alongside cost broken down by document type, pipeline stage, configuration version and model. Every chart drills down to the documents behind it, over any window from the last hour to the last 30 days.
- Ask questions, get dashboards. A purpose-built AI agent on Amazon Bedrock queries your own reporting data in Amazon Athena, answers in plain language, and assembles a view of the most relevant widgets on the fly. Save useful views as named dashboards, or schedule any question to run on a cron and receive an in-app notification when the results are ready.
- Built on your data, inside your account. IDP Monitor installs into your existing IDP Accelerator stack, uses the same Cognito sign-in, and reads the stack's own hourly and daily rollups rather than adding load to your processing path. The AI Summary widget stays collapsed and costs nothing until you expand it. No document content, metrics or configuration leaves your AWS account and region.
Details
Features and programs
Financing for AWS Marketplace purchases
AWS Marketplace now accepts line of credit payments through the PNC Vendor Finance program. This program is available to select AWS customers in the US, excluding NV, NC, ND, TN, & VT.

Pricing
This product is available free of charge. Free subscriptions have no end date and may be canceled any time.
Additional AWS infrastructure costs may apply. Use the AWS Pricing Calculator to estimate your infrastructure costs.
Dimensions summary
This listing has one pricing dimension: a Free usage tier. You pay nothing to subscribe to the IDP Monitor extension. There are no tiers, instance sizes, or paid add-ons to choose between. The extension installs into your existing IDP Accelerator stack and runs inside your own AWS account and Region. Any costs you incur come from the AWS services the dashboard uses in your account, not from this subscription itself. You can cancel the subscription at any time from the AWS Marketplace subscriptions console.
Top-of-mind questions for buyers
The subscription itself carries no charge. Costs come from the AWS services the extension uses in your own account: Amazon Athena queries, a Lambda function, DynamoDB, CloudWatch, X-Ray, and Amazon Bedrock calls for the AI features. You pay AWS for that underlying usage, not for this listing.
No. The AI Summary widget is collapsed by default, and no Amazon Bedrock call runs until you expand it. A dashboard you never expand adds no extra AI cost. Charges tied to AI features only accrue when you expand a summary or ask the assistant a question.
Cancelling from the AWS Marketplace subscriptions console does not delete the extension's CloudFormation stack. Its AWS resources keep running until you delete the stack separately. Delete the stack to stop the underlying AWS charges and remove the dashboard configuration and schedule tables.
aws-solutions-library-samples.github.io
Helpful?
Vendor refund policy
N/A

Legal
Vendor terms and conditions
Upon subscribing to this product, you must acknowledge and agree to the terms and conditions outlined in the vendor's End User License Agreement (EULA) .
Content disclaimer
Vendors are responsible for their product descriptions and other product content. AWS does not warrant that vendors' product descriptions or other product content are accurate, complete, reliable, current, or error-free.
Delivery details
Software as a Service (SaaS)
SaaS delivers cloud-based software applications directly to customers over the internet. You can access these applications through a subscription model. You will pay recurring monthly usage fees through your AWS bill, while AWS handles deployment and infrastructure management, ensuring scalability, reliability, and seamless integration with other AWS services.
Resources
Vendor resources
Support
AWS infrastructure support
AWS Support is a one-on-one, fast-response support channel that is staffed 24x7x365 with experienced and technical support engineers. The service helps customers of all sizes and technical abilities to successfully utilize the products and features provided by Amazon Web Services.
Similar products

Are you interested to get insights from Okta tenant? Metrics monitor can help you there. It provides a rapid way to obtain metrics and statistics from Okta so that you can build your dashboards in few minutes.

Edwin AI is an AI agent for ITOps: purpose-built to accelerate incident investigation, resolution and eliminate operational noise in the modern data center. An agentic AIOps product, Edwin AI combines cross-domain alert correlation, root cause analysis, and autonomous remediation, transforming IT operations and delivering measurable impact-reducing alert fatigue, speeding resolution, and boosting productivity.

ANOW! Observe Roller Coaster Ride is an interactive observability showcase that turns an AWS Marketplace purchase event into a real, sensor-driven roller-coaster ride. It demonstrates event-driven AWS architectures and OpenTelemetry-based observability by streaming live metrics and logs into an ANOW! Observe dashboard.

Accelerate your digital transformation with AND Digital’s IDP Accelerator—an AWS-native solution that automates document ingestion, classification, and data extraction. Eliminate manual document bottlenecks to achieve 80% time savings and deploy a production-ready solution in weeks instead of months.
Customer reviews
No customer reviews yet
Be the first to review this product . We've partnered with PeerSpot to gather customer feedback. You can share your experience by writing or recording a review, or scheduling a call with a PeerSpot analyst.