AWS Partner Network (APN) Blog
Monitoring Your Palo Alto Networks VM-Series Firewall with a Syslog Sidecar
By Reese Pitman, Sr. Solutions Architect at AWS
 |
Your firewall, by design, is exposed to the internet and all the good and bad that comes with it. Closely monitoring these devices is a necessary component of the defense in depth strategy required to protect cloud environments from unwanted changes, and keep your workloads in a compliant state.
VM-Series virtual firewalls provide all the capabilities of the Palo Alto Networks (PAN) next-generation hardware firewall in a virtual machine form factor. Customers are choosing the PAN VM-Series firewall to secure the environments that are vital for their competitiveness and innovation.
Customers also enjoy huge benefits from monitoring their cloud resources with AWS Config, which uses Amazon CloudTrail Logs to monitor your environment for changes. If changes are detected, it notifies you and allows you to take action on these events, either manually or in an automated fashion.
Wouldn’t it be great if you could monitor your PAN VM-Series firewall deployment in a similar fashion with Amazon Web Services (AWS) native services?
In this post, I will show you how to use AWS native services to monitor your Palo Alto Networks VM-Series firewall as if it were just another AWS environment.
Palo Alto Networks is an AWS Partner Network (APN) Advanced Technology Partner with AWS Competencies in Networking, Security, and Containers. The PAN VM-Series firewall is available on AWS Marketplace.
Solution Overview
This solution assumes you have a Palo Alto Networks VM-Series firewall deployed to a public subnet in an Amazon Virtual Private Cloud (VPC). You can apply this solution with no additional changes if you also have firewalls deployed in an internal, or cross-VPC configuration.
To validate the technical components of this blog, I used an Amazon WorkSpace for access to the VPC, instead of the common bastion host method. This approach will not affect how you deploy this solution; however, you may notice the WorkSpaces I used in some of the screenshots.
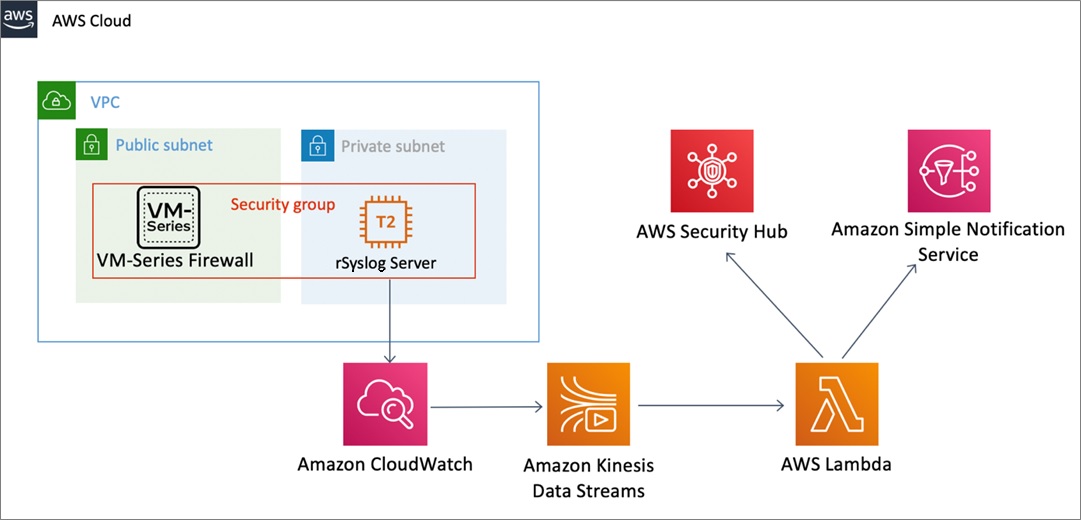
Figure 1 – Our solution uses AWS native services to monitor PAN VM-Series firewall.
Our solution consists of a PAN VM-Series firewall and low-cost Amazon Linux 2 t2.micro instance, deployed to subnets in a VPC. This t2.micro instance has rsyslog enabled forward logs to Amazon CloudWatch.
We connect an Amazon Kinesis Data Stream to the Amazon CloudWatch Logs, and process the stream events with AWS Lambda. We use Lambda to check if one of our predetermined fields has had a change made. If so, we publish a security finding to AWS Security Hub and use Amazon Simple Notification Service (Amazon SNS) to send alerts.
Our solution enables you to take action on any configuration changes made to your Palo Alto Networks VM-Series firewall. With enough planning, you could even perform automated remediations to any unwanted changes on your firewall. However, this post only focuses on detecting the changes, publishing events to AWS Security Hub, and sending notifications via email.
See the CloudWatch Events documentation for details on automating remediations to configuration changes. Also, read this blog post to learn how to enable custom actions in AWS Security Hub.
Prerequisites
Before beginning this process, ensure you have or can do the following:
- AWS Identity and Access Management (IAM) privileges to launch Amazon Elastic Compute Cloud (Amazon EC2) instances.
- IAM privileges to create a Kinesis Data Stream.
- IAM privileges to create and edit AWS Lambda functions.
- IAM privileges to create an Amazon SNS topic.
- Administrator access to the PAN VM-Series admin console.
- Familiarity writing and building AWS Lambda functions.
- Ability to create and edit files on the BASH command line.
- Ability to log into an Amazon EC2 instance via SSH using an SSH key.
- Ability to create and edit security groups.
- Ability to create an IAM policy and attach it to a role.
- Ability to create an IAM role and attach it to an Amazon EC2 instance.
- Ability to view CloudWatch Logs.
- AWS Security Hub enabled.
- Ability to use the AWS Command Line Interface (AWS CLI) and the AWS Management Console.
Solution Deployment
These are the steps to monitor your Palo Alto VM-Series firewall for important changes:
- Launch an Amazon EC2 instance in your VPC.
- Configure and launch rsyslog on your new EC2 instance.
- Install the CloudWatch agent on the EC2 instance.
- Attach a role to the instance so it can send logs to CloudWatch.
- Configure the VM-Series firewall to forward logs to the syslog server.
- Create a Kinesis Data Stream.
- Subscribe the Kinesis Data Stream to CloudWatch.
- Build a Lambda Log parser.
- Enable the Kinesis Data Stream as a Lambda trigger.
- Test and verify our findings desitinations.
Now, let’s walk through each of these steps in detail.
Step 1: Launch an Amazon EC2 Instance in Your VPC
- Start by logging in to the AWS console, and select the Amazon EC2 service.
. - Select the Launch Instance button.
. - Select the Amazon Linux 2 instance, mostly because it has rsyslog already enabled.

- Next, select a t2.micro instance. If you want to save even more money, you may be able to get away with a t2.nano instance, but your actual savings will depend on the expected volume of activity of your firewall.
. - Ensure you select Configure Instance Details so you can launch the Amazon EC2 instance in the proper subnet.
. - Use the pull-down menu to select your VPC, which is probably not the default.

- Of course, you will need to add storage to the EC2 instance. Because we are shipping the logs that come in to this instance off to CloudWatch, we can use only a small amount of local storage.
. - Tag your EC2 instance according to AWS Tagging Strategies when you launch it.
. - The final step before you finish launching the new EC2 instance is to configure the security group. Syslog typically operates on UDP port 514.
.
You can either create a new security group or use an existing one. Just make sure it allows inbound communication on port 514 from the subnet group your VM-Series firewall resides in. Follow the instructions in the EC2 documentation to create a security group for Linux instances.
. - Review the launch configuration and either select an SSH Key Pair you already have and can locate, or select Create New Key Pair.
Step 2: Configure and Launch rsyslog on Your EC2 Instance
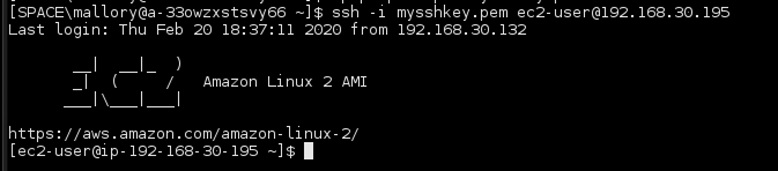
After your new instance is up and running, use your SSH key to log in.
Fortunately, rsyslog is already installed on the standard Amazon Linux 2 EC2 instance, so all we need to do is configure it according to these steps.
- Enable rsyslog to start at boot in systemd by running the following command:
sudo systemctl enable rsyslog

- Start the rsyslog server.
sudo systemctl start rsyslog
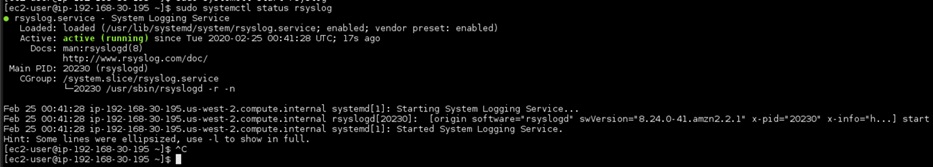
- Ensure rsyslog is running without errors.
sudo systemctl status rsyslog
- Configure the rsyslog server to receive data from a remote host. First edit the /etc/rsyslog.conf.
sudo vim /etc/rsyslog.conf
- Then, add a rule in the RULES section.
$template RemoteLogs,"/var/log/pan.log"
if $fromhost-ip != "127.0.0.1" then ?RemoteLogs
& stop
- The code sample above first checks whether the source of a log data file is localhost. As long as it’s not,
rsyslogwrite to a file calledpan.login the/var/log/directory.
You could enforce a stricter policy here by only accepting logs from a specific Internet Protocol (IP) address. However, with our method, multiple servers can send logs to this one rsyslog server. If you choose to have multiple servers send log data to one server, rsyslog has recipes for labelling the logs by host IP address.
- Create a custom rule file for our new inbound logs rule. Name it
00-custom.confand place it in the/etc/rsyslog.ddirectory.
sudo vim /etc/rsyslog.d/00-custom.conf
- The contents of the file should be:
- Restart rsyslog for the changes to take effect.
sudo systemctl restart rsyslog
No logs are generated at this point because we haven’t yet pointed any firewalls to this server.
Before heading to the PAN VM-Series admin console, configure the CloudWatch agent, as shown in Step 3.
Step 3: Install and Configure CloudWatch Logs Agent
Follow these steps to install and configure the CloudWatch Logs agent.
- Begin by updating YUM and installing the CloudWatch Logs agent.
sudo yum update -y
sudo yum install -y awslogs
- Next, if you are using any region other than us-east-1, update the
awscli.conffile to reflect the region that will receive the CloudWatch Logs, such as us-west-2.
sudo vim /etc/awslogs/awscli.conf
[plugins]
cwlogs = cwlogs
[default]
region = us-west-2
Before you edit any more files, create a CloudWatch Logs group and CloudWatch Logs stream.
- Do this in the AWS console by navigating to the CloudWatch Console and selecting Log Groups in the menu.
. - Create a new log group by selecting the Actions drop-down menu and within it, Create Log Group.

- Give the new log group an appropriate name, and click the Create Log Group button.
. - Select the newly created log group, then Create Log Stream to create a new log stream.
. - Provide an appropriate name for your log stream and select the Create Log Stream button to finish the task.
You can now take the name of the newly created log group and log stream and finish configuring the CloudWatch Logs agent on the syslog server.
- Returning to the SSH session on the syslog server, edit the
awslogs.conffile located in the/etc/awslogs/directory.
sudo vim /etc/awslogs/awslogs.conf
Add this code to the end of the file:
[/var/log/pan.log]
file = /var/log/pan.log
log_stream_name = $LOG_STREAM_NAME
log_group_name = $LOG_GROUP_NAME
- Enable the CloudWatch Logs agent to start at boot, and start the agent.
sudo systemctl enable awslogsd.service
sudo systemctl start awslogsd
Step 4: Attach a Role to the EC2 Instance
A quick situation report will tell you that you still don’t have any logs. That’s because you need to tell the VM-Series firewall to send them to the server. You also need to attach a role to your EC2 instance so it can send logs to CloudWatch.
You will need the Amazon Resource Name (ARN) of your log stream to create an IAM role and policy.
Follow these steps:
- In the AWS console, navigate to the IAM service, select the Policies section, and click Create Policy.
. - Enter CloudWatch Logs in the service field and select the following permissions:
- Service: CloudWatch Logs
- Actions:
- List – DescribeLogStreams
- Write – PutLogEvents
Note that because you created the log group and log stream earlier, you don’t need to provide these permissions to the EC2 instance. This is how we create an environment of Least Privilege.
- Continue implementing a Least Privilege policy by restricting these actions to only a specific log group and log stream, and adding the ARN to the policy.

- Select Review Policy, give your policy a name and description, and select Create Policy to finish the task.
Next, we will create a role for this policy, which we will attach to our EC2 instance.
- In the IAM service, select Roles and then Create Role.
. - Select EC2 as the service, and attach the policy you made in the previous step.
. - Remember to add tags to your role, then select Next: Review to give your new role a name and good description. Finish by clicking Create Role.
You will attach this role to the EC2 instance running the syslog server. You can accomplish this using the AWS CLI. You need the name of the Role you created in the previous step, and the instance ID of the EC2 instance running the syslog server.
- Enter this command:
aws ec2 associate-iam-instance-profile --instance-id $INSTANCE_ID--iam-instance-profile Name=$ROLE_NAME
Now, we will be able to have the firewall forward logs.
Step 5: Configure the VM-Series Firewall
Follow these steps to configure the VM-Series firewall to forward logs to the syslog server:
- Navigate to the VM-Series firewall admin console, and log in with administrator credentials.
. - On the Device tab, navigate to the Server Profiles section of the menu and select Syslog. Click the +Add button

- Provide the IP address and port for the syslog server, then select OK to complete the action.
. - Remain on the Device tab and select the Log Settings menu option. You’ll be configuring the System and the Config profiles. One of the great things about the flexibility of this design is you can configure all the logs you want to monitor to meet your risk appetite.
. - Begin by selecting the +Add button, and then scroll down to the Syslog section. Select the second +Add button, followed by the syslog server you set up earlier. Select OK.

- Follow the same steps for the Configuration section, and any other sections of log groups you want to monitor.
. - Make sure you select the Commit button to apply your changes to the VM-Series firewall.
Step 6: Create a Kinesis Data Stream
Use the AWS CLI for this step.
- Create a stream to send your logs to:
aws kinesis create-stream --stream-name $STREAM_NAME --shard-count 1 --region $REGION
- Use the
describe-streamscommand to get the ARN of your new stream.
aws kinesis describe-stream --stream-name $STREAM_NAME --region $REGION
Step 7: Subscribe the Kinesis Data Stream to CloudWatch
Create an IAM role that allows CloudWatch to write to the Kinesis Data Stream. Continue using the AWS CLI.
- Create a json file and name it
trustCloudwatchPolicy.json.
. - Add this content to it, making sure to replace the variables with your values:
- Create the new IAM role for CloudWatch.
aws iam create-role --role-name putRecordOnStream --assume-role-policy-document file://trustCloudwatchPolicy.json
Next, you’ll create a policy that allows writing to the stream, also known as putting a record on the stream.
- Create a json file. In this example, we’ll name
putPanRecords.json. Use whatever name you prefer, but write it down. You’ll need it later. - Copy this content into the json file:
- Attach a policy to the role.
aws iam put-role-policy --role-name putRecordOnStream --policy-name cwl-put-records --policy-document file://putPanRecords.json
- Now you can create a CloudWatch Logs destination for your Kinesis Data Stream.
aws logs put-destination --destination-name "panDestination" --target-arn "arn:aws:kinesis:$REGION:$ACCOUNT_NUM:stream/$STREAM_NAME" --role-arn "arn:aws:iam::$ACCOUNT_NUM:role/putRecordOnStream"
The last step you need to perform to populate the stream is attaching a destination policy to the newly created destination.
- First, create a file called
panDestination.jsonand attach it to your destination.
- Now, attach the policy to the destination.
aws logs put-destination-policy --destination-name "panDestination" --access-policy file://panDestinationPolicy.json
- Add the destination filter. Note the documentation says to add the destination ARN here, but the proper ARN is the ARN of the stream.
aws logs put-subscription-filter --log-group-name $LOG_GROUP_NAME --filter-name "panStream" --filter-pattern “” --destination-arn “arn:aws:kinesis:$REGION:$ACCOUNT_NUM:stream/panStream” --role-arn “arn:aws:iam::$ACCOUNT_NUM:role/putRecordOnStream”
With Kinesis subscribed to the CloudWatch Logs, you can move on to the fun part—building a Lambda function to solve your needs.
Step 8: Build a Lambda Log Parser
Now that you have logs flowing into Amazon Kinesis, you need to process them and take action on the events that are important to you.
When you process an event and find a match for an event you want to take action on, you will forward the details to both AWS Security Hub and Amazon SNS.
One of the most laborious parts of this design is putting in the effort to establish a list of events and writing the corresponding regular expressions to recognize each event in the stream.
However, putting in the time now to work through the system and capture all the events you deem important will give you a robust way to monitor your firewall to make sure it’s protecting your cloud environment. You may want to think of this as “sharpening the saw.”
Begin by creating an IAM role and policy for your Lambda function.
- Start by creating a policy that matches this one:
After creating this policy, attach it to a role. This example uses a role named panLambdaStreams, but you can name it anything you like, as long as you remember the name.
Before you move on to making the Lambda function, create an Amazon SNS topic to publish our findings to.
- In the AWS console, navigate to SNS, select Topics, and then select Create Topic.
. - Give your topic a name. This example uses the name panPublish.
. - Remember to tag your topic, and then select Create Topic to complete the task.
. - When completed, on the details page of your topic, select the Create Subscription button.
. - Select Email in the protocol drop-down, and provide an email address to confirm your subscription and receive notifications when we test.

- Finish the task by selecting Create Subscription. It may take a few minutes for the subscription confirmation to arrive in your inbox.
. - Once it arrives, click the Confirm Subscription link contained within.
Before you can continue making your Lambda, ensure AWS Security Hub is enabled.
- Navigate to Lambda in the AWS console and select the Create Function button.
. - On the Create Function page, name the new function. This example uses panLogParser.
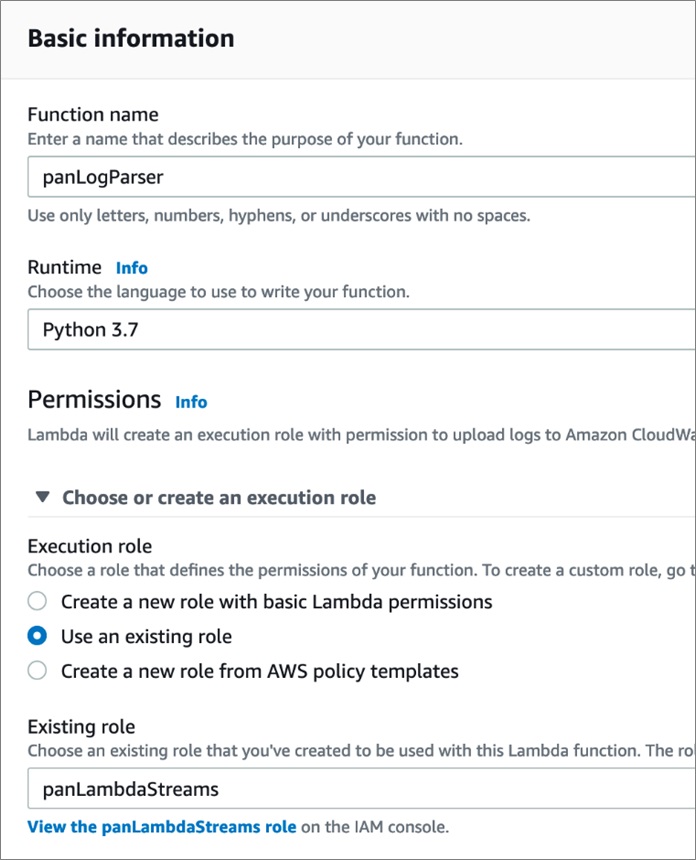
- Select Python 3.7 for the runtime, and select the arrow next to Choose or Create an Execution Role.
. - Select the radio button for Use an Existing Role and, in the drop-down menu, choose the role you created previously in this step.
. - Finish the task by selecting Create Function.
Step 9: Enable the Kinesis Data Stream as a Lambda Trigger
Follow these steps to enable the Kinesis Data Stream as a Lambda Trigger.
- In the Lambda function designer, select the + Add Trigger button. Type Kinesis in the search field and select the Kinesis service as a trigger.
.
Select the Kinesis Stream we made earlier (panStream in our example), and be sure to leave the Enable Trigger box checked.

- Complete the task by selecting the Add button in the lower right corner.
. - Return to your Lambda function, and copy the following Python code into the Function Code window:
- Select Save to complete the Lambda configuration.
Let’s step through the code and point out areas of interest. Lines 14 and 15 give you the flexibility to customize your information portrayed in your AWS Security Hub finding. It would be wise to work with all interested parties to collaborate and ensure the message is clear and usable by everyone.
The single most important line to pay attention to is line 68, the reglist. This is a list of regular expressions that will be cycled through to determine if the log file matches. You might think a basic string compare could be used here, but I would caution against this for two reasons:
- Most string compares use regex under the hood, and
regexgives you the flexibility to make your code more portable for multiple instantiations of this monitoring service.
The time and effort you put in here will pay off immensely in your monitoring efforts. You might wonder, “How do I get a list of actions to monitor?” I wish I had a shortcut answer, but the best way I’ve been able to derive the strings we are looking for is by clicking through the admin console and generating the actual log events we want to match.
For example, this solution lets you monitor for the creation of any new users in the admin console. If you look at the raw logs from the Palo Alto VM-Series firewall, you may notice the fields we are referencing in our code, starting on line 71. But these field positions do not line up with the log that the VM-Series firewall emits.
This is because Kinesis prepends metadata to your log data, and this metadata also happens to be comma delimited, which moves our indexes up by 5.
Also, take a look at fields 19 and 20. As I was testing, I was getting some logs from the VM-Series with 21 fields and some with 22 fields. That caused the field I was looking for to slide within the group. To keep that from happening, I added an if-else statement to the code, just to be safe and make sure we don’t miss a finding.
Step 10: Test and Verify Our Findings Destinations
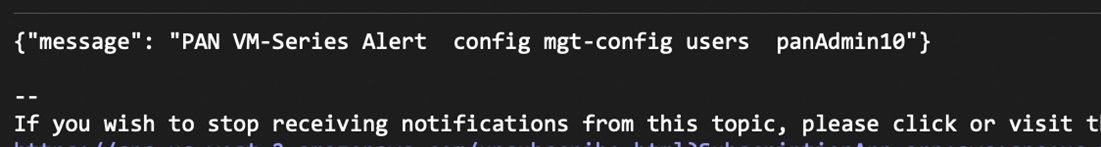
Navigate to your Palo Alto Networks admin console and create a new admin user to trigger an alert via SNS, and populate a finding in AWS Security Hub. With everything working, you should receive an email with a notification, as seen in the screen shot below.
You can see in the following screenshot the email event sent from SNS.
You should also be able to see the finding being reported to AWS Security Hub.

Conclusion
By hosting a Palo Alto Networks (PAN) VM-Series firewall in an Amazon VPC, you can use AWS native cloud services—such as Amazon CloudWatch, Amazon Kinesis Data Streams, and AWS Lambda—to monitor your firewall for changes in configuration. This post explained why that’s desirable and walked you through the steps required to do it.
You now have a way to monitor your Palo Alto Networks firewall that is very similar to how you monitor your AWS environment with AWS Config. Since you are the clever builders I know you to be, you might be thinking, “Reese, we can use this syslog approach to monitor so many other things.”
And you are right!
I encourage you to adapt this design to monitor all your non-AWS resources. Happy building!
.

.
Palo Alto Networks – APN Partner Spotlight
Palo Alto Networks is an AWS Competency Partner. They help customers accelerate cloud migration initiatives with inline and API-based security offerings that complement native AWS security features.
Contact Palo Alto Networks | Solution Overview | AWS Marketplace
*Already worked with Palo Alto Networks? Rate this Partner
*To review an APN Partner, you must be an AWS customer that has worked with them directly on a project.