
Sold by: Jellyfish
Deployed on AWS
Jellyfish is the leading intelligence platform for AI-Integrated engineering, helping more than 1000 companies including DraftKings, Box and Blue Yonder, leverage AI to transform how they build software. By combining the deepest engineering dataset with context-rich intelligence, Jellyfish helps R&D organizations understand what is driving impact, adopt proven industry best practices, and make smarter decisions across AI adoption, planning, delivery, and engineering performance. Learn more at jellyfish.co
4.5
Overview
Image
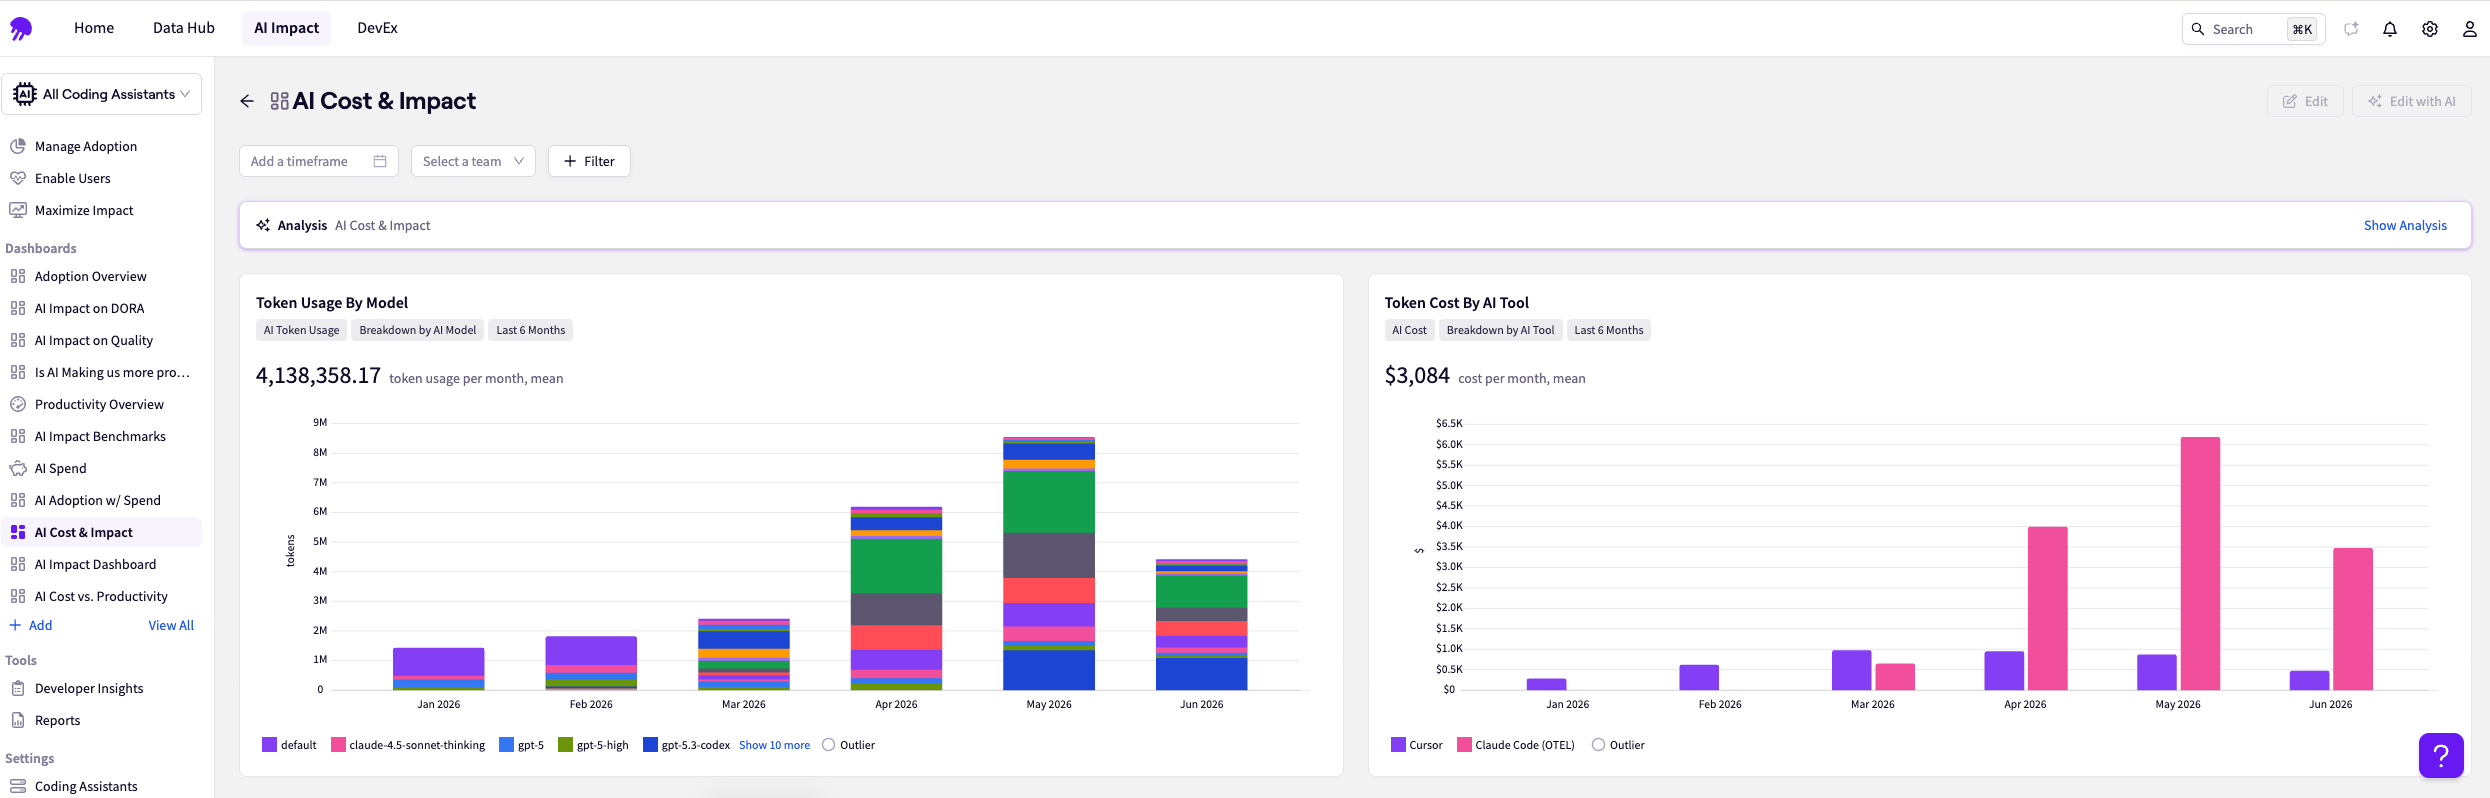
AI & Cost Impact
Image
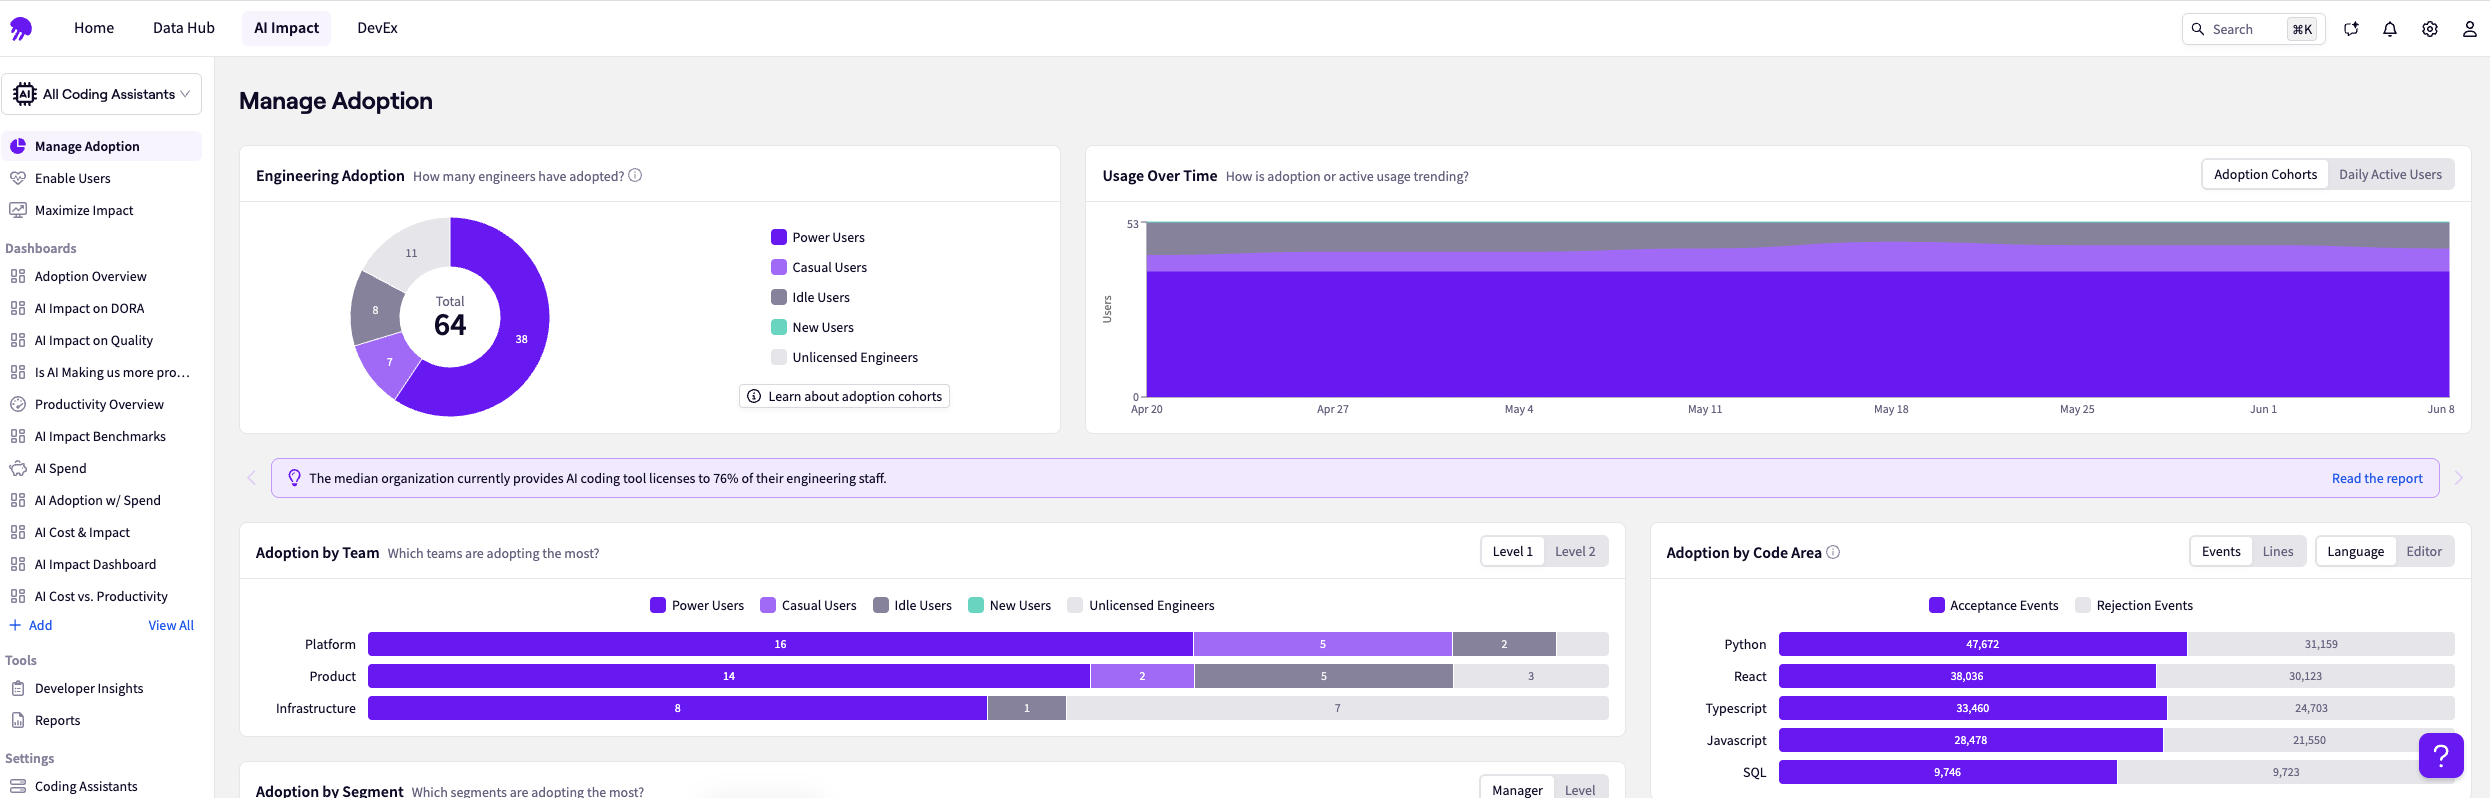
Manage Adoption
Image
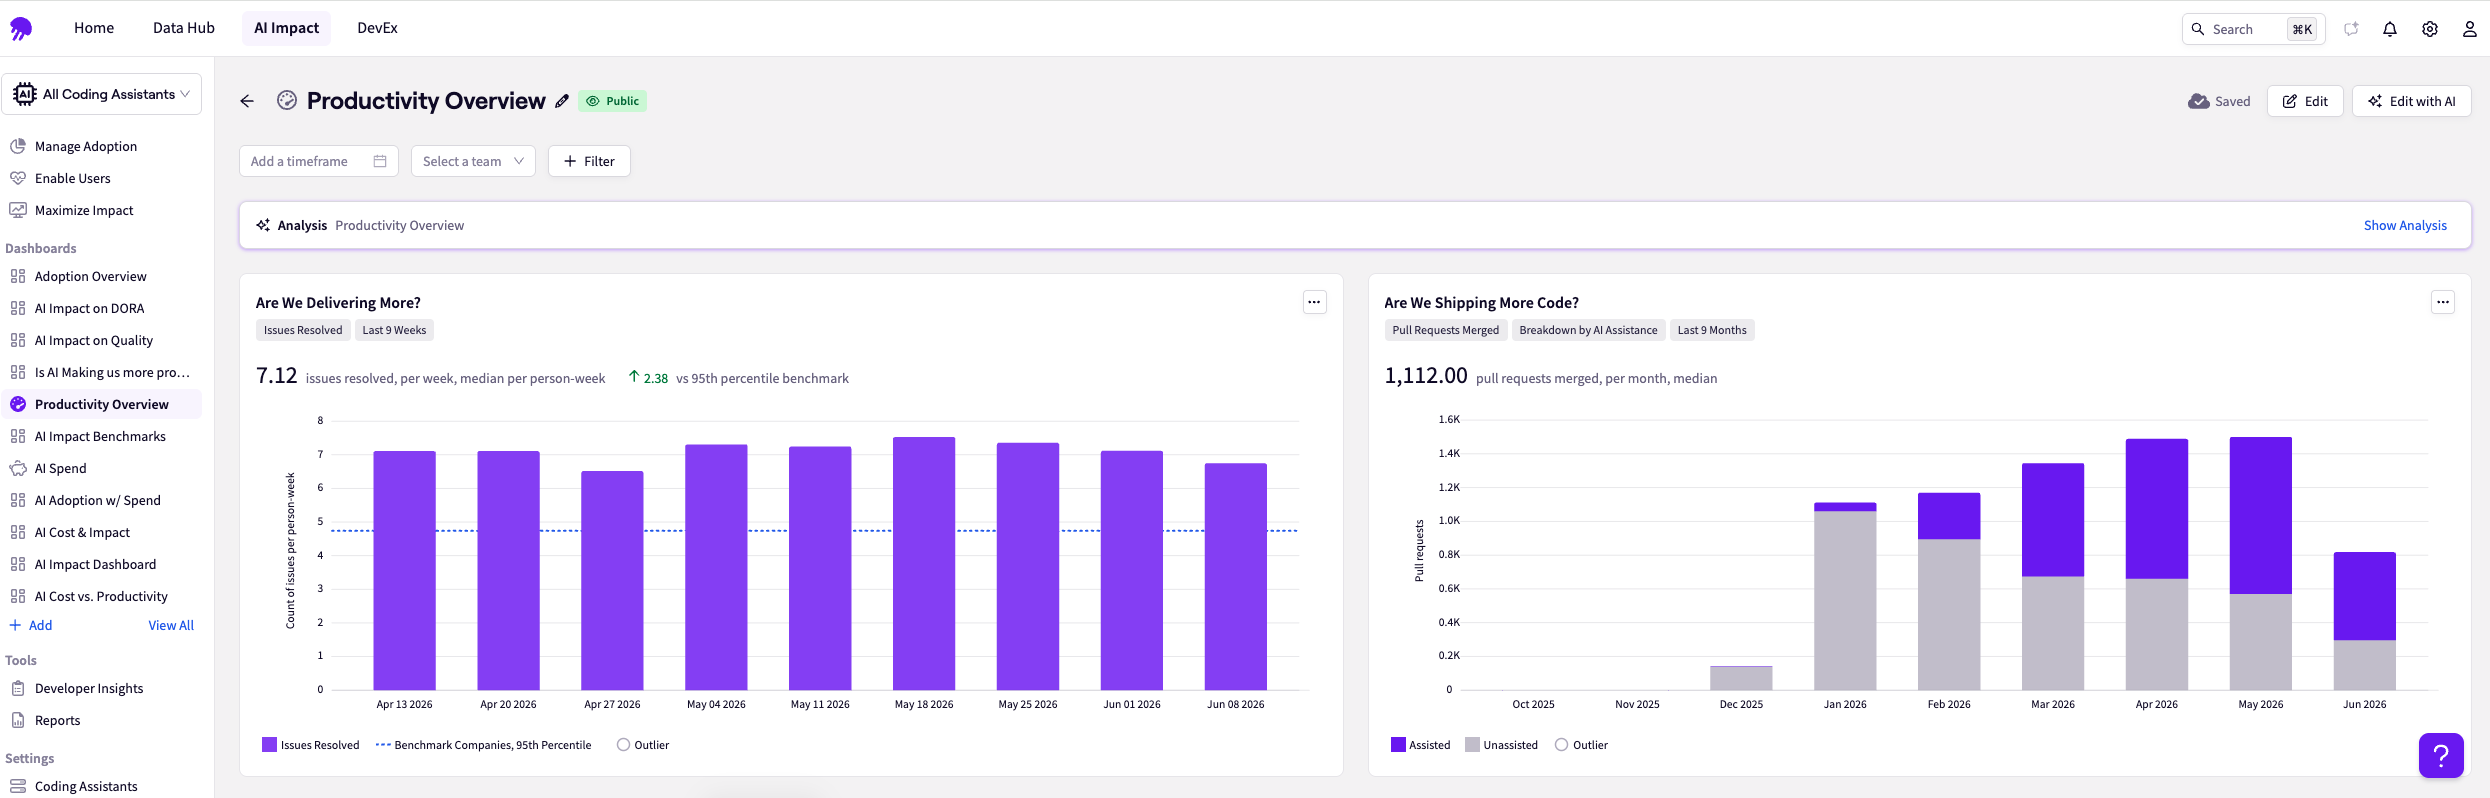
Productivity Overview
Image
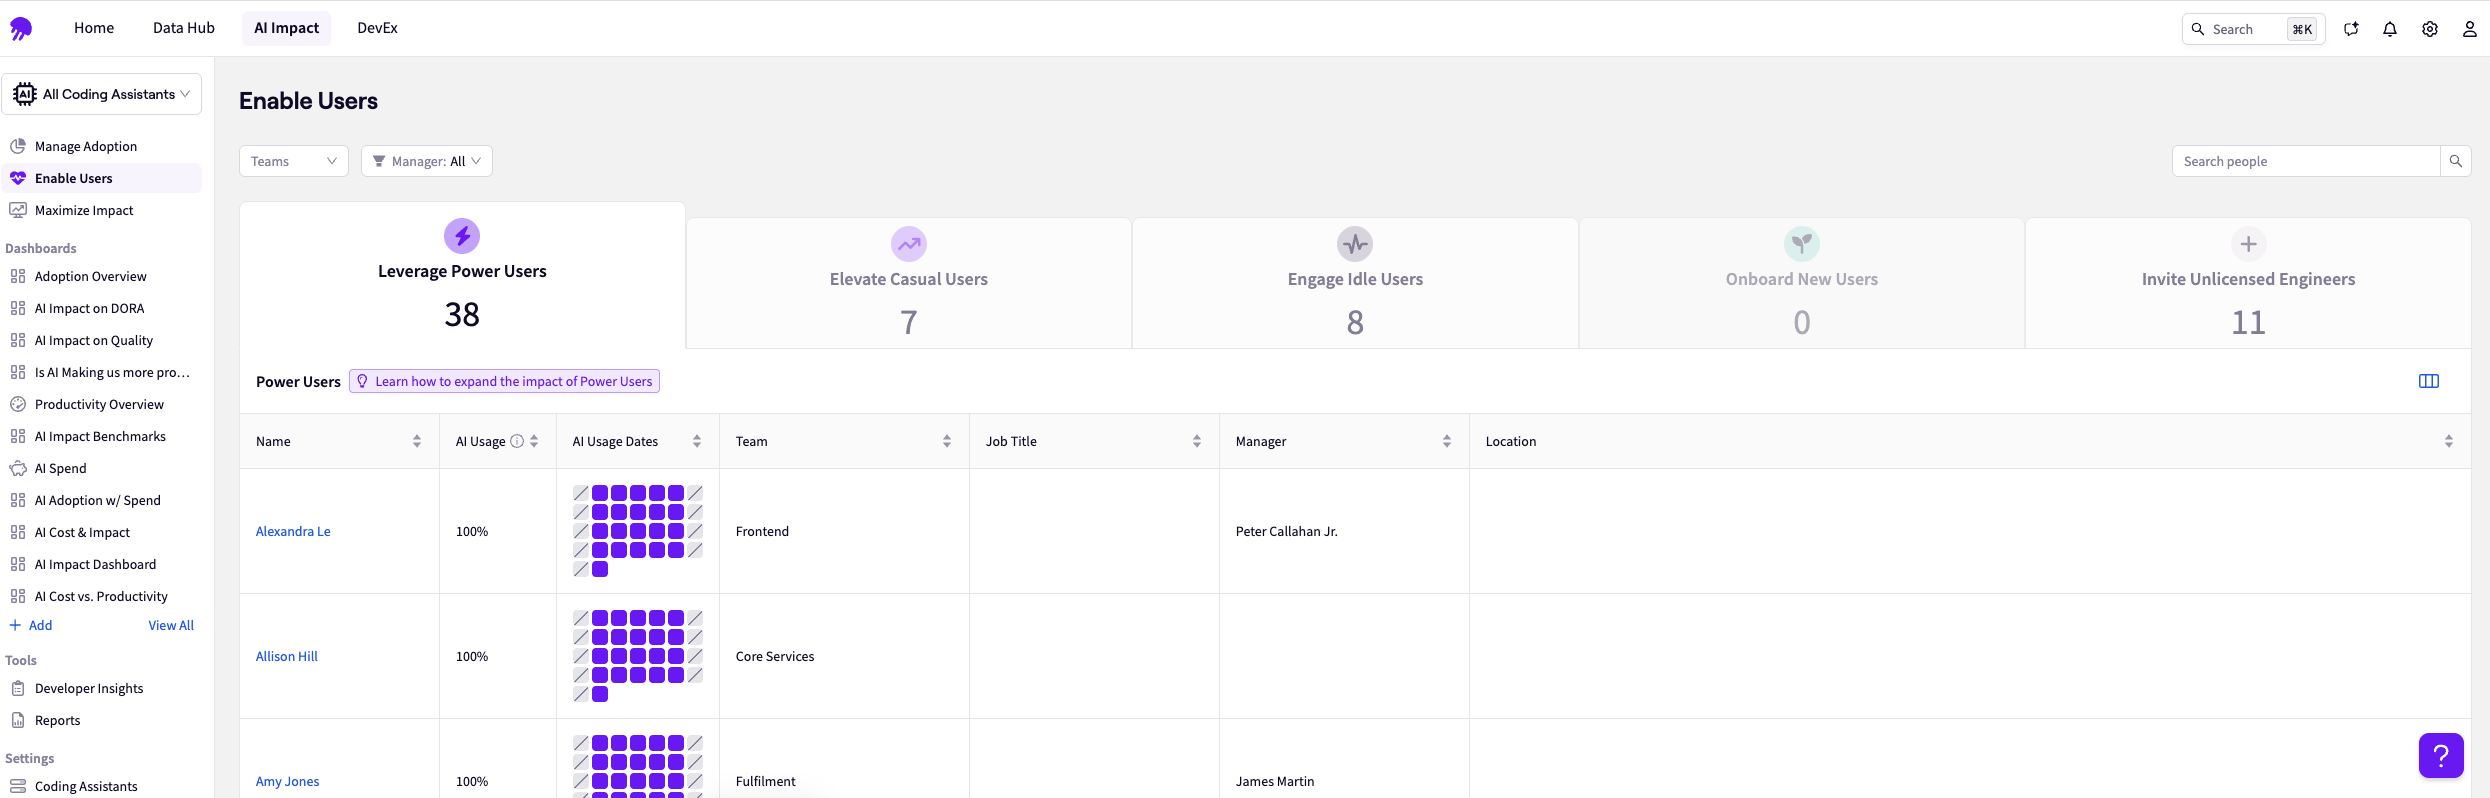
Enable Users
AWS Private Offers available. Contact us at aws@jellyfish.co to get started.
Jellyfish is the Software Engineering Intelligence Platform that answers the question of whether AI investments are delivering the expected business impact, connecting AI tool usage to real engineering outcomes so R&D leaders can see what's actually moving the needle and make confident decisions about where to invest next. More than 1000 companies including DraftKings, Box and Blue Yonder, use Jellyfish to align engineering work with business priorities and ship higher-impact software predictably.
Jellyfish passively ingests signals from across your SDLC and AI tooling, source control, issue trackers, CI/CD, cloud infrastructure, and AI coding assistants, and turns them into a coherent intelligence layer for engineering leadership. You get purpose-built AI Impact dashboards that track adoption and utilization of tools like AWS Kiro and Cursor, measure AI-assisted pull requests, and connect before/after productivity changes to real outcomes: cycle time, deployment frequency, defect rates, and delivery predictability.
This works across software engineering, DevOps, SRE, and infrastructure teams moving beyond ticket velocity to show where engineering effort is going, how work is flowing, and which AI investments are paying off. Engineering leaders get the data to prove ROI to finance and the board. Platform and DevEx teams get the evidence to rationalize tool spend, benchmark impact across cohorts, and make the case for what to double down on, or cut.
Beyond AI impact, Jellyfish gives R&D leaders a unified view of investment allocation, delivery health, and developer experience across every team and product area so that engineering and business leadership share a single, data-backed picture of performance and risk.
Built entirely on AWS and delivered as a multi-tenant SaaS, Jellyfish leverages AWS AI services including Amazon Bedrock (for chat and agentic experiences) and Amazon SageMaker (for intelligent work classification), alongside core AWS infrastructure services, to provide secure, scalable analytics for modern engineering organizations. By tying usage and spend on AWS Kiro, Bedrock-powered assistants, and other AI tools to engineering productivity, quality, and business outcomes, Jellyfish gives AWS customers the data they need to prove ROI and deliver stronger business outcomes from their AI and cloud investments.
Highlights
- Measure how AI affects productivity, speed, and quality to invest confidently in what works
- Combine system data and developer feedback to spot bottlenecks and improve focus, flow, and team performance
- Build a consistent metrics strategy grounded in DORA and SPACE to benchmark trends and report outcomes
Details
Sold by
Delivery method
Deployed on AWS
New
Introducing multi-product solutions
You can now purchase comprehensive solutions tailored to use cases and industries.

Features and programs
Trust Center

Access real-time vendor security and compliance information through their Trust Center powered by Drata or Vanta. Review certifications and security standards before purchase.
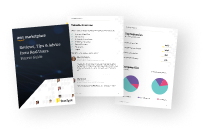
Buyer guide
Gain valuable insights from real users who purchased this product, powered by PeerSpot.
Financing for AWS Marketplace purchases
AWS Marketplace now accepts line of credit payments through the PNC Vendor Finance program. This program is available to select AWS customers in the US, excluding NV, NC, ND, TN, & VT.

Pricing
Pricing is based on the duration and terms of your contract with the vendor. This entitles you to a specified quantity of use for the contract duration. If you choose not to renew or replace your contract before it ends, access to these entitlements will expire.
Additional AWS infrastructure costs may apply. Use the AWS Pricing Calculator to estimate your infrastructure costs.
Dimension | Description | Cost/12 months |
|---|---|---|
Jellyfish AI Engineering Intelligence Platform | Access to full Jellyfish Platform + 15 Engineering User Seats. Contact us for custom configuration and pricing at aws@jellyfish.co | $30,800.00 |
Dimensions summary
This listing offers one contract option. You buy access to the full Jellyfish Platform bundled with 15 engineering user seats. Pricing is set by a fixed contract rather than usage or hourly billing. If you need a different seat count or a tailored setup, you contact the vendor at aws@jellyfish.co for custom configuration and pricing. There are no separate tiers or add-on dimensions to combine here; the single dimension covers platform access plus the included seats as one package.
Top-of-mind questions for buyers
A seat maps to one engineering user who accesses the platform. The listing includes 15 seats in the base package. Each seat covers one individual user account. If you need more or fewer seats, you contact the vendor at aws@jellyfish.co for a custom configuration.
Platform access covers engineering signal analysis pulled from your existing tools, business alignment views, delivery management, and team health insights. It also supports engineering performance metrics like DORA. Access is bundled with the 15 included seats as one package under this contract.
The listed contract fixes platform access with 15 engineering user seats. For a different seat count or a tailored setup, you contact the vendor at aws@jellyfish.co. Pricing is based on the number of seats and the modules you select, so a custom quote reflects your chosen configuration.
jellyfish.co+2
Helpful?
Vendor refund policy
Refund policy as expressly set forth in the agreement.
Custom pricing options
Request a private offer to receive a custom quote.

Legal
Vendor terms and conditions
Upon subscribing to this product, you must acknowledge and agree to the terms and conditions outlined in the vendor's End User License Agreement (EULA) .
Content disclaimer
Vendors are responsible for their product descriptions and other product content. AWS does not warrant that vendors' product descriptions or other product content are accurate, complete, reliable, current, or error-free.
Delivery details
Software as a Service (SaaS)
SaaS delivers cloud-based software applications directly to customers over the internet. You can access these applications through a subscription model. You will pay recurring monthly usage fees through your AWS bill, while AWS handles deployment and infrastructure management, ensuring scalability, reliability, and seamless integration with other AWS services.
Resources
Vendor resources
Support
Vendor support
Jellyfish provides support via the Jellyfish Help Center (https://help.jellyfish.co ), where designated administrators can submit requests. Our support team assists with configuration, integrations, data quality, troubleshooting, and product best practices throughout your subscription. For all Jellyfish users, we also offer robust product documentation, in-app AI help chat, and Jellyfish Academy, an online learning portal for use cases and best practices.
AWS infrastructure support
AWS Support is a one-on-one, fast-response support channel that is staffed 24x7x365 with experienced and technical support engineers. The service helps customers of all sizes and technical abilities to successfully utilize the products and features provided by Amazon Web Services.
Updated weekly

By LinearB
By Allstacks
Top
10
In Agile Lifecycle Management
Top
10
In Agile Lifecycle Management
Top
50
In Agile Lifecycle Management
Sentiment is AI generated from actual customer reviews on AWS and G2
Functionality
Ease of use
Customer service
Cost effectiveness
Positive reviews
Mixed reviews
Negative reviews
AI generated from product descriptions
AI Impact Measurement
Tracks adoption and utilization of AI coding tools, measures AI-assisted pull requests, and connects productivity changes to engineering outcomes including cycle time, deployment frequency, defect rates, and delivery predictability.
Multi-Source Data Integration
Passively ingests signals from source control, issue trackers, CI/CD pipelines, cloud infrastructure, and AI coding assistants to create a unified intelligence layer for engineering leadership.
Performance Metrics Framework
Implements DORA and SPACE metrics to establish consistent measurement strategy for benchmarking trends, tracking delivery health, and reporting engineering performance outcomes.
Intelligent Work Classification
Utilizes Amazon SageMaker for automated classification of engineering work and Amazon Bedrock for chat and agentic experiences to provide context-rich intelligence.
Cross-Functional Team Analytics
Provides unified visibility across software engineering, DevOps, SRE, and infrastructure teams with investment allocation tracking, developer experience metrics, and team-level performance benchmarking.
Metrics Aggregation and Visualization
Aggregates metrics from multiple tools to identify and resolve workflow bottlenecks through intuitive dashboards providing contextual insights for team management.
Workflow Automation
Implements policy as code and automation mechanisms to streamline pull request processes and create efficient workflows across the organization.
Resource Cost Tracking
Visualizes team member costs and project delivery status to align resources with business priorities.
Engineering Operations Analytics
Translates R&D data into quantifiable business impact through software delivery metrics and operational efficiency analysis.
Context-Rich Notifications
Delivers context-rich notifications to support active improvement of engineering operations and workflow optimization.
Multi-Source Data Integration
Ingests engineering data from git-based SCM tools including GitLab and GitHub, build tools such as Jenkins and CircleCI, and portfolio management tools like Jira
Value Stream Metrics and Visualization
Transforms engineering data throughout the SDLC into meaningful metrics and visualizations to measure and visualize the flow of value
Work Completion Forecasting
Provides intelligent forecasting capabilities to predict work completion dates and align engineering output to business initiatives
Delivery Visibility and Monitoring
Delivers complete visibility into the state of deliverables and enables tracking of release predictability and process health
Performance Analytics and Reporting
Generates analytics and reporting on overall team performance to support continuous improvement and organizational change management
Standard contract
No
No
No
Customer reviews
Niranjan Dalvi
Clear visibility into engineering work has improved tracking, accountability, and capitalization
Reviewed on Oct 18, 2026
Review from a verified AWS customer
What is our primary use case?
In my work, I mostly use Jellyfish to provide clear visibility into my work, eliminating the need for manual tracking. The simple dashboard has been able to make it easy for me to understand performance trends quickly. It is incredibly useful because it helps me identify delays in testing or review cycles, which helps me improve consistency and also maintain accountability. The setup was straightforward with smooth integration of tools such as Jira and GitHub, and it was easy to start using. Switching to Jellyfish from more manual tracking methods made the performance tracking more structured. I appreciate the contribution while using it alongside other tools such as GitHub, Jira, and CI/CD pipelines.
I use Jellyfish to track my QA performance with clear dashboards, helping me quickly identify delays in testing cycles. It has improved consistency and accountability by providing visibility into my time usage and contributions.
How has it helped my organization?
Jellyfish has positively impacted my organization by helping us gain visibility into our information in a way we could not get anywhere else. In particular, it shows where developers are actually spending their time, not just where they plan to spend it. The signals Jellyfish captures give us a clearer view of reality than our other planning tools. It also enables capitalization tracking without forcing us to rely on time tracking across our work, which eliminates the guesswork.
What is most valuable?
The best features Jellyfish offers include clear visibility, integration capabilities, and its intuitive interface.
Regarding integration and the intuitive interface, I love the ability to integrate data from tools such as Jira and GitHub, where it simplifies tracking and productivity and project allocation. The intuitive interface and the actionable insights help my team to identify bottlenecks and improve performance, and it also makes it very easy to use, even for non-technical users.
I love the visibility which Jellyfish provides, and I also love the dashboards, where they make it easy to identify delivery risk and understand where teams are spending their time and discuss trade-offs without manually consolidating information from multiple sources.
What needs improvement?
The biggest issue I have with Jellyfish is how it attributes work done by engineers as AI-assisted work. It is really making a guess based on whether there are AI signals the day that they do appear, which is not really a great determination in my opinion.
The dashboard provides strong visibility, but it can sometimes feel a bit complex or dense when trying to drill down quickly into QA-specific insights. More customizable or role-focused views would make it easier to surface what is most relevant without extra filtering.
For how long have I used the solution?
I have been using Jellyfish for two years.
Which solution did I use previously and why did I switch?
I did previously use a different solution, as I switched from LinearB because I needed a great platform that is very easy to use and also cost-effective, and a tool that is very easy to use for both the engineering and also the data team.
What was our ROI?
I have seen a return on investment with Jellyfish, as prior to it, I manually tracked my developers' time spent on epics each month. This included calculating the cost associated with each epic and determining what was capitalizable versus non-capitalizable. Jellyfish automatically calculates the cost for me by interfacing with Jira, computing the FTEs for each epic. This has saved me a lot of time, saved me at minimum a day during my close processes.
What's my experience with pricing, setup cost, and licensing?
My experience with pricing, setup cost, and licensing for Jellyfish is manageable and quite fair.
What other advice do I have?
Jellyfish has been very helpful, especially before I had to go to disparate systems. I had to go to disparate systems such as Jira, GitHub, and LinearB to get data to understand my engineering team's performance. Now I can go to Jellyfish to have those data and metrics aggregated under the platform to understand the team's and organization's performance.
Regarding Jellyfish's AI capabilities, I think its governance and security are handled in an accurate and very secure manner, as the AI insights built within the product take the heavy lifting of evaluating data of the user. I find the accuracy and reliability of output to be very accurate and reliable always.
I would rate Jellyfish ten out of ten.
Which deployment model are you using for this solution?
Private Cloud
If public cloud, private cloud, or hybrid cloud, which cloud provider do you use?
Amazon Web Services (AWS)
Mishari Aliesa
Unified delivery insights have transformed planning and now align engineering work with business goals
Reviewed on Oct 15, 2026
Review from a verified AWS customer
What is our primary use case?
My main use case for Jellyfish revolves around the visibility it provides for my organization and how it supports better planning and leadership conversations. As I continue using Jellyfish, I have found its biggest value is how it brings engineering delivery, team allocation, capacity, and investment priorities into one place by connecting data from tools such as Jira and GitHub, which I have been using in my organization. The dashboard makes it very easy to identify delivery risks, understand where teams are spending their time, and discuss trade-offs without manually consolidating information from multiple sources. It is especially useful for creating a shared view between engineering, product, PMO, and the leadership team in my organization.
Jellyfish helps us by bridging the gap between the engineering teams and the business teams, which has aligned our technical work with the business goals strategically. It has been very helpful because it enables us to make data-driven decisions on estimations.
Jellyfish also provides visibility into our information in a way we could not get anywhere else, as it shows where developers are actually spending their time, not just where they plan to spend it. The signals Jellyfish captures give us a clearer view of reality than our other planning tools. It enables us capital tracking without forcing us to rely on time tracking of our work.
How has it helped my organization?
Jellyfish positively impacts my organization by enhancing team collaboration, providing visibility, and facilitating effective communication within engineering teams. I love it because we can track time and enhance team efficiency through the fantastic metrics in Jellyfish. It allows us to make data-driven decisions more easily. I appreciate it because Jellyfish helps identify issues that hinder effectiveness, calling for more flexible dashboards and improved data accuracy.
Jellyfish has been helpful, especially in my engineering team, in improving productivity by giving us better visibility into development work and helping us identify bottlenecks. I estimate that it has reduced time spent on manual reporting and progress tracking by around twenty percent, allowing my fellow engineers and managers to focus more on development priorities and deliver projects more efficiently.
What is most valuable?
The best features Jellyfish offers include fantastic metrics, enhanced team collaboration, robust metrics analysis, valuable insights, and an intuitive user interface. I love its very flexible dashboards.
The metrics analysis in Jellyfish facilitates effective tracking and optimization of team performance, which helps us. Valuable insights and an intuitive user interface enhance visibility and performance tracking in our engineering department. I find Jellyfish extremely easy to use and appreciate its intuitive user interface and effortless tracking features.
Jellyfish has been able to handle our data privacy and security very well; its governance and security are excellent.
Jellyfish's AI capabilities are generally reliable and provide useful insights into engineering productivity, resource allocation, and workflow efficiency.
What needs improvement?
I find the custom dashboarding challenging, although I acknowledge that the team is moving in the right direction.
Sometimes I need to engage support to fix data pulls from GitHub and Jira, but they resolve these issues very quickly.
More customizable or role-focused views will make it easier to surface what is most relevant without extra filtering.
For how long have I used the solution?
I have been using Jellyfish for two years.
What do I think about the stability of the solution?
Jellyfish is very stable and reliable in our day-to-day use. The dashboard and engineering analytics work well for tracking productivity, project progress, and resource allocation, and we have experienced minimal disruptions; therefore, the platform provides consistent insights for decision-making.
What do I think about the scalability of the solution?
The scalability of Jellyfish is top-notch because it has been able to scale well with our team's growing engineering activities and reporting needs.
How are customer service and support?
Customer support has been very influential and helpful, as the team provided useful guidance during setup and configuration, and also helped address questions about integration and reporting very well. I would rate customer support nine out of ten.
Which solution did I use previously and why did I switch?
We did not use another solution, as we did not switch from any.
How was the initial setup?
Deploying Jellyfish is relatively easy with a straightforward setup process and useful integration with our existing engineering tools.
As IT personnel and software engineer, my experience with the configuration process was generally straightforward. Connecting Jellyfish to our existing development tools and setting up dashboards is manageable, and the platform provides useful visibility into our engineering metrics.
Jellyfish integrates reasonably well with our engineering tools and AWS-based environment, helping us gain better visibility into development activities and engineering performance.
What was our ROI?
Having Jellyfish in our organization has shown us more positive returns than negative; we have seen a positive return on investment mainly through improved engineering visibility and reduced manual reporting. We estimate that it saves around twenty percent of the time previously spent on reporting and progress tracking, allowing engineers and managers to focus more on development work, which has been very helpful in identifying bottlenecks and allocating resources more effectively.
What's my experience with pricing, setup cost, and licensing?
The procurement process for Jellyfish was relatively straightforward. Jellyfish's billing experience is generally straightforward, and the pricing and licensing are manageable once the plan and contract terms are understood. My experience with pricing, setup cost, and licensing is that everything was very manageable, although the overall cost required careful evaluation against expected business value. The setup cost was reasonable, and the implementation did not require significant additional resources, hence everything was straightforward and fell into place within a short period.
Which other solutions did I evaluate?
We evaluated tools such as Linear B and GitLab Analytics before choosing Jellyfish.
What other advice do I have?
I would rate Jellyfish nine out of ten or five out of five. Jellyfish has been really helpful, especially in my engineering department, by tracking where QA and automation work is going, identifying bottlenecks in the development workflow, and solving the lack of visibility between testing work and broader engineering priorities. I recommend Jellyfish to any organization looking to improve engineering visibility, productivity, and resource allocation. Before adopting it, make sure you identify your key performance metrics, ensure your development tools are properly integrated, and involve engineering managers in the setup process. Take time to customize your dashboards and review the insights regularly. Also, evaluate the pricing against your team's needs and expected return on investment to ensure you get the most value from the platform. My overall rating for Jellyfish is nine out of ten.
If public cloud, private cloud, or hybrid cloud, which cloud provider do you use?
Amazon Web Services (AWS)
Transportation/Trucking/Railroad
Powerful AI Insights and Clear UI That Unify Engineering Data in One Place
Reviewed on Jul 30, 2026
Review provided by G2
What do you like best about the product?
The AI insights built within the product takes the heavy lifting of evaluating the data off of the user. The UI is fairly straightforward with pleasing visuals throughout the product. Pulling data from our disparate systems and present a full picture across our engineering organization in one place is a big win. When I do have to deal with the support team, they have been prompt and helpful in resolving my issues.
What do you dislike about the product?
The biggest issue I have with Jellyfish is how it attributes work done by engineers as AI assisted work. It's really making a guess based on if there are AI signals the day that they do a PR which isn't really a great determination in my opinion. Not having the ability to designate static teams has also been a problem when we have teams that are support teams who's work spans multiple JIRA projects.
What problems is the product solving and how is that benefiting you?
Before I had to go to disparate systems such as JIRA, GitLab, Github, and Linear to get data to understand our engineering team's performance. Now I can go to Jellyfish to have those data and metrics aggregated under one platform to understand the teams and organization's performance.
Anonymous
Insightful AI Usage Tracker with Easy Setup
Reviewed on Jul 30, 2026
Review provided by G2
What do you like best about the product?
Jellyfish helps me know where I stand in AI usage and lets me see the usage of my teammates as well. It's useful for understanding how much I depend on AI. I find all the features good, and the initial setup with SSO login was easy.
What do you dislike about the product?
Nothing
What problems is the product solving and how is that benefiting you?
I use Jellyfish to track AI usage, helping me understand my dependency and where I stand. It also lets me see my team's usage, which is useful.
Pedro B.
Quick, Clear Team Progress Metrics at a Glance
Reviewed on Jul 30, 2026
Review provided by G2
What do you like best about the product?
the ability to quickly view my team's progress in metrics we are tracking.
What do you dislike about the product?
sometimes the interface can be clunky and dificult to navigate. I have to know where I am going to get what I need.
What problems is the product solving and how is that benefiting you?
it is giving me visibility into how my teams are performing