
Sold by: Solve DevOps
Deployed on AWS
Free Trial
This is a repackaged open source software product wherein additional charges apply for the pre-tuned Elasticsearch and Kibana stack with kernel/ulimit settings applied, first-boot single-node bootstrap, a configured Amazon CloudWatch agent shipping Elasticsearch and Kibana logs plus host metrics, Amazon SSM Agent for Session Manager access, security hardening, and vendor support.
4
Overview
Image
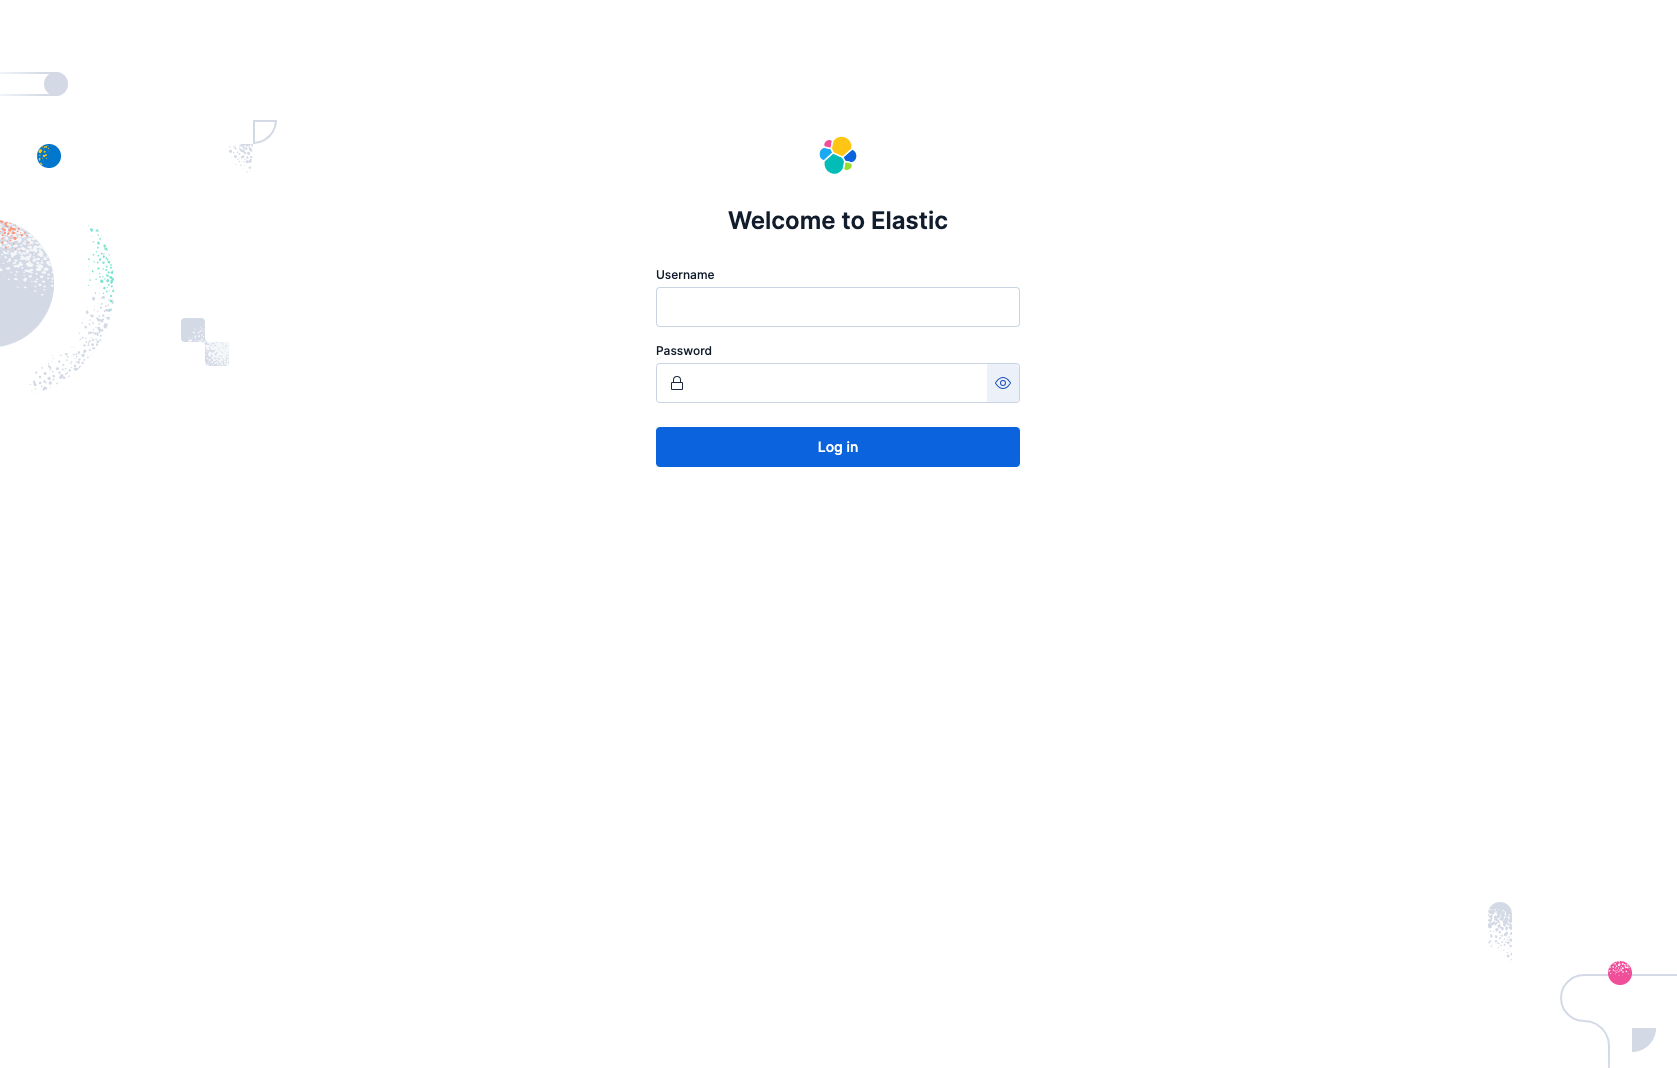
Elasticsearch Login
Image
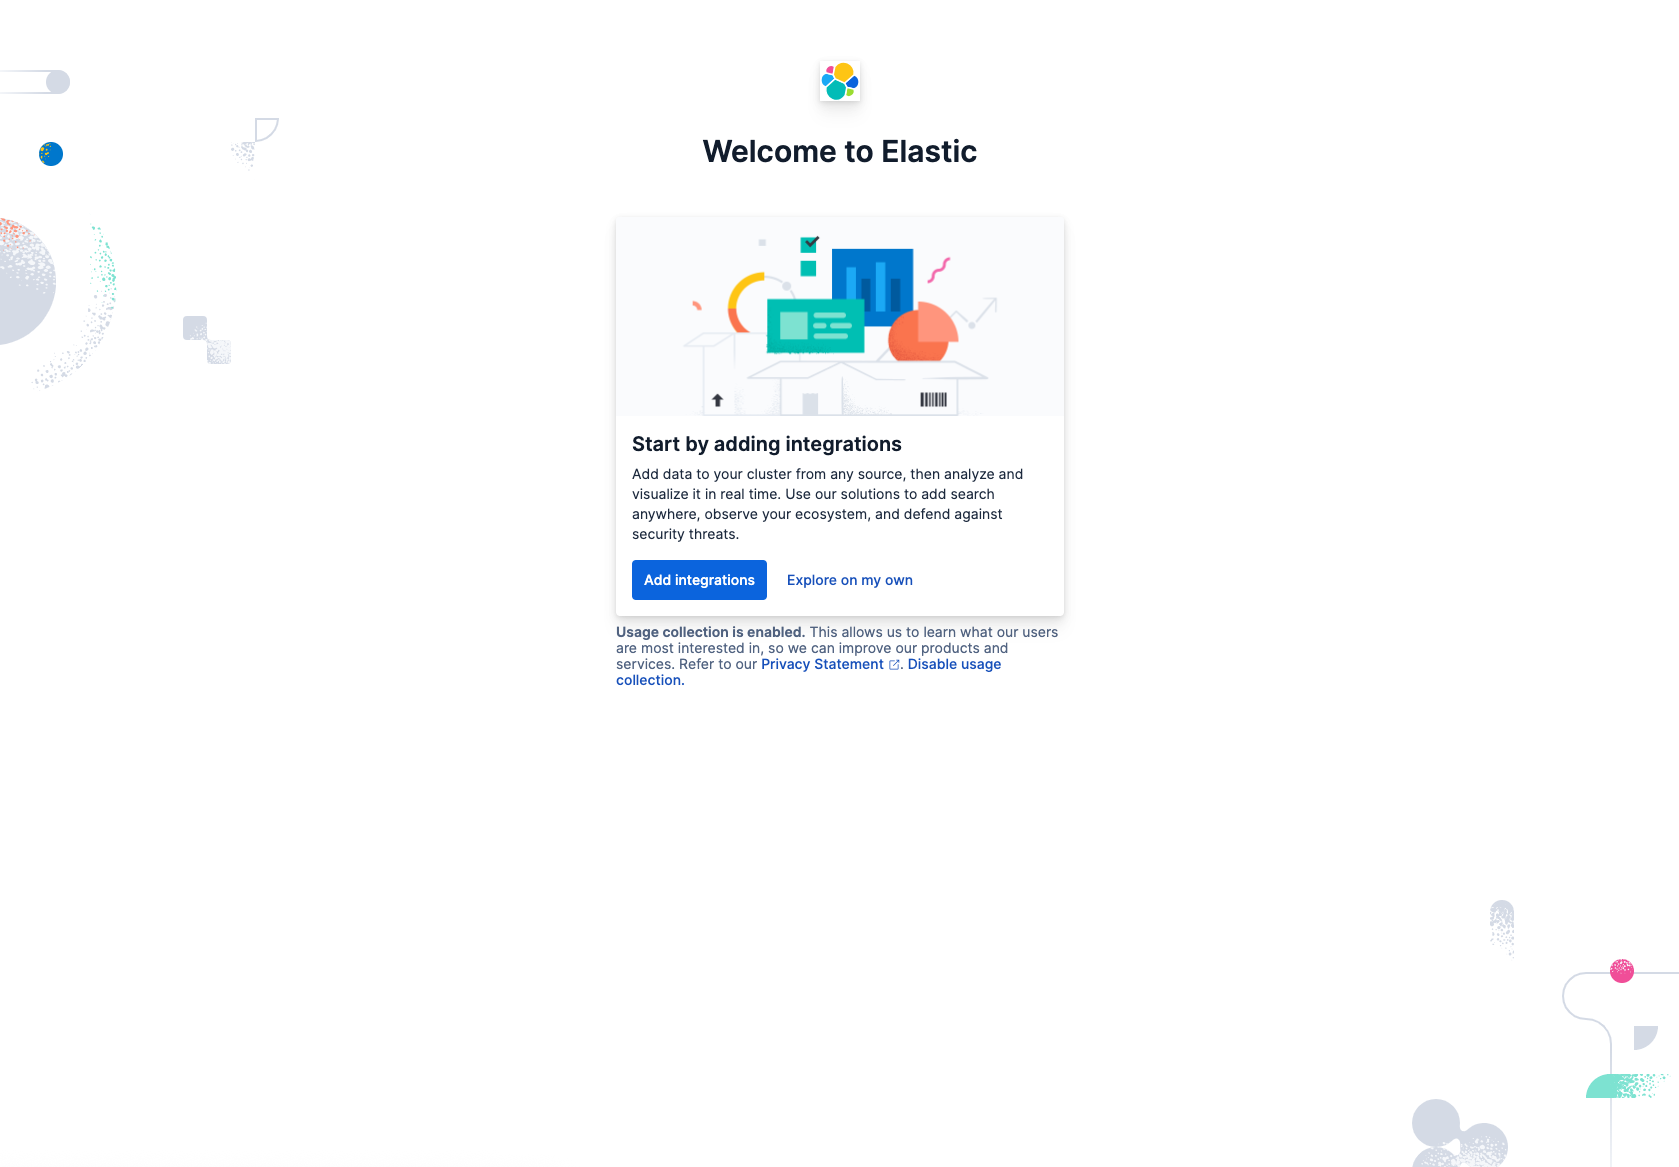
Elasticsearch Welcome
Image
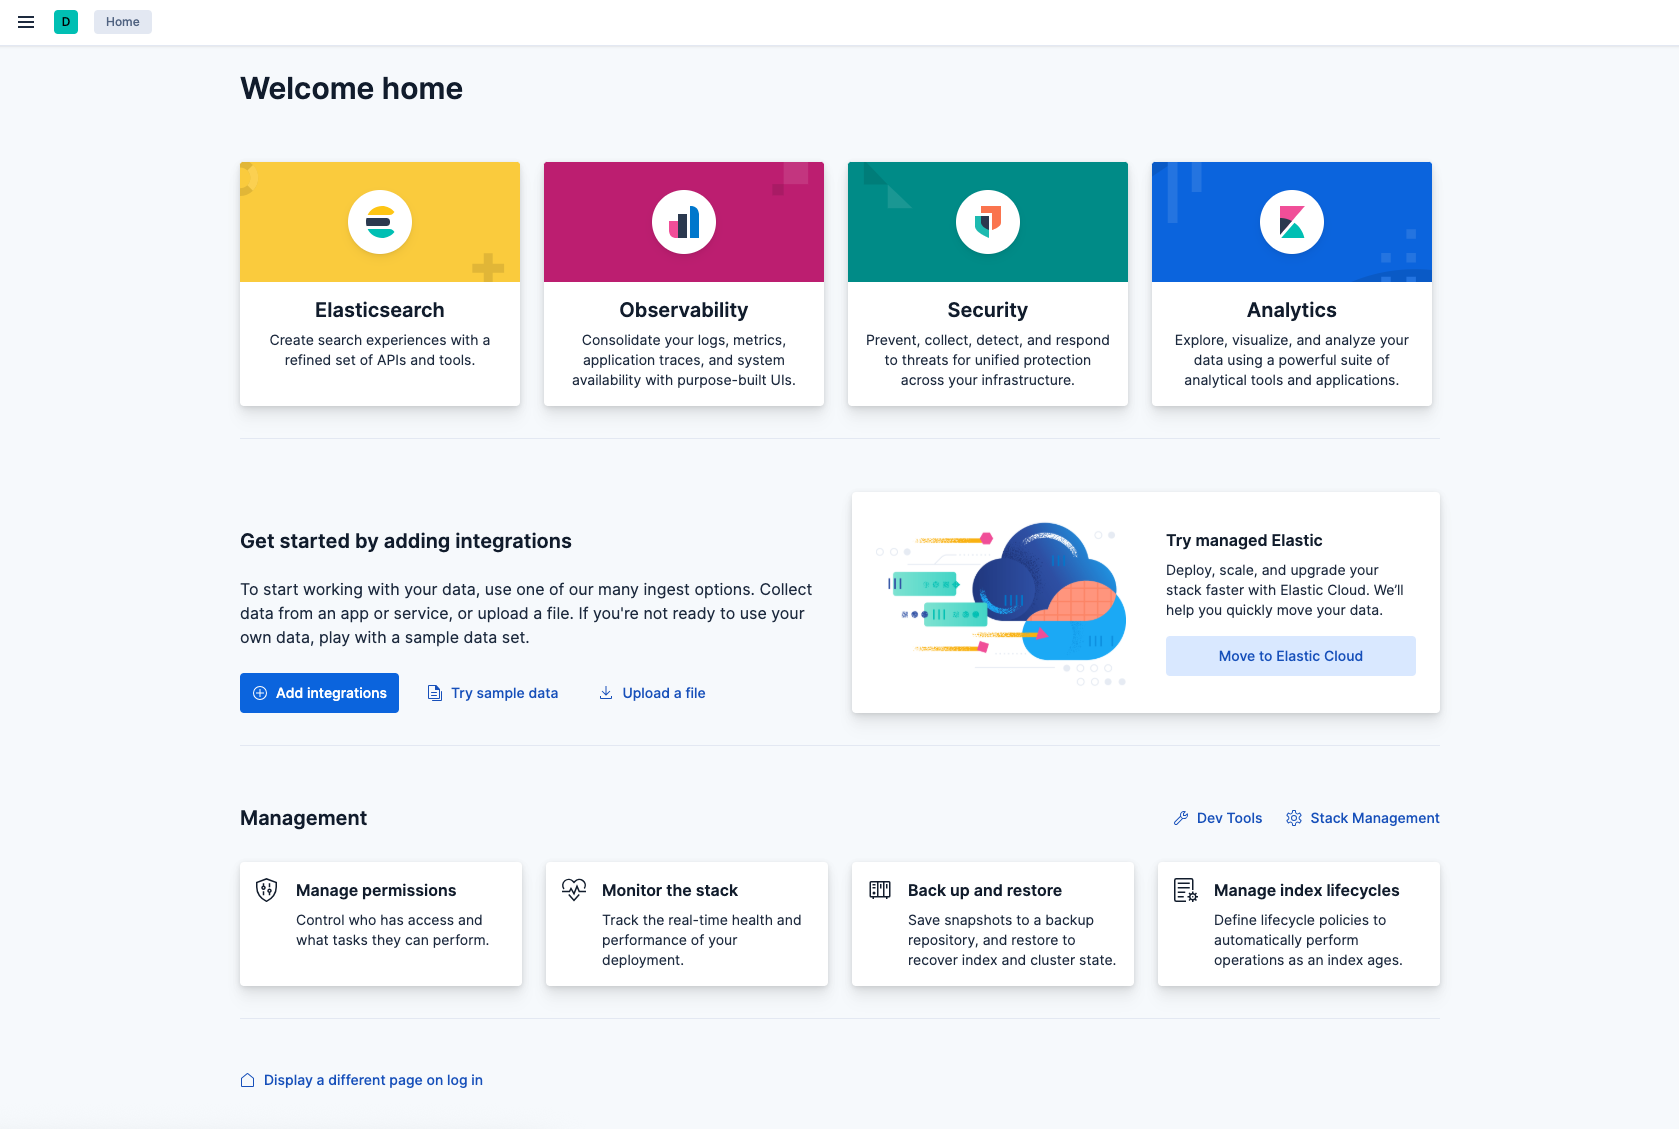
Elasticsearch Dashboard
Transform your data into actionable insights with Elasticsearch and Kibana, deployed as a production-ready analytics stack on AWS. This AMI delivers a pre-configured, secure, single-node cluster on Ubuntu - ready to index data and visualize results in minutes.
What You Get
Elasticsearch and Kibana are installed together from the official Elastic 9.x apt repository. A first-boot script automatically configures the single-node cluster for your instance's hostname, applies required OS tuning (vm.max_map_count=262144, fs.file-max=65535, ulimits), binds both services to all interfaces, and starts them. No manual configuration is needed to reach a healthy, running cluster.
Key Capabilities
- Lightning-Fast Search: Millisecond response times across billions of documents with full-text search and relevance scoring
- Real-Time Analytics: Analyze logs, metrics, and traces as they arrive with near-instant results
- Built-In Visualization: Kibana is pre-installed for dashboards, charts, and data exploration on port 5601
- Scalable Architecture: Start with a single node and grow your deployment as needs increase
- RESTful API: Simple JSON-based interface for all indexing, search, and management operations
AWS-Native Integration
- Amazon CloudWatch: Pre-configured agent ships Elasticsearch logs, Kibana logs, syslog, and auth.log to CloudWatch Logs with 30-day retention. CPU, memory, disk, TCP, and process metrics publish under the SolveDevOps/Elasticsearch namespace.
- AWS Systems Manager: SSM Agent is installed and enabled for Session Manager, Run Command, Patch Manager, and Inventory - no SSH required for day-to-day management.
- IAM-Based Access: Attach an instance profile with CloudWatchAgentServerPolicy and AmazonSSMManagedInstanceCore. No AWS credentials are stored on the image.
Security by Default
- Per-Instance Credentials: No shared passwords are shipped. Elastic security stays enabled, and the login banner walks you through generating the Kibana enrollment token and resetting the elastic password on your own instance.
- Hardened SSH: Key-based SSH only, no root login, no baked-in secrets, cloud-init instance data scrubbed at build time.
- TLS/SSL Enabled: Elasticsearch listens on HTTPS (port 9200) with self-signed certificates out of the box.
- Network Control: Both services bind to 0.0.0.0 - restrict access using your AWS security group on ports 5601, 9200, and 9300.
Real-World Use Cases
- Enterprise Search: Power intelligent search across e-commerce catalogs, knowledge bases, documentation, legal repositories, and media libraries
- Log Analytics and Observability: Monitor application logs, infrastructure metrics, security events, user clickstreams, and IoT sensor data
- Business Analytics: Build real-time dashboards for customer behavior, sales metrics, inventory tracking, and campaign performance
- Industry Solutions: Patient record search in healthcare, fraud detection in finance, product recommendations in retail, content discovery in media, and public record search in government
Getting Started
- Launch Instance: Choose your instance type (recommended: 4GB+ RAM, 2+ CPU), configure a security group for ports 5601, 9200, and 9300, and attach an IAM instance profile.
- Connect: SSH in with your key pair - the login banner displays setup commands and the Kibana URL.
- Complete Setup: Generate your Kibana enrollment token, retrieve the verification code, and reset the elastic password using the provided commands.
- Start Exploring: Open Kibana at https://your-instance-ip:5601 to visualize data, or use the REST API directly.
Quick Commands:
- Check cluster health: curl -k -X GET "https://localhost:9200/_cluster/health?pretty "
- Create an index: curl -k -X PUT "https://localhost:9200/products "
- Search: curl -k -X GET "https://localhost:9200/products/_search?q=laptop "
Configuration Files:
- Elasticsearch: /etc/elasticsearch/elasticsearch.yml
- Kibana: /etc/kibana/kibana.yml
- CloudWatch Agent: /opt/aws/amazon-cloudwatch-agent/etc/amazon-cloudwatch-agent.d/elasticsearch.json
Prerequisites
- IAM instance profile with CloudWatchAgentServerPolicy and AmazonSSMManagedInstanceCore
- Security group restricting ports 5601, 9200, and 9300 to trusted sources
- Minimum 4GB RAM and 2 vCPUs recommended
Ready to power your search and analytics? Click "Continue to Subscribe" to get started.
Highlights
- Elasticsearch and Kibana (current 9.x packages from the official Elastic repository) installed together, bound to all interfaces, with vm.max_map_count, fs.file-max and ulimits pre-set and a first-boot script that sets cluster.initial_master_nodes to the instance hostname so the node forms a healthy single-node cluster automatically.
- Secure by default: Elastic security is left enabled so you generate your own Kibana enrollment token and reset the elastic password on first login (steps shown in the login banner); key-only SSH, no root login.
- Built-in observability and remote management: Amazon CloudWatch agent ships the Elasticsearch and Kibana logs, syslog and auth.log and publishes CPU/memory/disk/TCP metrics (namespace SolveDevOps/Elasticsearch); Amazon SSM Agent enabled for Session Manager; backed by SolveDevOps vendor support.
Details
Sold by
Categories
Delivery method
Delivery option
64-bit (x86) Amazon Machine Image (AMI)
Latest version
Operating system
Ubuntu 26.04
Deployed on AWS
New
Introducing multi-product solutions
You can now purchase comprehensive solutions tailored to use cases and industries.

Features and programs
Financing for AWS Marketplace purchases
AWS Marketplace now accepts line of credit payments through the PNC Vendor Finance program. This program is available to select AWS customers in the US, excluding NV, NC, ND, TN, & VT.

Pricing
Free trial
Try this product free for 5 days according to the free trial terms set by the vendor. Usage-based pricing is in effect for usage beyond the free trial terms. Your free trial gets automatically converted to a paid subscription when the trial ends, but may be canceled any time before that.
Pricing is based on actual usage, with charges varying according to how much you consume. Subscriptions have no end date and may be canceled any time.
Additional AWS infrastructure costs may apply. Use the AWS Pricing Calculator to estimate your infrastructure costs.
Dimension | Cost/hour |
|---|---|
t3.large Recommended | $0.0068 |
c5.metal | $0.0068 |
t2.large | $0.0068 |
m5.24xlarge | $0.0068 |
m4.xlarge | $0.0068 |
m5.12xlarge | $0.0068 |
m4.10xlarge | $0.0068 |
m5.xlarge | $0.0068 |
m5.2xlarge | $0.0068 |
m4.16xlarge | $0.0068 |
Dimensions summary
You pay by the hour for the EC2 instance type you run. The software itself carries a usage rate layered on top of your AWS infrastructure cost. The 38 dimensions map to specific EC2 instance sizes across the T2, T3, C4, C5, M4, and M5 families. Burstable T-family and compute-optimized C-family options sit alongside general-purpose M-family options, including bare-metal c5.metal and m5.metal. Pricing scales with the size and capacity of the instance you choose. Larger instances within a family cost more per hour. You pick the instance that matches your workload and billing stops when you stop the instance.
Top-of-mind questions for buyers
Each instance runs a tuned Elasticsearch and Kibana image built on open-source components. The hourly rate covers the software image. You also pay the underlying AWS compute cost for the EC2 instance type you select. The two charges appear together on your AWS bill.
Billing meters running instance-hours. When you stop an instance, the hourly software charge stops too. You may still pay AWS for attached storage, such as EBS volumes, while the instance is stopped. The software license meters running time only.
You match the instance to your workload. Burstable T-family instances suit light or variable loads. Compute-optimized C-family instances suit processing-heavy search. General-purpose M-family instances balance compute and memory. Bare-metal c5.metal and m5.metal give direct hardware access. Larger sizes within a family carry higher hourly rates.
www.solvedevops.com
Helpful?
Vendor refund policy
Cancel Anytime.

Legal
Vendor terms and conditions
Upon subscribing to this product, you must acknowledge and agree to the terms and conditions outlined in the vendor's End User License Agreement (EULA) .
Content disclaimer
Vendors are responsible for their product descriptions and other product content. AWS does not warrant that vendors' product descriptions or other product content are accurate, complete, reliable, current, or error-free.
Delivery details
64-bit (x86) Amazon Machine Image (AMI)
Amazon Machine Image (AMI)
An AMI is a virtual image that provides the information required to launch an instance. Amazon EC2 (Elastic Compute Cloud) instances are virtual servers on which you can run your applications and workloads, offering varying combinations of CPU, memory, storage, and networking resources. You can launch as many instances from as many different AMIs as you need.
Version release notes
Updates to the latest Security Patches for Elasticsearch, Kibana and Ubuntu
Additional details
Usage instructions
Getting Started:
- Provision an EC2 instance with the right capacity for your needs. For smaller installations we suggest; t3.medium.
- Access your Server using the IP Address issued by AWS for the initial setup. Default Username: ubuntu
- Instructions on how to get Kibana token are available on first SSH access.
- Enjoy the Power of Ubuntu.
Support
Vendor support
Please contact support@solvedevops.com for questions about support scope, response times, or any issues you encounter with this product.
AWS infrastructure support
AWS Support is a one-on-one, fast-response support channel that is staffed 24x7x365 with experienced and technical support engineers. The service helps customers of all sizes and technical abilities to successfully utilize the products and features provided by Amazon Web Services.
Similar products

This is a repackaged open source software product wherein additional charges apply for a pre-installed SonarQube server with kernel and ulimit tuning, Amazon CloudWatch log and metric shipping, AWS Systems Manager integration, SSH hardening, and vendor support.
This is a repackaged open source software product wherein additional charges apply for the pre-tuned Squid forward proxy configuration with structured access logging, Amazon CloudWatch log/metric shipping and AWS Systems Manager integration, security-hardened image preparation, and CloudSOE vendor support.

The Splunk Enterprise AMI accelerates the speed at which organizations deploy Splunk Enterprise in AWS..

EllaFin transforms AWS billing into executive-ready dashboards for nonprofit and public sector leaders. Defined by you, maintained by Ready Secure Managed Cloud (RSMC). No AWS console required. No new tool to learn
Customer reviews
Esse Wognin
Data analysis has improved and reporting now tracks live business performance and resolution time
Reviewed on Apr 11, 2026
Review provided by PeerSpot
What is our primary use case?
My main use case for Solve DevOps Elasticsearch and Kibana is using Kibana to pull reports, do data analysis, and track and monitor data about the business we are doing currently, as Kibana provides us with live data, and we can see how the transactions are doing.
I use Kibana for data analysis because it has a database of transactions that happened in the past or even today. For example, if today I want to review how one business that we are supporting is currently doing, I will pull out a report with specific items that I want to see on that report.
Something that I love about Kibana is that every analysis I run can be saved, allowing me to look at the transactions performance or the success rate and also those I can use to look at the fail rate. When I want to analyze something, I just have to change the name of the business.
What is most valuable?
The best features of Solve DevOps Elasticsearch and Kibana, in my opinion, include the graph, which I find very useful.
What I appreciate most about the graphs in Solve DevOps Elasticsearch and Kibana is the visualization, which is very easy for even someone who is a beginner in data analysis to use, and the customization also helps in making my work seamless.
Another aspect I forgot to mention about Solve DevOps Elasticsearch and Kibana is the AI Assistant, which is very good for assisting with data indexing, analyzing APIs, generating sample datasets, creating visualizations, and troubleshooting errors.
Solve DevOps Elasticsearch and Kibana has positively impacted our organization by improving our full-time resolution time and SLA, because it supports me in troubleshooting and handling reconciliation issues effectively.
Since I started using Kibana, I can say that it has improved our relationship with our partner because we are able to provide a solution in less than an hour with troubleshooting and data visualization, maintaining our SLA at 90% and ensuring customer satisfaction remains at 100%.
What needs improvement?
Regarding improvements for Solve DevOps Elasticsearch and Kibana, I feel that the full service of the AI Assistant could be available on the free version, and I think it would be beneficial to have tutorials to help users navigate the application.
I recommend that the application be made more intuitive and user-friendly, as I found it confusing the first time I was using it, and improvements in the user experience would help beginners.
For how long have I used the solution?
I have been working in my current field since 2022, as I joined the company in October 2022, and I am still working there until now.
What do I think about the stability of the solution?
Solve DevOps Elasticsearch and Kibana is very stable, and I can access it at any time of the day, with the support team always responsive whenever I need assistance.
What do I think about the scalability of the solution?
In terms of scalability, Solve DevOps Elasticsearch and Kibana can handle a large set of data very efficiently, and I would rate it a nine because it supports simultaneous access for multiple users analyzing different datasets.
How are customer service and support?
The customer support for Solve DevOps Elasticsearch and Kibana is perfect; they are always available and respond promptly whenever I reach out.
I would rate the customer support an 8 out of 10.
Which solution did I use previously and why did I switch?
Previously, I used advanced Excel, but I found it to be very limited, as Kibana has made it easier for me to analyze large sets of data with just a few clicks to get the graphs and visualizations I need.
What was our ROI?
I can see a huge return on investment with Kibana, as it saves time and money by eliminating the need to hire more people due to its ability to efficiently handle data analysis.
Which other solutions did I evaluate?
My company decided to provide us with Solve DevOps Elasticsearch and Kibana, so I did not evaluate any other options before choosing it.
What other advice do I have?
I would advise others looking into using Solve DevOps Elasticsearch and Kibana to go for it, as it has significantly improved our working conditions by saving time and effort and is easy to use, making it possible to train new users easily to become data analysts. I would give this product an overall rating of 8 out of 10.