Accelerate Amazon ECS performance: Deep-dive troubleshooting with end-to-end observability
Three-dimensional monitoring with IBM Instana—combining distributed tracing, infrastructure visibility, and code-level profiling for Python applications on AWS Fargate
Python container performance: Find and fix bottlenecks
Writing efficient code is a skill that developers must polish through experience, at the core of which lies a need to provide them with the right tools to understand how the code they’ve written performs in the various environments where it will ultimately run.
As tech stacks, application packaging and runtime environments evolve, the toolchains and workflows required for builders to efficiently instrument, debug and optimize their applications also requires continuous change.
To demonstrate this challenge, in this article you will learn why performance bottlenecks occur in Python-based containerized applications and different methods for finding a bottleneck, such as performing deep analysis on a trace. You will also learn various strategies to fix the problem and best practices you can follow to ensure you are building performance in your process.
Let’s dive in.
Where most performance related technical debt comes from
In an enterprise organization, the application or feature development typically starts with the proof of concept (POC). A business user gets a brilliant idea that might improve user experience or bring in more money. The development team quickly starts building a prototype and is eager to show that they can do it! As soon as the POC is a hit, the business demands that they add it into an upcoming sprint to move it to production. The humble feature makes it to production amid bug fixes and other user stories. The initial release does not focus on identifying how many concurrent users this feature can handle or how much performance will deteriorate because of this feature. The business just wants to see if end users can benefit from the feature.
When issues/bugs are fixed
Not just new features but bug fixes and patches also go through a phase of urgency. “You need to fix this Priority Zero (P0) and move it into production ASAP”—does that sound familiar? No time to focus on their impact on performance; just fix it and fix it now. When a brave developer points out the possibility of how a feature could perform better if more time were invested in it, a ticket gets created, which finds its way to the backlog bucket. And we all know what happens to non-priority backlog tickets—they only ever see the light of day if the team hasn’t got much to work on. And that it's almost never the case!
Gap: Lack of performance mindset
People, processes, and technology that shape the product are as important as the code that runs in the background. Each team is unique, and although there are fantastic mechanisms such as Agile, which act as guides for everyone, the workings of the team depend on the senior member’s background, experiences, and learning, making each team a unique team. Unfortunately, many leaders either don’t have the bandwidth to invest in performance culture or are afraid to push back against business users, who sometimes are their managers, who don’t get tech. It’s a tricky spot to be in as a senior team member. For all these primarily social reasons, product performance suffers. The initial feature and subsequent edits made to the feature introduce inefficiencies in the code. Over time, the technical debt due to suboptimal coding practices leads to performance issues.
So what’s the right solution?
Two things need to be done. The first one is to address the performance bottleneck, and the second one is to make sure your team has a performance monitoring mindset built into your processes. Taking this two-pronged approach will address the issue in the short term and build robust products that perform better than customer’s expectations—and keep your brand just a bit safer from the wrong kind of publicity.
Let’s explore fixing the performance bottleneck first. There could be several factors affecting performance, such as:
Infrastructure issues such as CPU, memory, storage, or bandwidth.
Interactions between microservices and other components of the application.
Inefficient code or algorithms used.
Hunting down the bottleneck causing the performance issue can become a simple with a tool that provides necessary monitoring capabilities on three dimensions:
End-to-end execution visibility via a trace.
Deep infrastructure visibility of the component causing the bottleneck.
Process profiling support so you can dive deep into an exact line of code bottlenecking the process.
Let’s explore a tool together that provides all these capabilities and can uplevel your team’s performance mindset.
Choosing IBM Instana for AWS ECS Observability
To choose the right tool for the use case, I look for proven capabilities that suit the job at hand and have low barriers to getting started. For this project, we need tracing, infrastructure monitoring, and profiling features for custom code to locate potential performance bottlenecks. I also look out for tools featured in the Gartner Magic Quadrant for Observability Platforms to help validate they have the feature set I need and that the vendor is invested in continued development. As an Amazon Web Services (AWS) user, finding a pay-as-you-go product in AWS Marketplace with a free trial helps me establish my proof of concept without upfront costs. Then I can pay for consumption using AWS billing without having to go through a lengthy procurement process. IBM Instana Observability meets both of these requirements while providing access to extended support for all integrations and monitoring in my AWS environment.
Let’s take a look at how it works.
End-to-end view of your application
Locating a bottleneck requires an end-to-end view of executions. A trace really helps you get an end-to-end view which can help you locate the root cause of the delay. As you can see in the following trace, the GET API call takes 10 milliseconds of which 8 milliseconds are consumed by the SQL query.
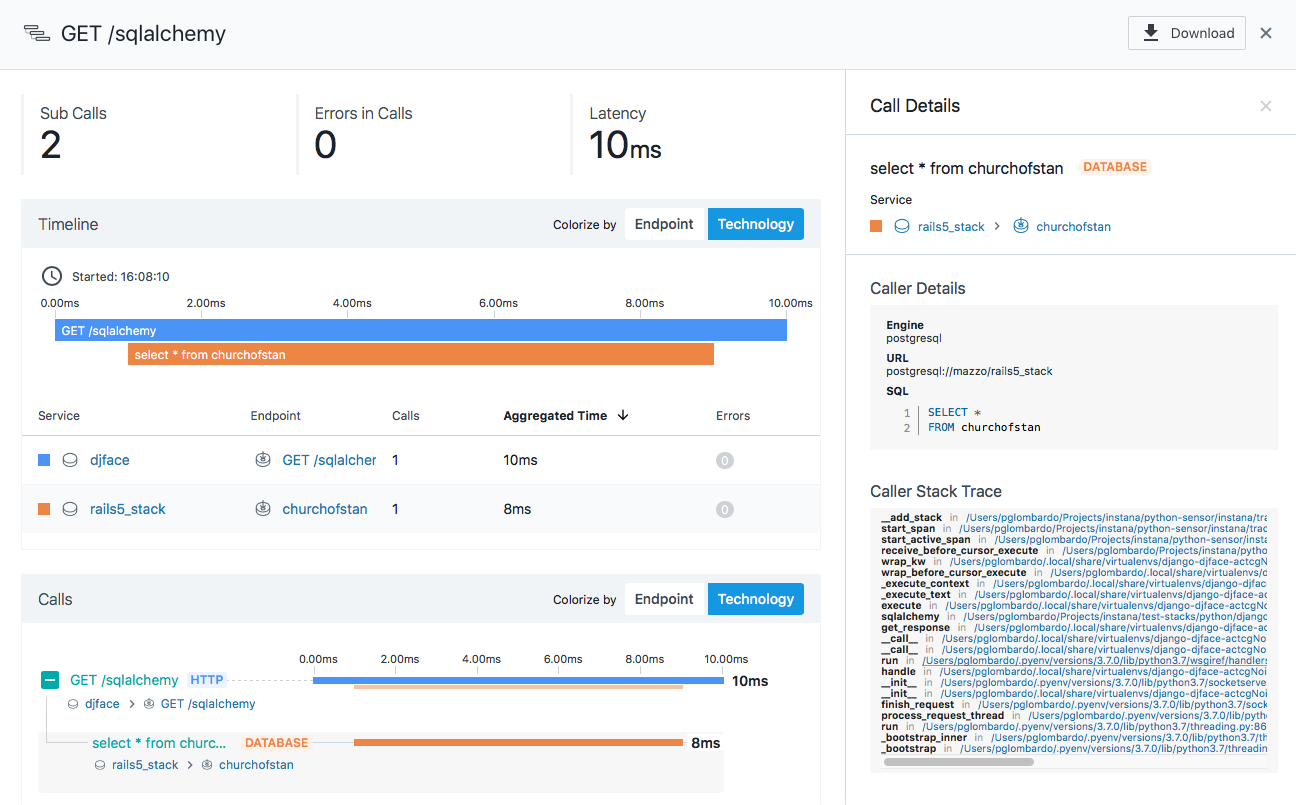
By diving deep into a trace, you can identify which microservice is the slowest, and once you have identified that, you need to explore two things:
Is the slowness due to the lack of infrastructure? Is the demand peaking?
Is the issue really because of the way the code was written, inefficient data structures that were used, or something else altogether, such as the network?
Review the Infrastructure of the microservice causing the bottleneck
Figuring out the infrastructure usage is straightforward. Imagine your application runs on ECS Fargate, and you want to debug the code. You can use Instana Python Fargate collectors to monitor it. The package is included in the standard Instana Python Package and detects ECS containers running on AWS Fargate.
Installing and configuring Python Fargate collector (included in Instana Python Package)
Here are the installation steps you need to perform on your docker container. The first command installs the Instana Python package, automatically collecting key metrics and distributed traces from Python processes.
pip install instanaThe following command sets an environment variable that activates the Instana package without any code changes.
export AUTOWRAPT_BOOTSTRAP=instanaThe next step is to configure the INSTANA_ENDPOINT_URL and INSTANA_AGENT_KEY environment variables in the task definition of the ECS task. They tell the Instana Python Fargate collector to send the metrics to the right endpoint for your customer ID.
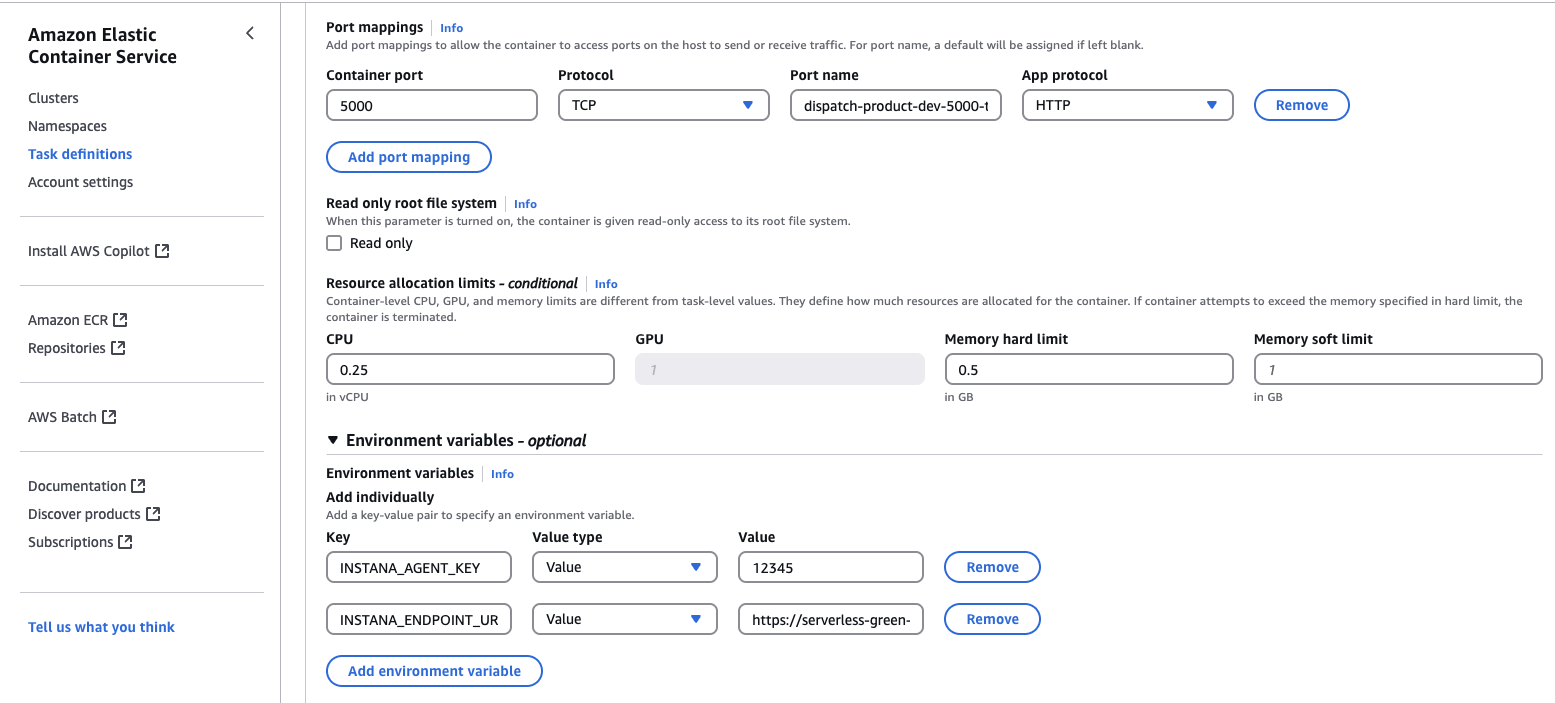
After making these configurations, when you open the Instana portal, you can see the newly spawned container’s infrastructure stats.
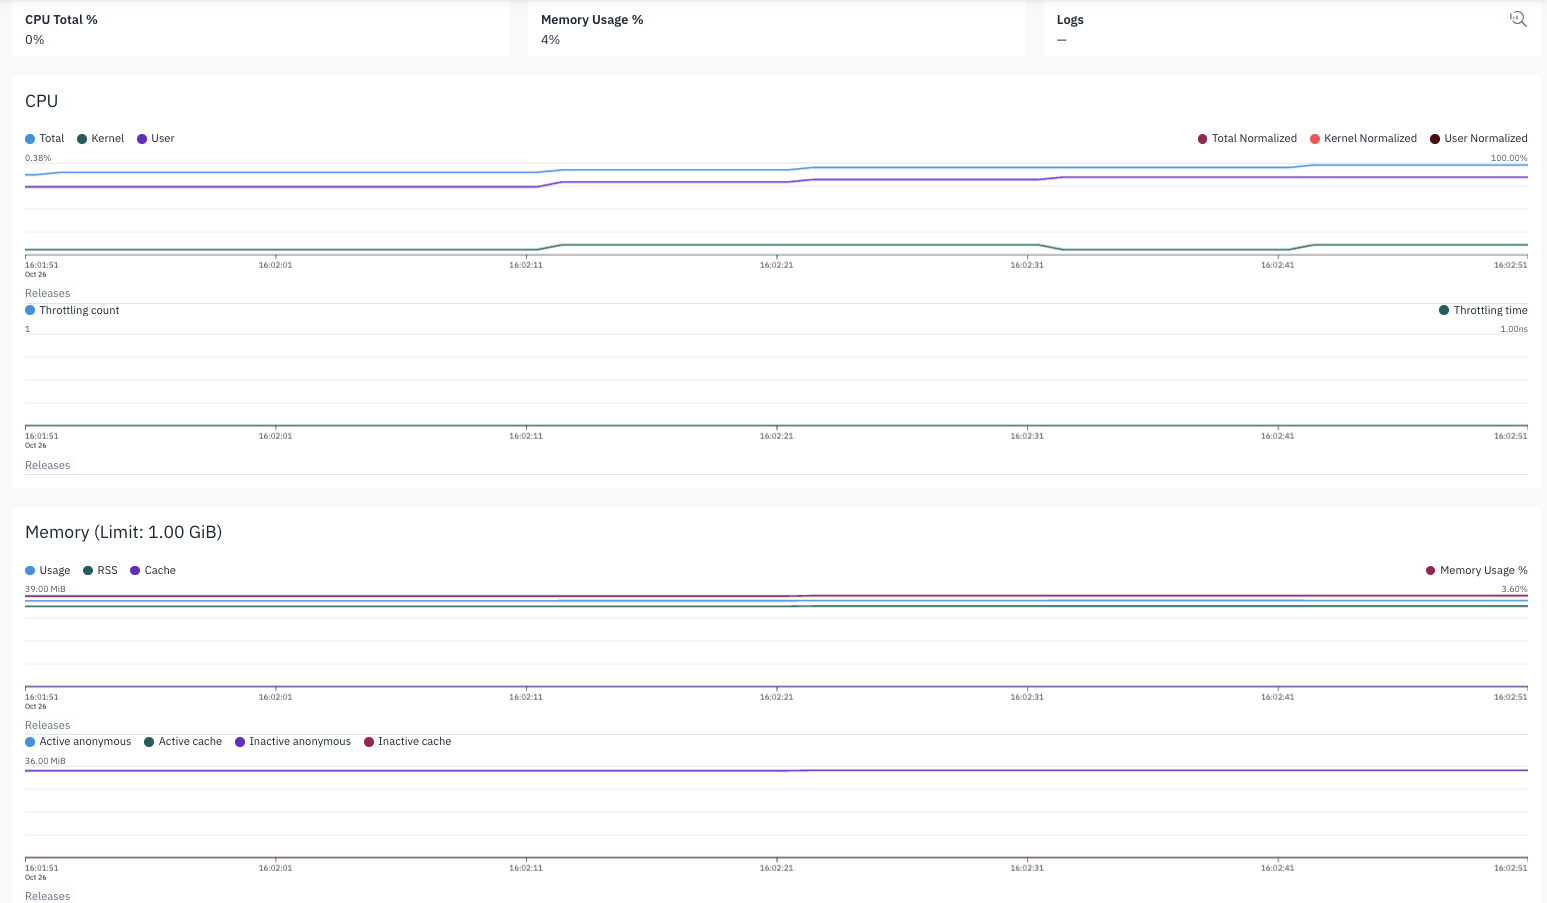
This report does not indicate any infrastructure issues, which means something else must be going on in the code. The code must be profiled to determine the exact root cause of the bottleneck.
Profiling custom code
IBM Instana provides process profiling via IBM Instana AutoProfile™ feature. While the feature is handy and creates useful profiles, if your microservice is written in Python and you want to dive deep into a specific code you can use IBM Instana’s Python Tracing SDK.
As you can see in the following sample code, you can import a tracer and manually start a span. This span information is automatically synced with your Instana account and associated with an execution in the trace view.
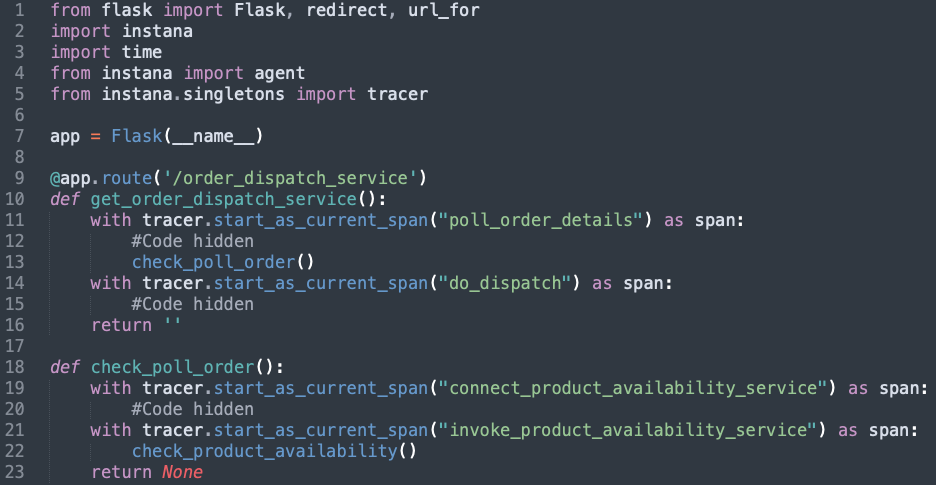
After adding the instrumentation and deploying the docker container, here is the trace view of an execution.
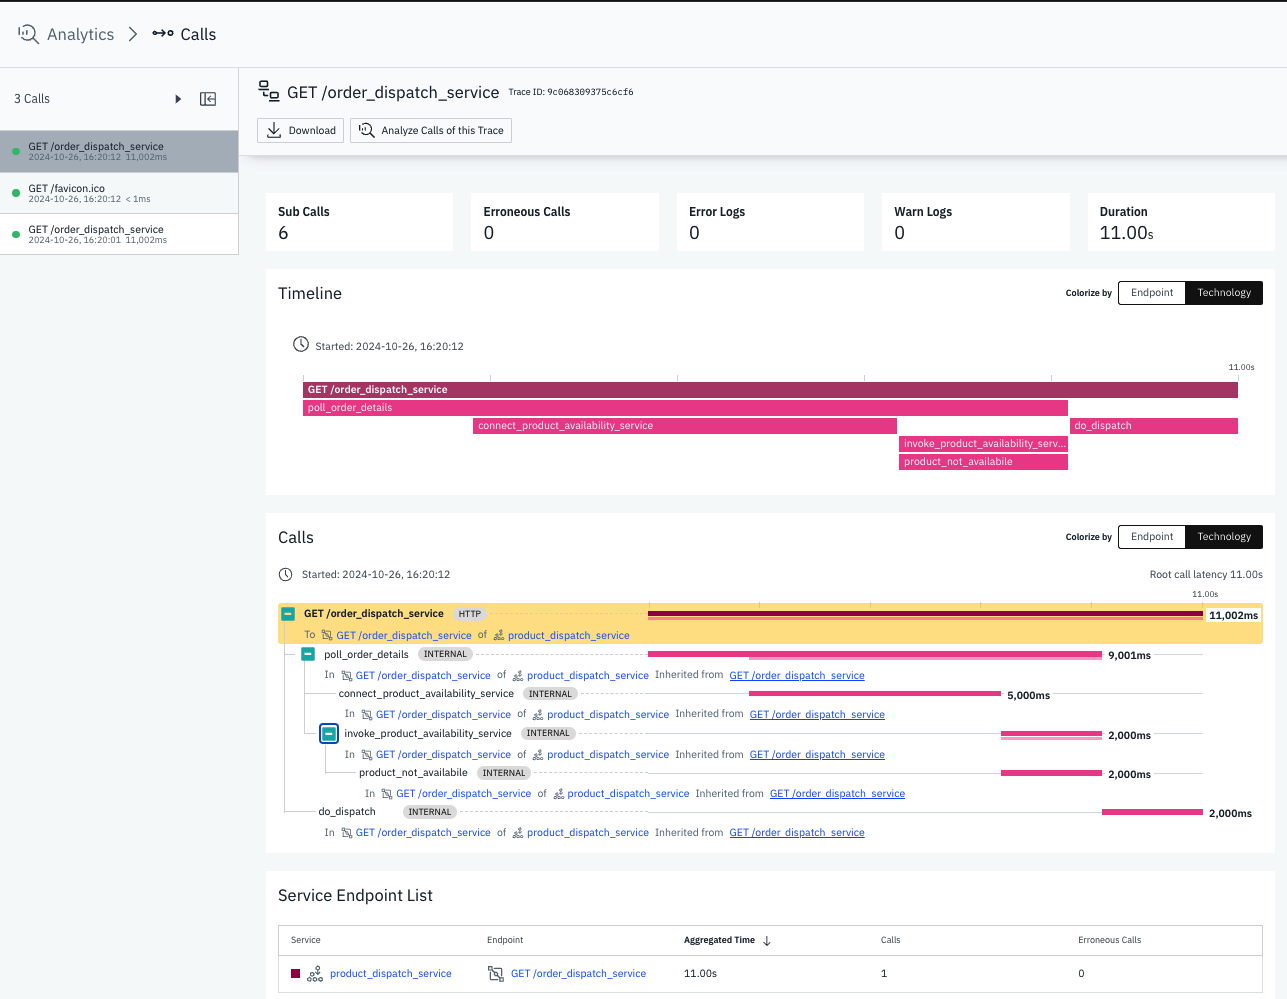
For most of the function call traces, the time taken seems appropriate except for the five seconds taken by the code connecting to the third-party service. In this case, after debugging the issue further, it turned out to be a network-related issue and the solution was to optimize VPC’s routing and implement connection pooling so it reuses connections instead of creating new ones.
Strategies you can use to improve performance
In my experience, here are some popular strategies you can use:
Purpose-built algorithms: Choose algorithms and data structures meant for the purpose. Take a closer look at the time complexity of the algorithm used and identify alternatives that can do the same task quicker with lesser memory overhead.
Loop optimization: Optimize loops and objects created within them. Look at inner loops closely as the time complexity becomes O(n2) or more.
String class optimization: If you are doing string operations, use classes that are optimized for the purpose. Strings have a nasty reputation when it comes to using memory.
Garbage collection settings: Optimize garbage collection settings to minimize pauses and improve overall performance.
Batching operations: See if your program is configured to use the entire available memory. Watch out for cases where resources are allotted, but the process does not use them. Minimize I/O operations by using caching, asynchronous I/O, or batching operations.
Pooling DB connections: Use pools when connecting with databases and other components that require connections to be made.
Refactoring: If you think refactoring code will provide performance benefits, go for it.
Consider asynchronous tasking: Not all tasks need to be done in a synchronous manner. Use components such as Message Queues to offload processing.
Check I/O ops: Review and fix blocking I/O operations.
By combining these strategies, you can significantly improve the performance of your applications and provide a better user experience.
Conclusion and key takeaways
You just learned how to improve the performance of your code using a tool such as IBM Instana Observability to analyze different layers of your application and use features such as traces, infrastructure reports, and process profiling to locate any performance bottlenecks.
Here are some performance optimization recommendations you can take away for your next project:
Build a performance-first mindset in your team, and before you release new features to production, ensure you performance test them and understand their behavior under load.
Use tools such as IBM Instana AutoProfile™ to configure continuous performance testing, at least in your lower-level environments. This will ensure that you catch performance bottlenecks happening inadvertently.
Raise the code review bar of your team so reviewers look not only for common things such as naming conventions and language-specific loopholes but also keep a close eye on snippets that might degrade performance.
And finally, set up the right alerting and logging mechanisms so that a comprehensive observability tool such as IBM Instana informs you about these issues before your customers do.
If you haven’t started yet, give IBM Instana Observability a try for free in AWS Marketplace using your AWS account.
Why AWS Marketplace for on-demand cloud tools
Free to try. Deploy in minutes. Pay only for what you use.
Launch directly into your AWS environment
Featured tools are designed to plug in to your AWS workflows and integrate with your favorite AWS services.
No sales cycles—start building right away
Subscribe through your AWS account with no upfront commitments, contracts, or approvals.
Free trials help you evaluate fast
Try before you commit. Most tools include free trials or developer-tier pricing to support fast prototyping.
Usage-based pricing, billed through AWS
Only pay for what you use. Costs are consolidated with AWS billing for simplified payments, cost monitoring, and governance.
Curated tools built for cloud engineers
A broad selection of tools across observability, security, AI, data, and more can enhance how you build with AWS.