Cloud Cost Optimization Through Observability
Cloud adoption is at an all-time high; the number of organizations leveraging the cloud for innovation and agility keeps a solid growth pace that has not slowed down for the past decade. And with that adoption, we’ve also seen a variety of stages of how technology has evolved, from traditional lift and shift operations that attempt to bring legacy applications into the cloud with minimal change to their architecture, to new services being built following cloud-native principles and with observability built-in from the start. Nevertheless, many teams and organizations are struggling to realize the true cost-saving potential of the cloud and leadership is looking to solve that problem.
In this article, you will learn how observability and telemetry lie at the core of understanding and optimizing your cloud spend without negatively affecting - and even improving - your application’s ability to scale and deliver a better user experience.
Let’s look at a real-life experience from my past as an example scenario. When working for a startup several years ago, I was asked to optimize the cost of our web application: identify and optimize the architecture of the cloud native application.
An observable application is an optimizable application
So, how do you know if your application is using just the necessary resources it needs to provide reliable service to users? Defining 'necessary resources' is challenging in cloud environments since applications depend on numerous managed services within intricate and interconnected architectures.
In addition, the cloud provides limitless scalability. Understanding an application's baseline performance and cost of all the systems it relies on is crucial. This serves as the foundation for making informed decisions about where optimizations can occur, both in terms of enhancing performance and reducing operating costs.
Understanding the performance of your application
When it comes to monitoring complex cloud environments, understanding the performance of your applications requires a holistic view of all the components involved. Combining data from various sources can help you gain in-depth knowledge of your application's behavior. You can correlate application metrics with resource utilization data to identify bottlenecks and pinpoint the root causes of performance issues.
Monitoring requirements vary depending on the components you're using. For containerized applications, you need to track container health and status. For serverless functions, you can monitor invocation times and durations. For databases and queues, you analyze performance metrics like query execution times and message processing times.
Effective monitoring requires gathering data from multiple tools and finding a way to correlate it into insights.
Achieving system observability
This is where observability solutions excel. The right observability solution will streamline the data-gathering process and provide a unified view of the entire infrastructure. Some key capabilities that are expected from mature observability tools are:
Identify spikes proactively: Alerts and notifications when your cloud spending shows unwanted trends.
Predictive outage prevention: Gain predictive insights on application behavior and prevent crashes.
Cost analysis and insights: Knowing where your cloud costs stem from is crucial for optimization.
We’ll get to how I landed on my observability tool of choice for this project but first, let me tell you more about the application.
Application architecture
The application primarily runs on two Amazon EC2 instances and an Amazon S3 bucket. One Amazon EC2 instance hosted the website, and the second instance processed images. Although our stack was server-based, we knew it would soon need to be moved to a serverless one.
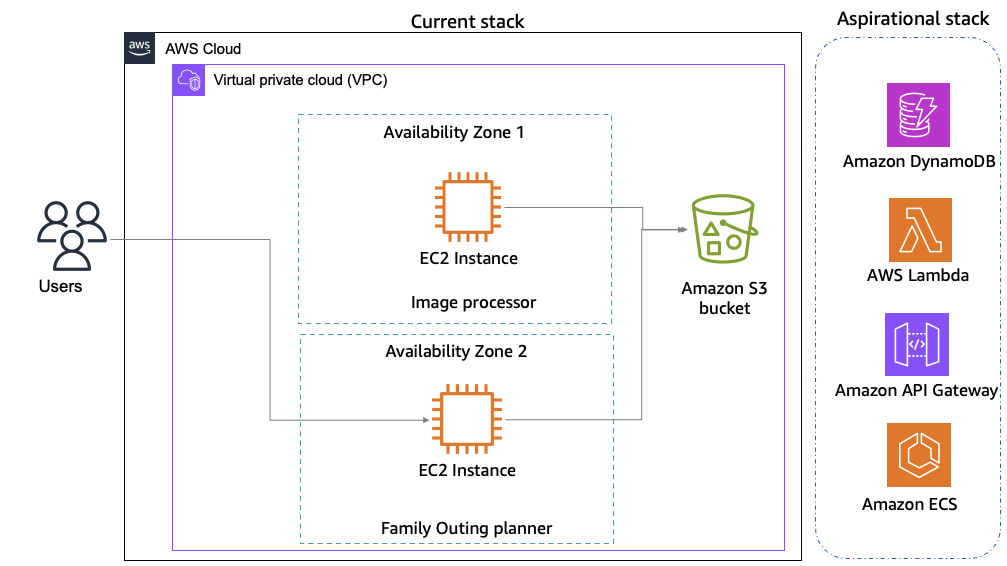
So, the task was not only to find a tool that would meet our current requirements but also accommodate future requirements.
Choosing the right tool for the job
After some time researching and evaluating potential options, I landed on New Relic as a good fit for this use-case.
New Relic’s Intelligent Observability Platform uses observability and telemetry data to monitor and observe application performance as well as to optimize cloud spending and provide forecasts with intelligent insights and recommendations.
New Relic's industry proven versatility in application performance monitoring and its broad integration capabilities with AWS services aligned well with my current application architecture. New Relic offered over 750 integrations, which could potentially cover all my AWS services, both current and future. For my existing setup, it provided monitoring capabilities for Amazon Virtual Private Cloud (VPC), allowing me to track network traffic and identify potential security risks. It also offered performance monitoring for Amazon EC2, including utilization and cost metrics to assist with right-sizing instances.
Furthermore, as we were considering our next architecture evolution towards serverless, New Relic's features stood out. It offered monitoring capabilities for AWS Lambda functions, containerized applications running on Amazon ECS, and NoSQL databases like Amazon DynamoDB. These features would connect with our AWS services to provide the telemetry and visibility needed for continuous optimization as we transition to a more modern architecture.
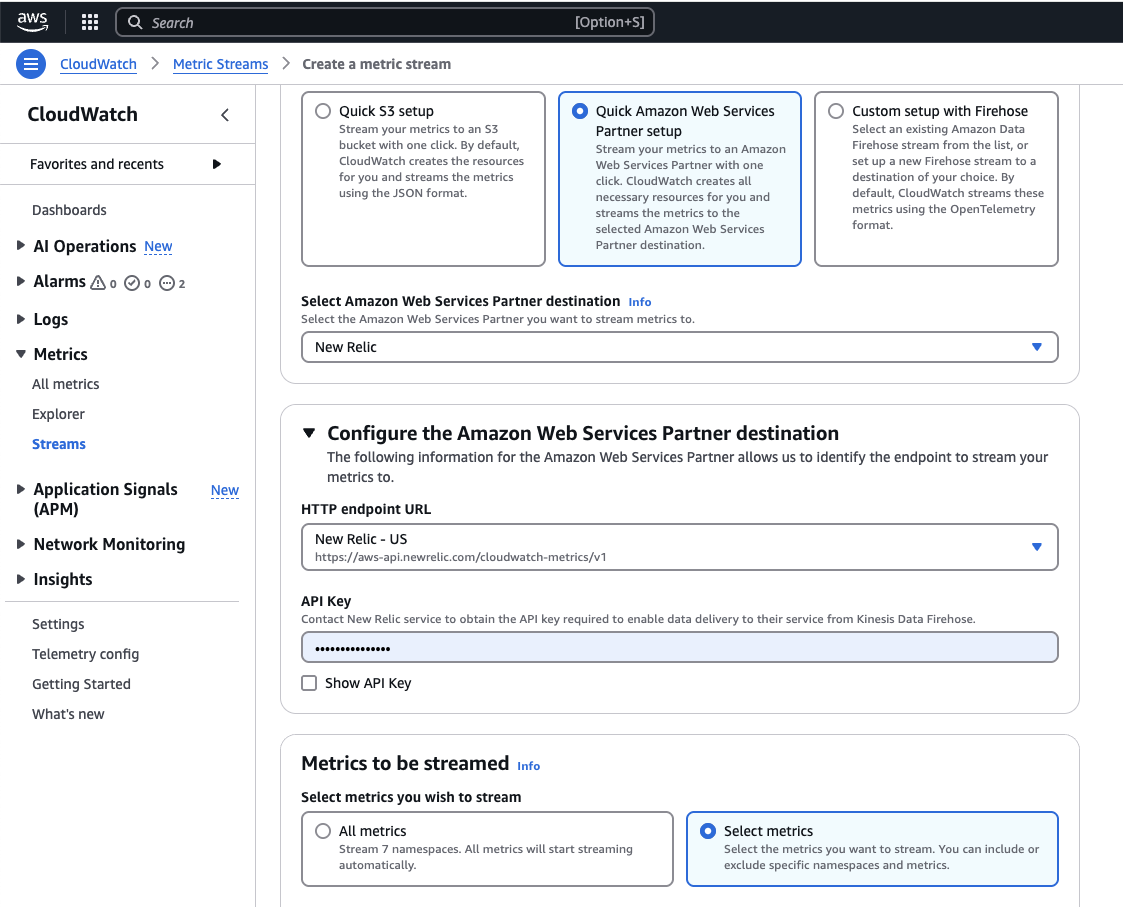
To get started, I signed up for New Relic in AWS Marketplace with my AWS account. I liked that I could start free and then pay for consumption with AWS billing if it worked out as intended. After a couple of clicks in the Amazon CloudWatch Metric streams console and the New Relic console, I was good to go.
Integrating New Relic with the AWS services you need is easy. It integrates with Amazon CloudWatch Metric Streams to pull data from Amazon CloudWatch into the New Relic environment. With a request ID associated with your end-to-end workflow, you can track and see the performance of the whole application, which helps you understand and fix issues better. With NRQL queries, you can join different datasets and get insights relevant to your applications. Amazon CloudWatch Metric Streams console has native integration with New Relic, which makes the setup easy.
curl -Ls https://download.newrelic.com/install/newrelic-cli/scripts/install.sh | bash && sudo NEW_RELIC_API_KEY=<API KEY> NEW_RELIC_ACCOUNT_ID=<AccountID> /usr/local/bin/newrelic install
Performance monitoring with New Relic
Amazon CloudWatch Metric Streams can stream Amazon EC2 and Amazon S3 instance-related metrics, among many others. However, in addition to the metrics provided by Amazon CloudWatch, I also needed memory metrics to make more well-rounded decisions about optimal Amazon EC2 instance size. Memory metrics require an agent to be installed on each resource. I deployed an agent on both Amazon EC2 instances using the following script.
curl -Ls https://download.newrelic.com/install/newrelic-cli/scripts/install.sh | bash && sudo NEW_RELIC_API_KEY=<API KEY> NEW_RELIC_ACCOUNT_ID=<AccountID> /usr/local/bin/newrelic installIn no time, the following metrics started populating in the New Relic infrastructure view for hosts.
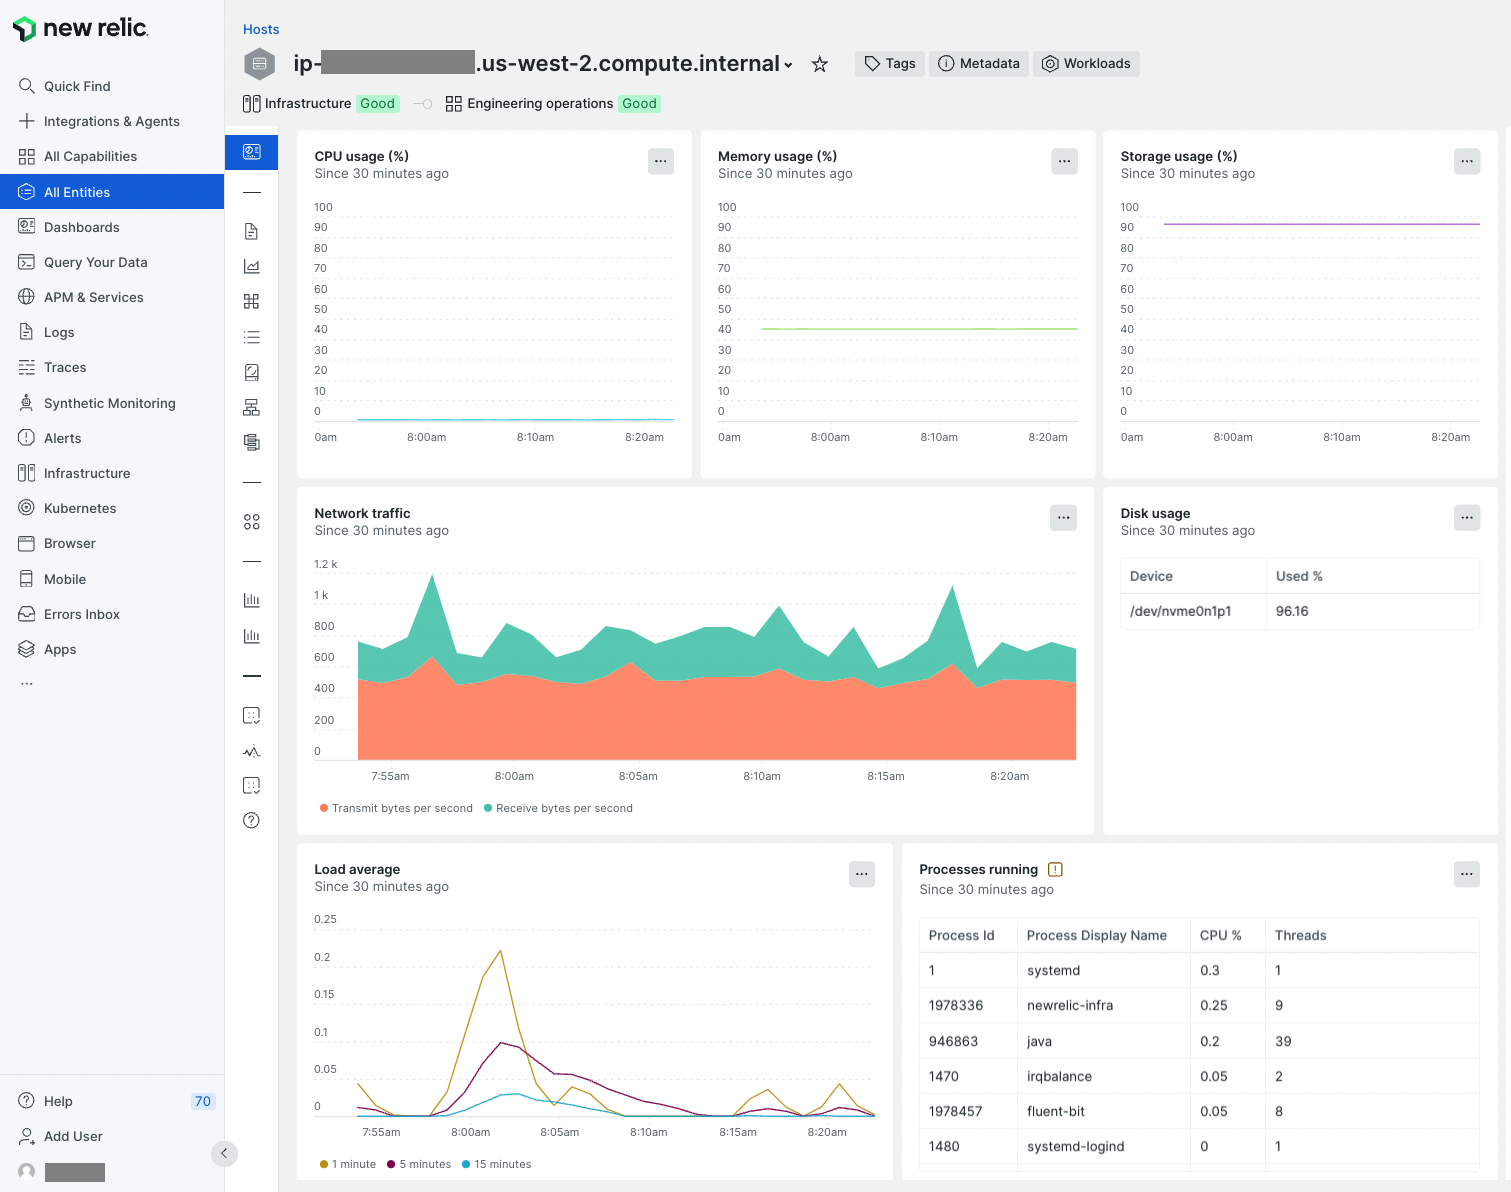
The process took less than a minute, and New Relic started showing CPU Usage, Memory usage, Storage usage, network usage, and disk usage stats in no time. These statistics clearly show that my microservice running on this host is using ~40% memory and is storage-heavy. In contrast, my application needs little CPU. This is what I was looking for. If I want to bulk analyze my applications, I would just tag my Amazon EC2 instances and run the AWS CloudFormation template to install agents.
Now that I had the data, my next step was to understand the running costs of my application and be able to provide that information in a way that will be easy to understand and use by all stakeholders, including finance.
Understanding cloud spend
New Relic has recently released the public preview of Cloud Cost Intelligence (CCI), which sounds very much aligned to the capabilities required to collect, analyze and act on cloud cost data. CCI is fully integrated with New Relic’s Intelligent Observability platform which provides a unified experience for both performance and cost insights.
Integrating CCI is also quite effortless, providing connectivity with your Amazon account as a built-in integration.
You can follow the official integration instructions to get setup with CCI, it requires an S3 bucket and a couple of IAM configurations. Very quickly I was able to see cost data and insights:
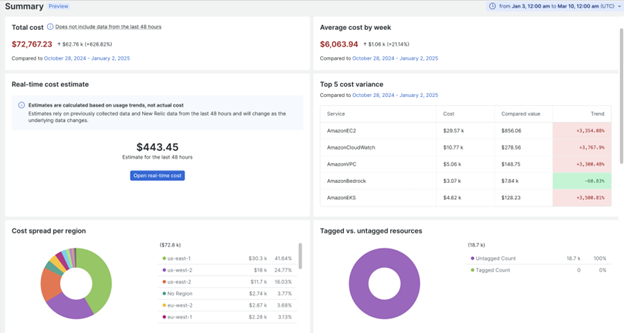
A key value of New Relic’s expertise on dealing with streaming telemetry data as well as the powerful New Relic Query Language (NRQL), is that CCI provides real-time cost visibility and huge flexibility in the timescale into which data can be analyzed.
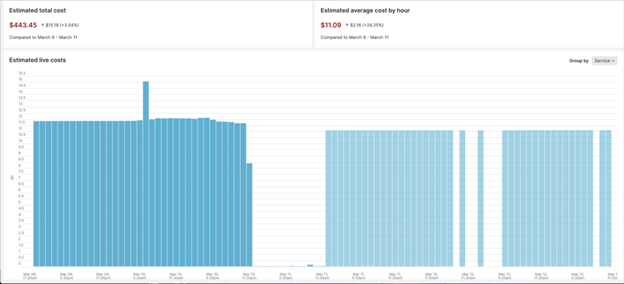
Overall, key capabilities are:
Comprehensive visibility into cost drivers: Gain detailed insights to understand the key factors driving cloud spend, enabling smarter decisions and strategic planning.
Linking costs to deployments and changes: Track how deployments and environment changes impact costs, allowing for precise management of financial fluctuations.
Proactive alerts and notifications: Stay ahead of budget issues with real-time alerts, helping to avoid overspending and maintain financial control.
Custom cost allocation: Categorize cloud spending to easily manage and track budgets across departments or initiatives.
Kubernetes cost optimization and recommendations: Receive tailored recommendations for optimizing Kubernetes usage, reducing unnecessary costs, and boosting efficiency.
Intuitive, customizable interface: Access a user-friendly interface that can be personalized to streamline workflows and improve efficiency.
It is also very interesting how New Relic is integrating AI algorithms into their platform, which allows a whole new range of ways to leverage their solution, including predictive analytics and gaining insights conversationally.
Key takeaways
By using New Relic to gain deep visibility and leveraging Cloud Cost Intelligence to understand cloud spend, I was able to quickly find ways in which my application and infrastructure could be optimized.
Here are some final takeaways I recommend bringing to your own projects:
Monitor resource utilization, look especially for underutilized resources, and use the right tools, such as Cloud Cost Intelligence, to identify the right footprint for your applications.
Identify which resources are charging you the most and use best practices such as using reserved concurrency for lambda functions, using spot instances, S3 tiering, database instance types, etc., to reduce costs further
Set up alerts so you can quickly detect anomalies.
And finally, include cost monitoring and optimization as a regular activity for your team.
Sign up to try New Relic free in AWS Marketplace using your AWS account.
More resources for building on AWS
Why AWS Marketplace for on-demand cloud tools
Free to try. Deploy in minutes. Pay only for what you use.