Complexity in modern containerized software systems
Modern cloud-native applications running on AWS generate massive volumes of telemetry data across logs, metrics, traces and events. As organizations scale their containerized workloads on Amazon Elastic Kubernetes Service (Amazon EKS), achieving comprehensive visibility into application performance and system health becomes increasingly challenging. The challenge is often exacerbated by the fragmentation of telemetry data across multiple tools and dashboards. This article explores how to implement unified observability that enables Site Reliability Engineers (SREs) and DevOps teams to proactively monitor system health and rapidly resolve issues.
Challenges in implementing unified observability
Despite the benefits of modern observability, it poses several key challenges. The increased complexity of digital environments, a lack of knowledge around how to implement and maintain observability systems, and the high cost of data management, analysis and storage can be detrimental to observability efforts.
A major hurdle is data overload. Managing the sheer volume of data generated by distributed systems can be overwhelming, requiring efficient storage, processing, and analysis mechanisms. This process can also be extremely costly if not managed properly. Organizations need to understand what data is truly important and how to filter unneeded information as well as relate data from different sources and events as they traverse multiple systems.
Additionally, ensuring compatibility and interoperability between diverse observability tools and frameworks can be daunting, necessitating careful planning and integration efforts. Development teams may be using a variety of solutions like Prometheus, Elasticsearch, and Jaeger, each with its own data format and collection method. Bringing together these heterogeneous data sources into a unified view is a major challenge.
As a SRE, I am responsible for monitoring a vast number of services, containers, and infrastructure components to keep systems stable and dependable. With data often siloed across multiple tools and dashboards, it becomes difficult for me to gain a unified view of application health and performance. I need a way to monitor the health of my systems and catch issues BEFORE my customers notice. How can I address these modern observability challenges on AWS?
Solution: Overcoming modern observability challenges with Logz.io
As a SRE, I need to improve the service level objectives (SLOs) – the key performance indicators we use to define and measure the reliability of our cloud-native solutions. Our teams have been diligently adding observability instrumentation to their applications, but the fragmented nature of this data is preventing us from gaining the comprehensive, cross-application visibility we need.
This is where the Logz.io Open 360 Observability Platform can help. By aggregating logs, metrics, and traces from across our entire technology stack, Open 360 will provide a single pane of glass for monitoring and troubleshooting.
No more sifting through disparate data sources - Logz.io's centralized infrastructure monitoring capabilities can now give me a holistic view of my resources. And when issues do arise, the AI-powered troubleshooting features will automatically detect anomalies, identify root causes, and even generate recommended resolution steps. This will assist in reducing my mean time to resolution (MTTR).
In addition, the platform's cost optimization features, like the Data Optimization Hub and tiered storage options, can enable me to reduce our observability costs by up to 50% without sacrificing visibility. This will be crucial, as our observability data volumes continue to grow alongside our cloud-native deployments.
The Logz.io Open 360 Observability Platform in AWS Marketplace will seamlessly integrate with our existing AWS infrastructure, making it a natural choice to help us bridge the visibility gaps between our applications and teams. By unifying our observability data in this way, I'm confident we'll be able to make significant strides in meeting our SLOs and delivering on the promise of reliable, high-performing cloud-native services.
Collecting telemetry data
When you first login to Logz.io, you will be prompted to select how to send logs to the Logz.io platform:

Specify the AWS Services that you want to collect logs from:

Activate your collector.

Logz.io uses an AWS CloudFormation template to set up a Amazon Data Firehose that collects Amazon CloudWatch logs from specified AWS services and custom log groups, then securely delivers them to Logz.io's platform via their HTTP endpoint. The template includes Lambda functions that handle the initial setup and monitor for new log groups, automatically configuring them for log shipping. For reliability, it includes an Amazon S3 backup for any failed deliveries and sets up all necessary IAM roles and permissions. This allows for centralized log management and analysis of AWS resources in Logz.io while maintaining proper AWS security practices.
Once the CloudFormation stack deploys successfully and there are log groups in your CloudWatch, the Logz.io homepage will refresh.

On the home landing page, Logz.io will give you an overview of some of the recent events in your logs, and you can click on the investigate button to be taken to the logs for further investigation.

Additionally, you can write custom queries using Lucene to identify logs, which is crucial for us to effectively monitor and maintain system reliability. With custom queries, we can:
Create targeted searches that align with your Service Level Objectives (SLOs) and help track error budgets
Correlate data across different services and components to identify patterns and root causes of issues
Build custom metrics and aggregations that provide deeper insights into system behavior
Set up precise alerting conditions based on specific log patterns or thresholds
Generate custom dashboards that showcase key performance indicators (KPIs) relevant to your service reliability goals
For example, a query like "LogSize: [2000 TO 3000]" helps identify logs that are between 2000 and 3000 bytes in size - this type of filtering is valuable for detecting abnormal logging patterns that could indicate system issues like error dumps or logging misconfiguration while helping manage storage costs effectively.

Create an alert for Amazon EKS monitoring
Now, I will demonstrate how to connect Logz.io to an EKS cluster and create an alert to monitor the health and stability of your production workloads.
Navigate back to the Integration Hub on the left navigation panel and select Amazon EKS.

After connecting to your cluster through in your local environment or on AWS CloudShell within the AWS Console, complete the prerequisites and run this command in your environment to send your cluster’s telemetry data using one single Helm chart to Logz.io. You will notice the logs are being sent immediately after deployment.
Proper naming conventions and rich telemetry metadata are critical for effective data correlation and analysis within the Logz.io Open 360 platform. When sending your cluster's observability data, be sure to follow best practices like:
Namespacing your logs, metrics, and traces by service, environment, and other relevant dimensions
Leveraging Kubernetes-specific metadata fields like kubernetes.object.kind, kubernetes.namespace.name, etc. to provide context
Standardizing event names and failure conditions across your applications for consistent alerting
These conventions act as a common language, allowing you to connect logs from different parts of your system and build meaningful queries. For example, using "prod-" prefixes for production namespaces and standardized event reasons ("Failed", "Unhealthy", "BackOff") enables you to effectively correlate events across services, trace issues through your entire stack, and create precise alerts.
To demonstrate how well-structured metadata enables targeted monitoring, let's create an alert for critical events in production Kubernetes namespaces:
Navigate to Logs => Alerts in the left navigation panel
Click "Create a new alert"
Provide a descriptive name like "EKS Production Failures Alert"
kubernetes.object.kind:Event AND
(kubernetes.object.reason:Failed OR
kubernetes.object.reason:Unhealthy OR
kubernetes.object.reason:BackOff) AND
kubernetes.namespace.name:("prod-")
This query specifically targets production namespace events (prod-) in your EKS cluster, focusing on three critical failure conditions: Failed states, Unhealthy conditions, and BackOff scenarios, which are common indicators of service degradation or application failures in Kubernetes environments.

We can then specify the trigger conditions for this log to notify us when the number of logs in the last 15 minutes is greater than 3, and label this alert as high severity.
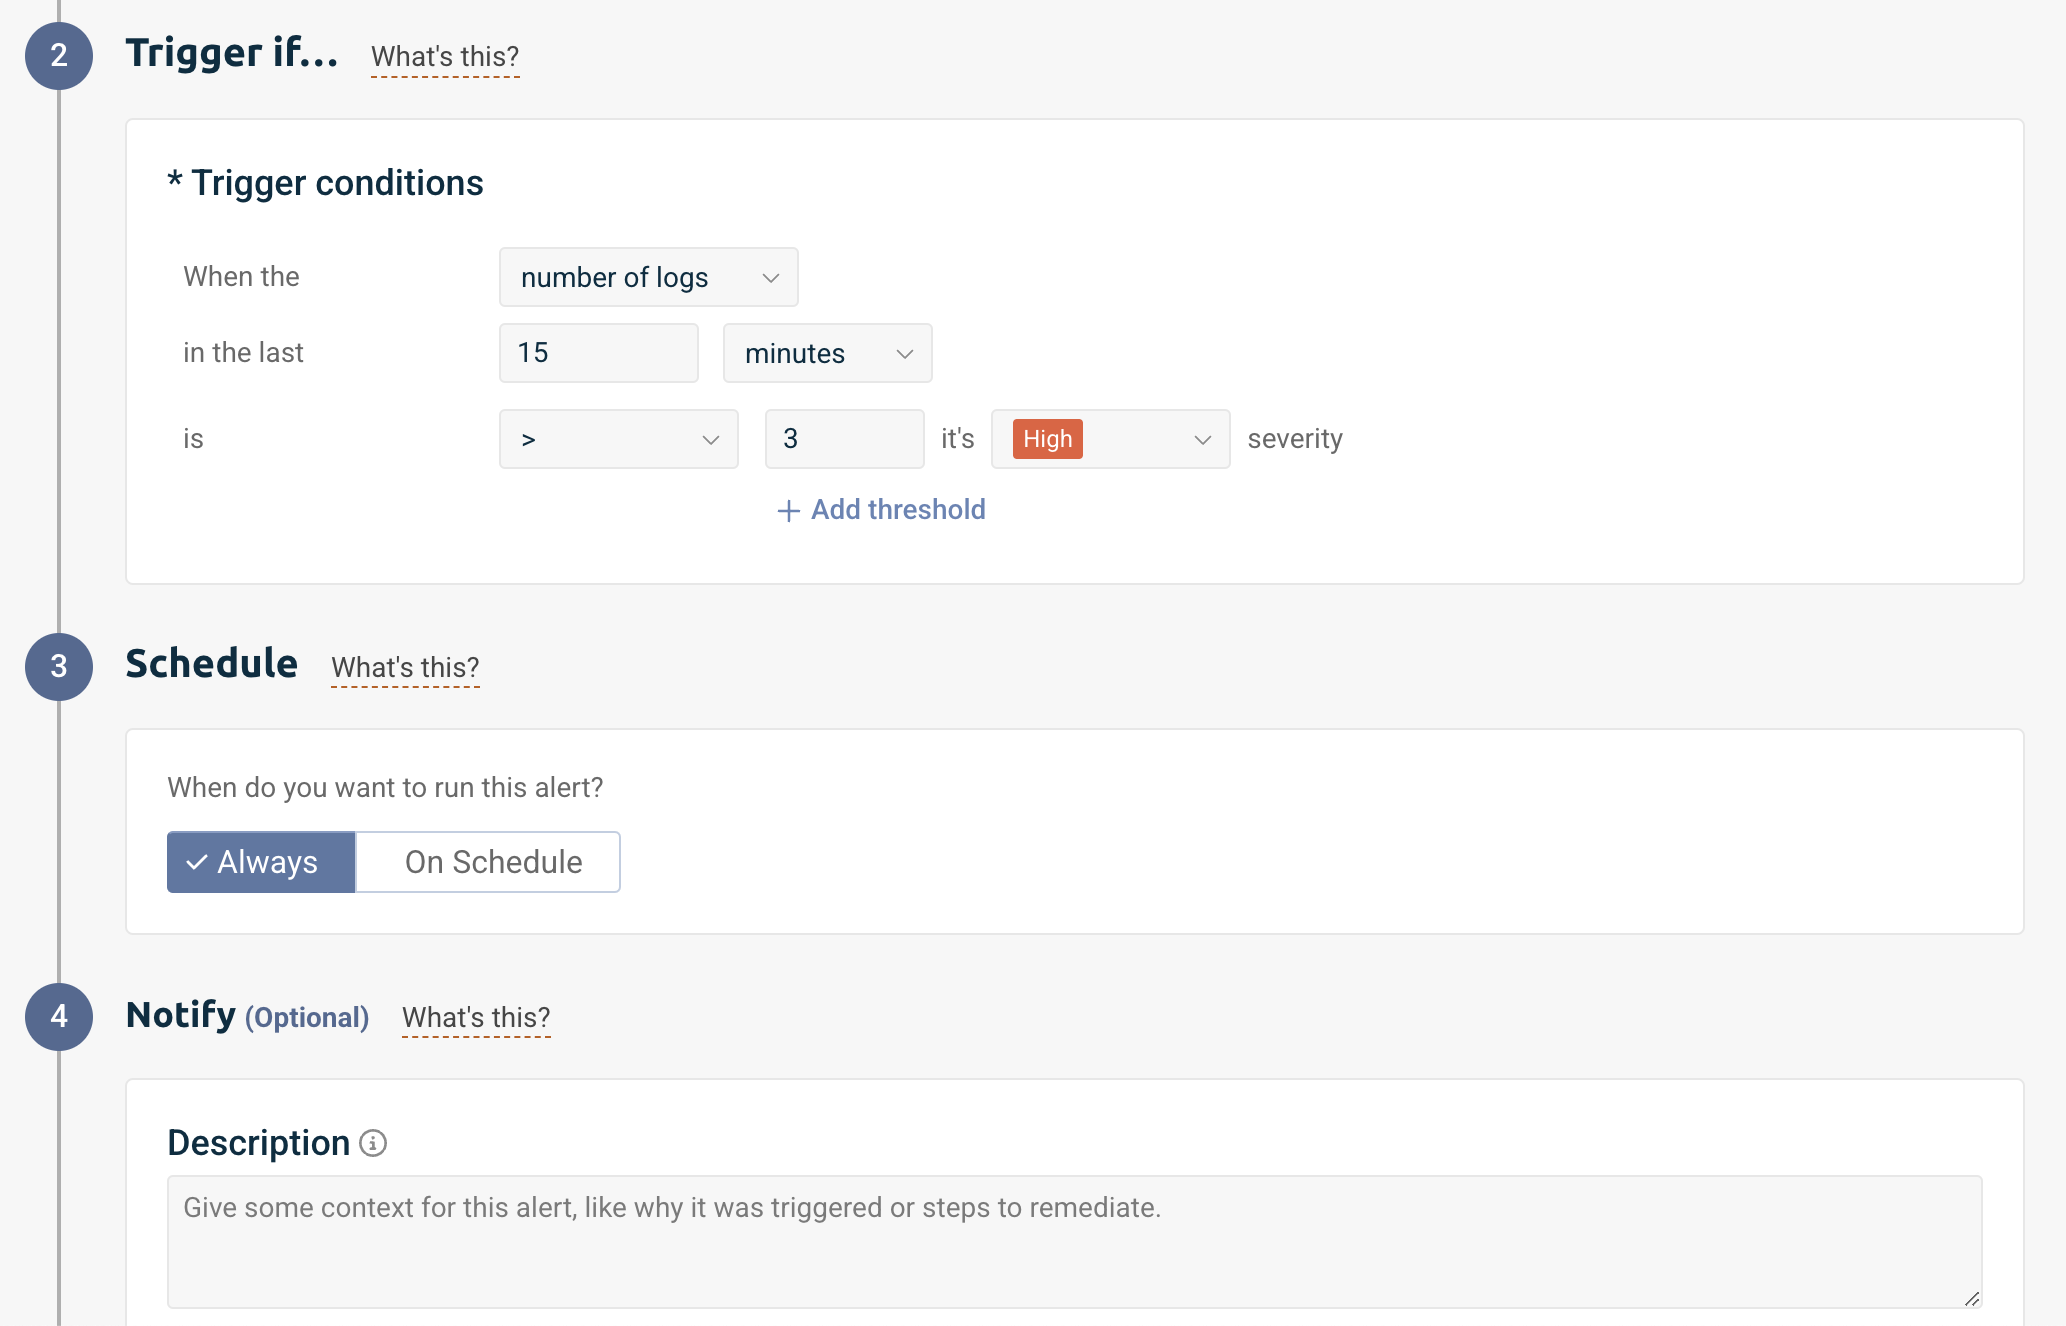
Now this alert will notify me when our specified query returns more than 3 results within a 15-minute window. As an SRE, this helps me proactively identify persistent issues in production workloads before they significantly impact our services. The query already utilizes Kubernetes metadata through kubernetes.namespace.name, kubernetes.object.kind, and kubernetes.object.reason to effectively filter and identify specific events in our production environments. The threshold of 3 occurrences helps eliminate false positives from transient failures. With this configured as a high-severity alert, I can be notified to quickly respond to potential service degradations, particularly those caused by repeated pod failures, health check issues, or crash-loop scenarios in our production systems.
Using these metrics, we can establish meaningful error budgets for our services. Error budgets are a key SRE concept that define how much downtime or unreliability is acceptable for a service over a specific time period. They help balance the competing interests of innovation (which inherently introduces some risk) and reliability. For example, our error budget policy defines that production services should maintain 99.9% reliability over a 30-day rolling window. This translates to approximately 43 minutes of allowed downtime per month. We can calculate our error budget consumption by monitoring these failure events:
Each sustained EKS failure event (3+ occurrences within 15 minutes) counts against our error budget
We weight EKS BackOff and Unhealthy events as partial incidents (0.5x impact) as they might be transitional
EKS Failed events are weighted at full impact (1.0x) as they typically indicate complete service disruption
Multiple failures within the same AWS service during the same time window are counted as a single incident to avoid double-counting
This granular approach allows us to accurately track our service reliability across our AWS infrastructure, balancing the need for innovation with maintaining stable services. By monitoring these specific failure events and their impact on our error budget, we can make informed decisions about when to push new features and when to focus on system stability and reliability improvements.
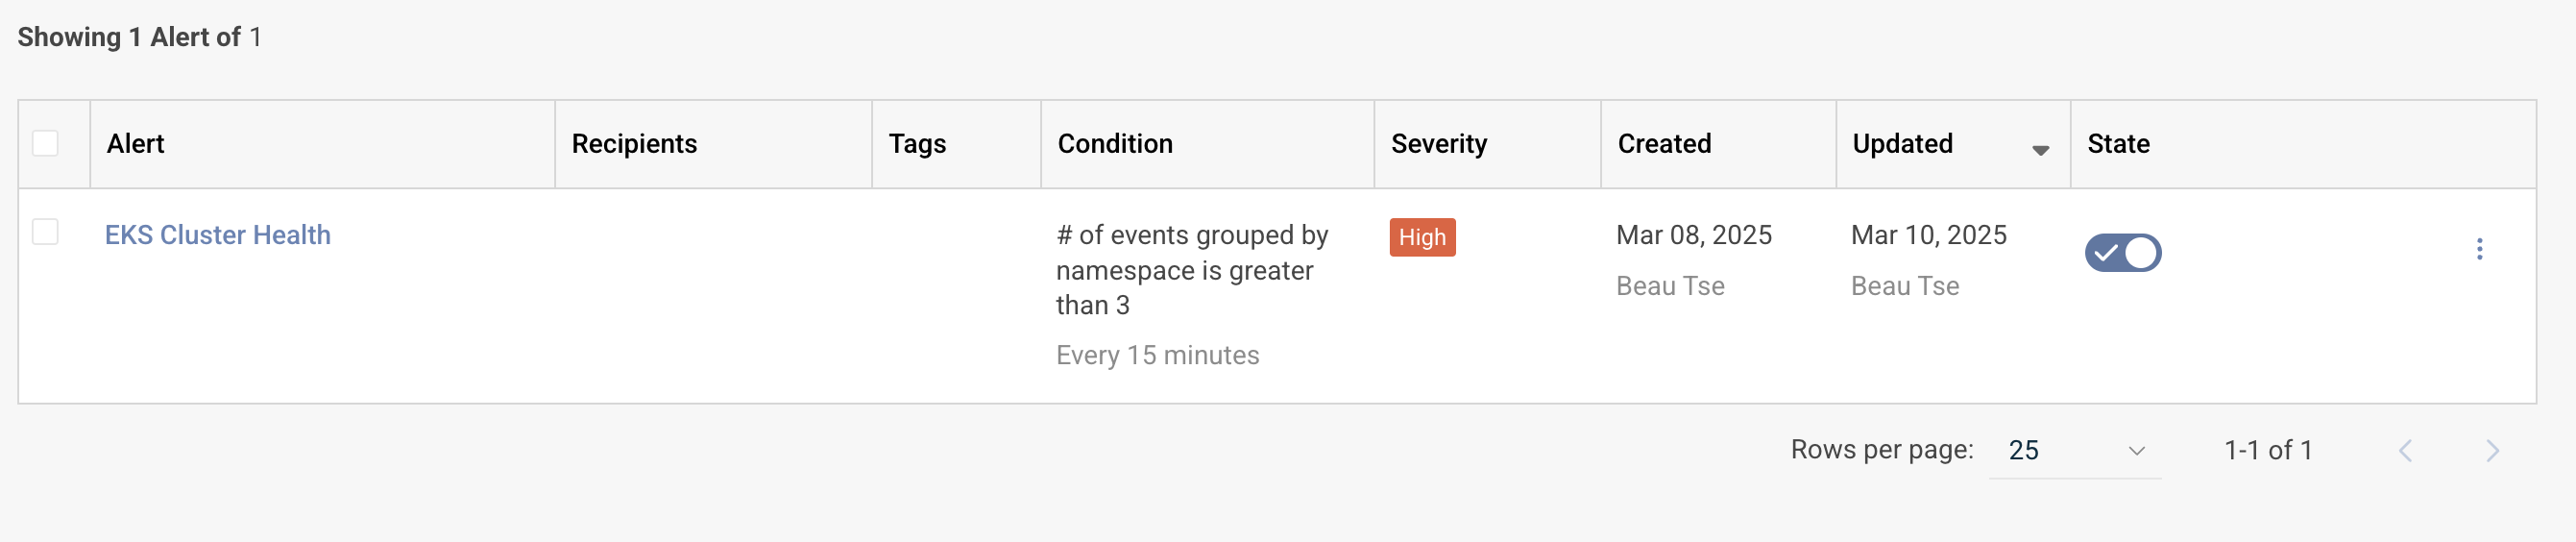
Within the Logz.io platform, you can continue to manage and create new alerts on the same page and specify recipients for each alert.
Key takeaways
Observability is critical for modern, cloud-native applications on AWS, where traditional tools often lead to data fragmentation and high operational overhead.
Logz.io's Open 360 Observability Platform unifies observability data from various AWS services, addressing key challenges faced by DevOps and SRE teams managing AWS environments.
The platform's AWS-tailored data collection options and extensive integration ecosystem enable quick deployment of a comprehensive observability solution for AWS, minimizing complex configuration and maintenance.
You can get started by trying Logz.io Open 360 Observability Platform in the AWS Marketplace with a free trial then pay-as-you-go billing through your AWS account.
Why AWS Marketplace for on-demand cloud tools
Free to try. Deploy in minutes. Pay only for what you use.