Troubleshooting Serverless Applications
Gone are the days when organizations used to simply lift and shift their applications to the cloud. Now, organizations are looking at the migration strategy from a holistic angle and are rebuilding their applications using serverless design patterns to get the biggest bang for the buck. However, serverless environments present unique challenges in monitoring and troubleshooting due to their distributed nature. DevOps teams understand that without end-to-end visibility into function execution and the ability to pinpoint a performance bottleneck or the root cause of an issue, they cannot deploy their modern applications into production.
In this article, you will learn how collecting comprehensive telemetry data, including function-level metrics, application-level metrics, infrastructure metrics, logs, and traces, can help you gain better visibility into your application. I'll show you a sample serverless application and demonstrate how to do trace exploration, helping you visualize the end-to-end execution flow. Let’s dig in.
Understanding the rise of serverless computing
You may remember when huge servers were overprovisioned for peak demand, leaving resources idle and burning money. But as it turns out, most people don't like overspending on infrastructure that doesn't always perform. In the last decade or two, microservices paved the way for a more flexible architecture. Microservices decouple services and let you split and deploy code based on their specific infrastructure needs. As microservices gained popularity, concepts like pay-as-you-go (PAYG) billing and event-driven computing became popular, and the serverless model soon became the go-to solution. In a serverless environment, the cloud provider automatically handles the provisioning, scaling, and maintenance of the underlying infrastructure for you.
In recent years, container-based functions have become a common architectural pattern. Instead of directly writing a function in AWS Lambda, you package it as a container and then run it as a lambda function. This offers you greater control over the runtime environment and dependencies. Sometimes, the end-to-end workflow you're trying to implement with serverless might require a more complex solution. For example, what if you have a set of containers that must finish execution before passing the intermediary output to a specific function or a different workflow? That's where services like AWS Step Functions come in handy; these help you create stateful workflows using serverless functions. With AWS Serverless Application Model (AWS SAM), you can quickly build and test serverless applications, as everything is templatized. Although serverless applications have certain advantages, nothing beats running these functions close to the customer location, and that's where Edge Serverless computing enters the picture.
Monitoring challenges with serverless apps
While serverless applications offer the significant benefits outlined in the previous section, they also present unique challenges arising due to the ephemeral nature of resources and the need for real-time visibility. For example:
Tracing requirements in a distributed network - Serverless applications often consist of multiple interconnected components, making it difficult to trace the flow of requests through the system. Additional complexities come into the picture when third-party services are in the flow. Furthermore, serverless functions can be triggered asynchronously, making it challenging to correlate requests and responses.
Debugging failure modes - Serverless functions can experience transient failures due to network issues, resource constraints, retry failures, or other factors. Identifying and addressing these failures can be challenging. Furthermore, many serverless applications often require synchronous and asynchronous executions to be combined to get the job done, making it essential to understand how these interactions impact performance and reliability.
Although there are complexities, the benefits of building serverless applications outweigh the challenges. To solve these observability requirements, you must first collect comprehensive telemetry for your application to solve these observability requirements.
What telemetry must I collect?
There are four basic types of telemetry you must collect:
Traces - Traces provide you end-to-end visibility of requests as they flow through your serverless functions and connected services, helping you identify bottlenecks, understand service dependencies, and track error propagation.
Function-level metrics: You must know how often your serverless function was invoked, execution throttling, how long did the invocation take, cold start times and how often they occurred, and reserved concurrency.
Infrastructure level metrics: It’s important to know how much memory was used, CPU utilization, latency, packet losses, database query performance, and third-party service execution stats.
Application-level metrics such as business KPIs and Logs.
You must collect this data into a central observability solution that follows standard specifications for tracing, metrics, and logging set by frameworks such as OpenTelemetry. Your observability solution must provide you with a comprehensive view of your application's behavior. It should allow you to identify performance bottlenecks, troubleshoot issues quickly, optimize resource utilization, and monitor user experience.
Selecting the right observability tool
Analyst reports like the Gartner Magic Quadrant can provide a solid starting point to identify potential solutions for your use case. In this case, Datadog Pro is a positioned as a leader and a good fit for our serverless application. Datadog Pro stands out due to its cloud monitoring suitability for modern application architectures. What’s notable about Datadog Pro is that it provides both security and observability in a single unified SaaS-based platform that can monitor cloud-based applications while providing real-time threat detection. Datadog Pro integrates with 100+ AWS services, including AWS Step Functions, Amazon DynamoDB, Amazon API Gateway, Amazon CloudWatch, and AWS Lambda.
Datadog Pro for serverless applications
I subscribed to Datadog Pro in the AWS Marketplace and started exploring during the 14-day free trial. It turns out that Datadog Pro has a strong integration with AWS Lambda that includes monitoring of metrics, logs, and traces. It also has a lambda library and a new, optimized Datadog Pro extension with minimal instrumentation overhead, which you can use to send traces from your AWS-based serverless application to Datadog Pro.
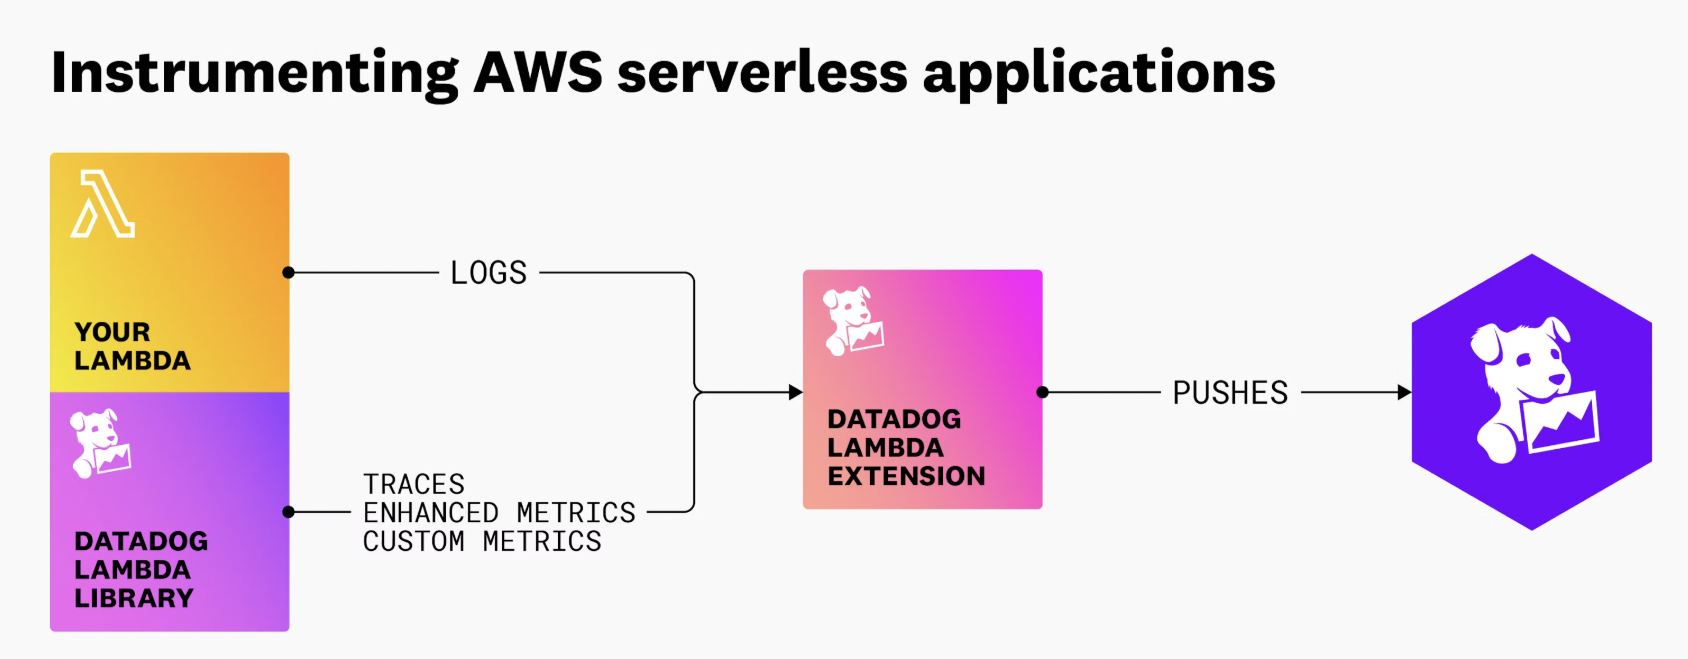
Tracing an actual serverless application in Datadog Pro
You can easily get the end-to-end tracing experience during the trial, so you get a feel for the experience. I tried it out using a sample serverless app available on GitHub, which shows how to use Datadog Pro to enable end-to-end visibility into an application.
Let's explore together!

Here is some quick background about the application: the application uses an Amazon API gateway as a front end. It has four APIs: 1) Create, 2) Update, 3) Delete, and 4) Get. At each event, Amazon DynamoDB is updated to ensure that the latest and greatest information is available for each product. Here is the diagram that shows the overall workflow.

During the product’s write events (Create, Update, Delete) activities, an event is published to Amazon Simple Notification Service (Amazon SNS), which ultimately lands in an Amazon Simple Queuing Service (Amazon SQS) queue for further downstream processing. This SQS queue is watched by a lambda, which triggers an Amazon EventBridge notification whenever a message is added to the SQS queue.
There are two other services: an inventory service that starts the stock ordering workflow after confirming that the event is semantically correct, and the analytics service, where the magic happens; it increments a metric inside Datadog Pro, depending on the type of event received. Both lambda functions are configured to use Datadog Pro for monitoring and tracing via AWS Lambda Layers.
Ok, now we are ready! Let’s invoke the application so we can explore how Datadog Pro tracks and shows an in-depth view of a request.
After invoking the application, I see a trace getting populated in Datadog’s Traces Explorer view.
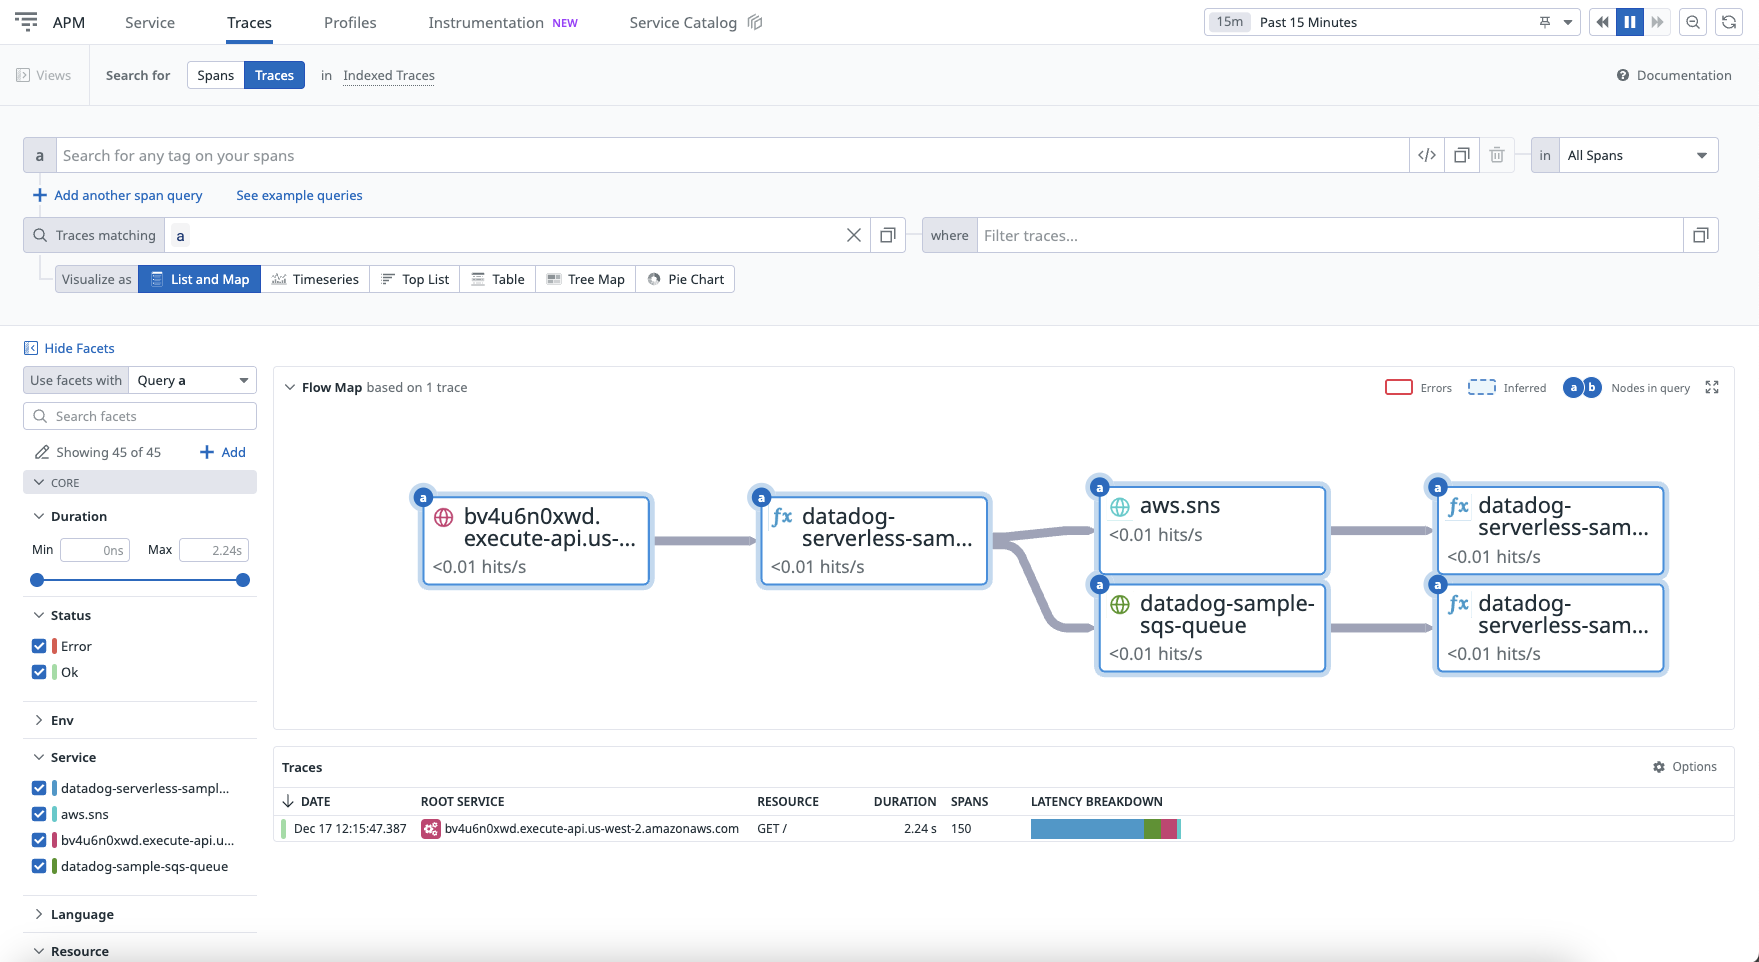
When I click on the trace in the Traces section of the console, it takes me to the Traces view, where I can analyze it further.
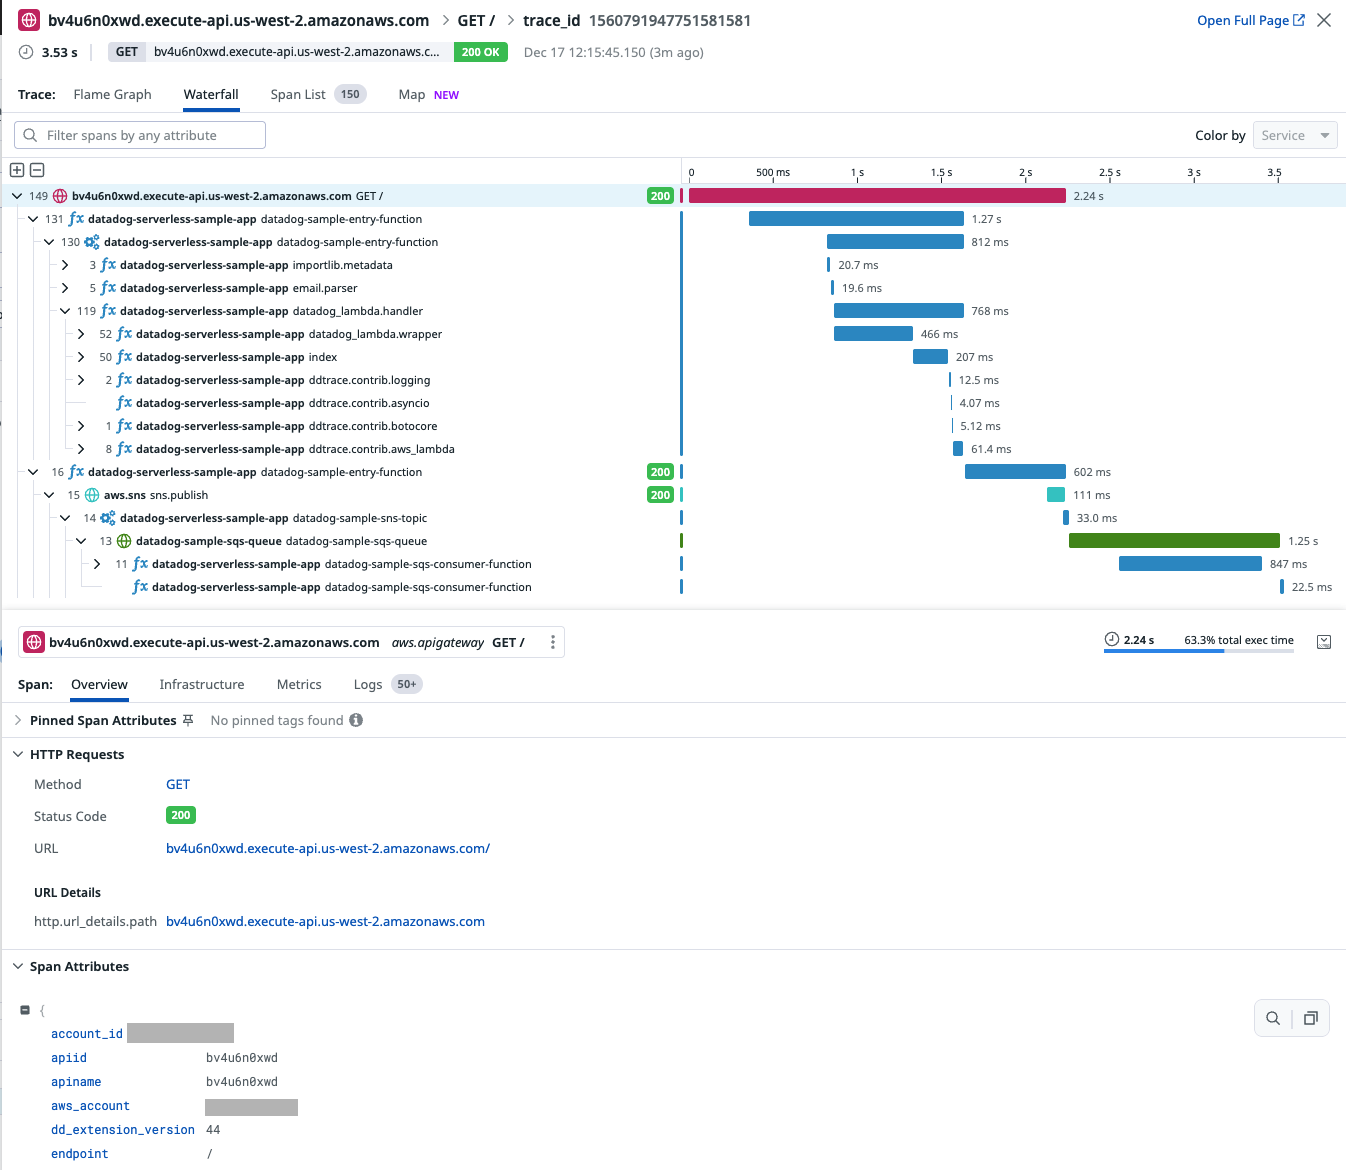
The waterfall view of the Trace shows the complete end-to-end execution, including through messaging services like SNS & SQS. I could also see a span for the amount of time a message spent "in flight" inside the messaging technology and this trace propagation is automatic.

Here is how the map looks for the trace. You can see the API gateway call leading to the execution of the lambda function, which in turn publishes messages on an SNS Topic and, finally, SQS. The consumer Lambda function then consumes the message from SQS. With almost no work, you can get this view, which helps you better understand the systems, patterns, and performance at play.
Next, I decided to explore logs for the trace. Without Datadog Pro, I would have had to locate logs for each lambda function execution and then read them one after the other, but with Datadog Pro, I could see logs for the entire trace with just one click.
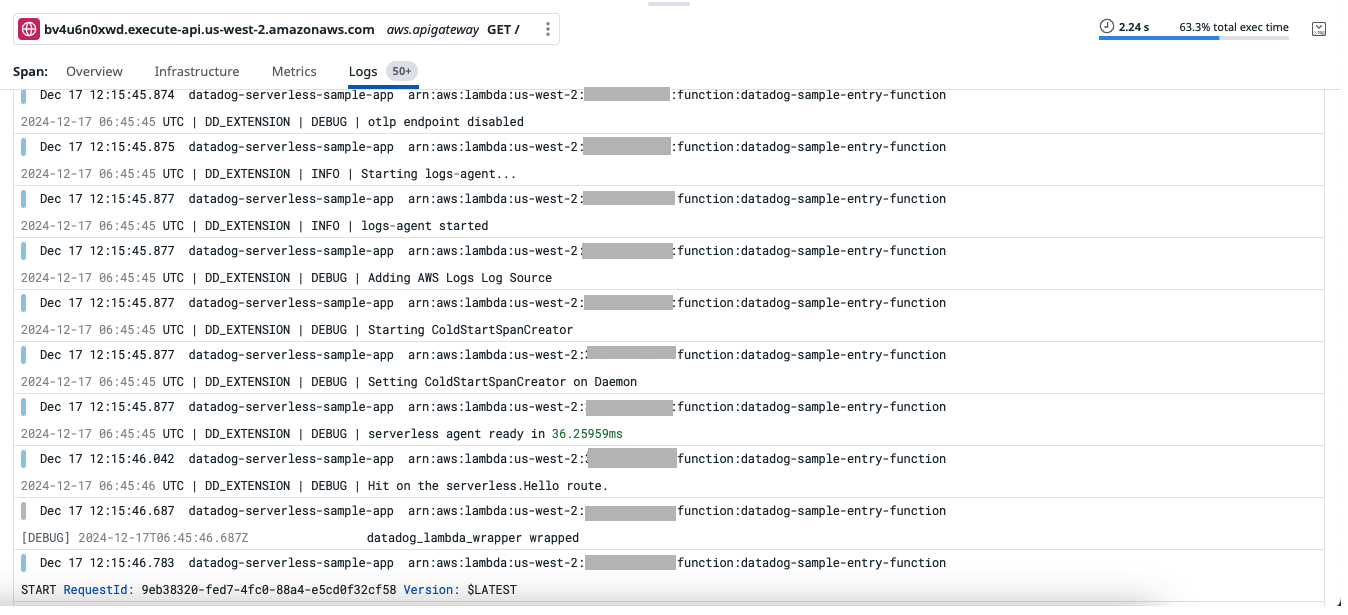
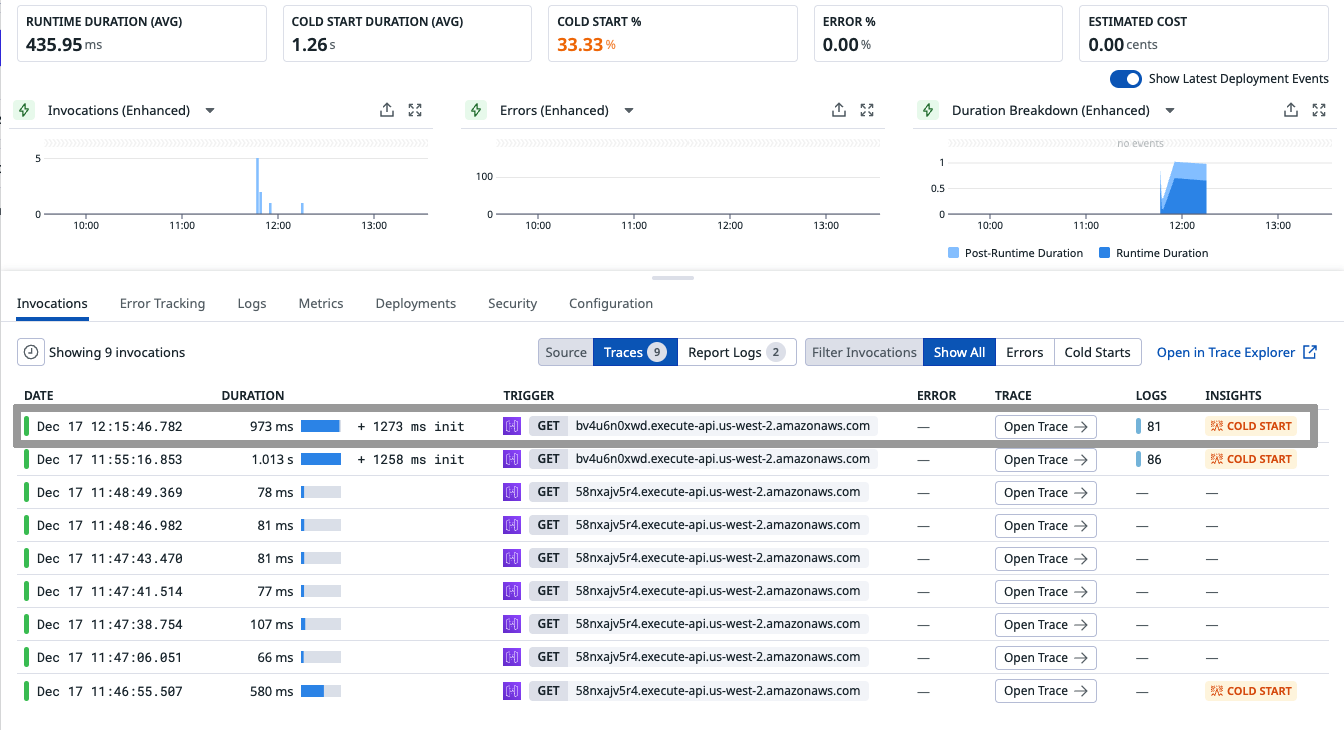
In the Logs section I noticed a message indicating that the execution of the request started much later. To check whether this is a pattern, I checked the serverless monitoring view of the lambda function, where I saw an insight from Datadog Pro that identified the lambda function’s cold start problem as the root cause for the delay. It also identified 1273 milliseconds as the time taken by the lambda function during the cold start.
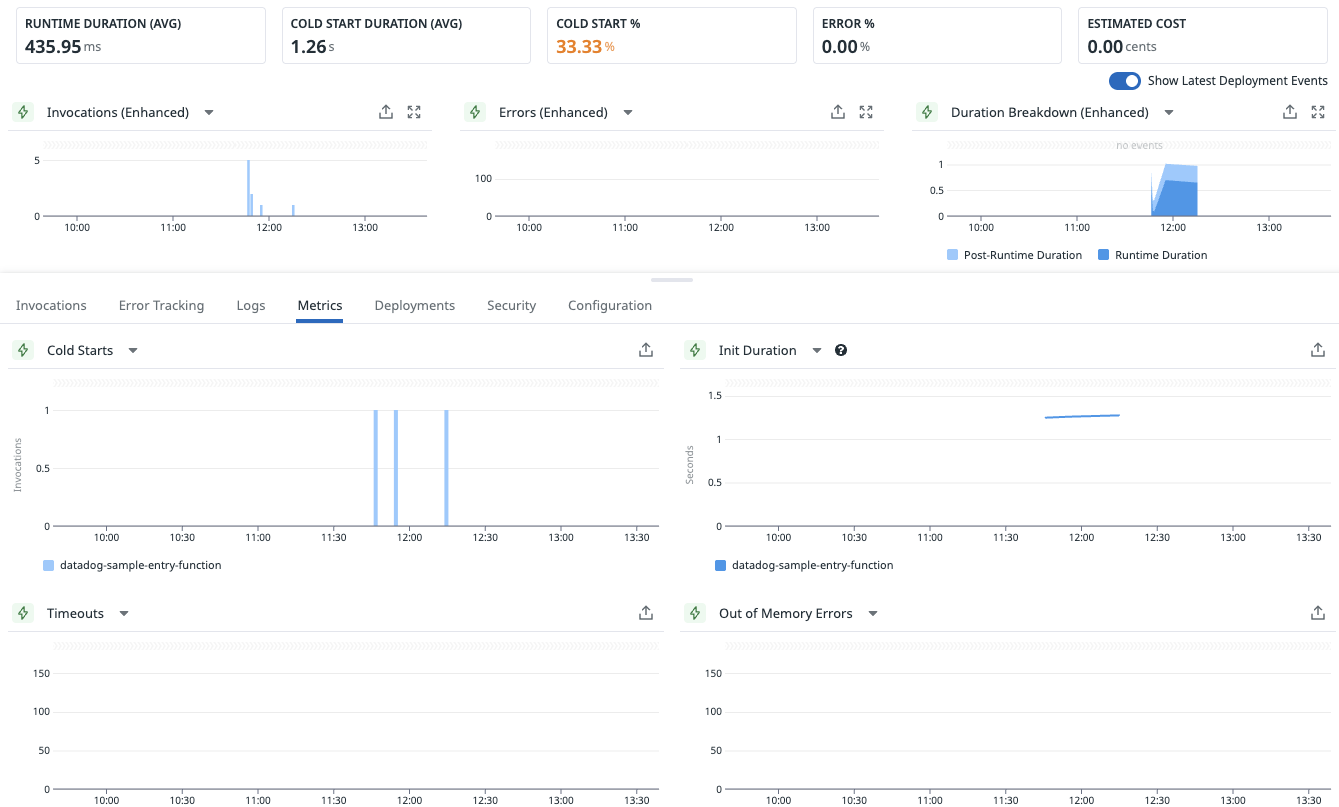
By navigating to the Metrics tab, I could also see other related metrics for the lambda function.
I continued exploration, and by the end of my 14-day trial, I had a good idea of how comprehensive the view looks and how Datadog Pro could trace serverless requests on my application from end to end, giving me in-depth visibility into the application’s performance.
Key takeaways
You just learned how Datadog Pro can help you monitor your serverless application. With this tool in your toolbelt, you can perform instrumentation to get end-to-end visibility into your executions and quickly spot performance bottlenecks.
If you are starting out, here are my two cents:
Use Datadog Pro’s free trial to learn about its serverless monitoring capabilities.
Use the serverless monitoring QuickStart to configure monitoring using Datadog Pro’s serverless monitoring solution.
Configure Datadog Pro to monitor your stack and explore different capabilities to understand your application’s performance. And finally,
Identify and fix bottlenecks and performance issues.
To get started, sign up for Datadog Pro (Pay-As-You-Go with 14-day Free Trial) in AWS Marketplace using your AWS account.
More resources for building on AWS
Why AWS Marketplace for on-demand cloud tools
Free to try. Deploy in minutes. Pay only for what you use.