
Sold by: OpenObserve
Deployed on AWS
10x easier, 140x lower storage cost, high performance, petabyte scale - observability solution for (Logs, Metrics, Traces, RUM, Error tracking, Session replay).
4.8
Overview
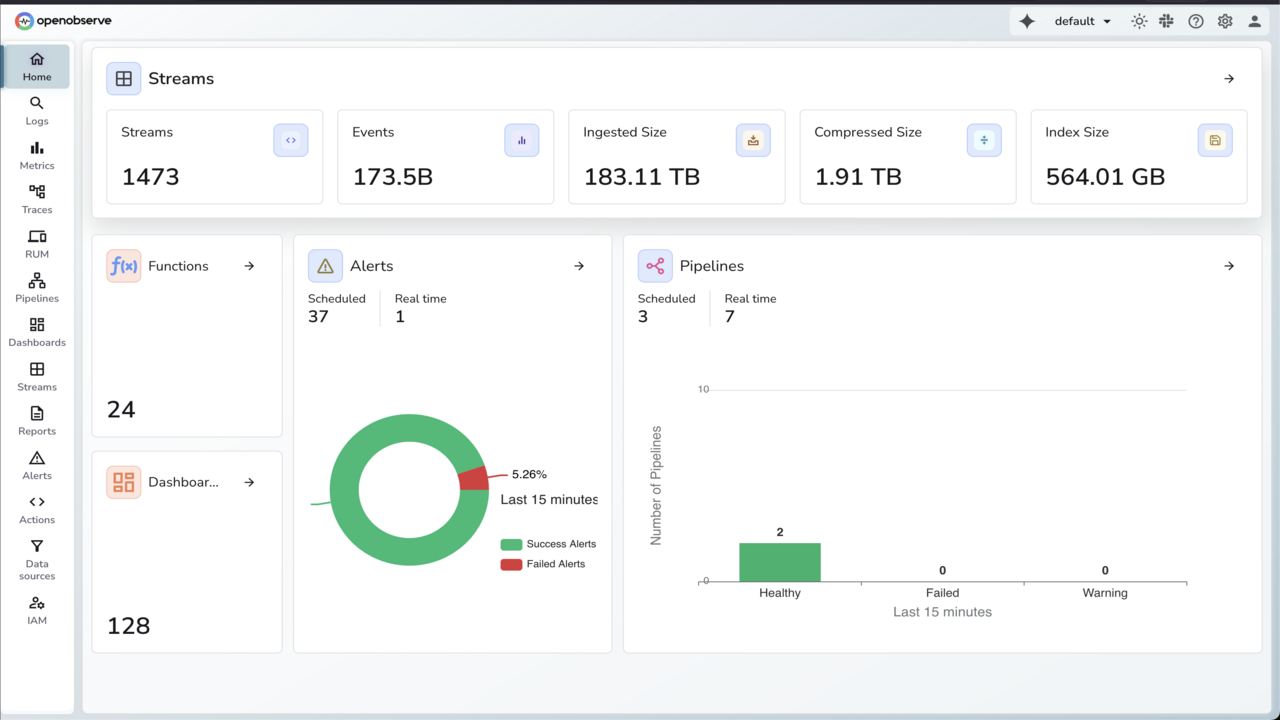
Image
Home page
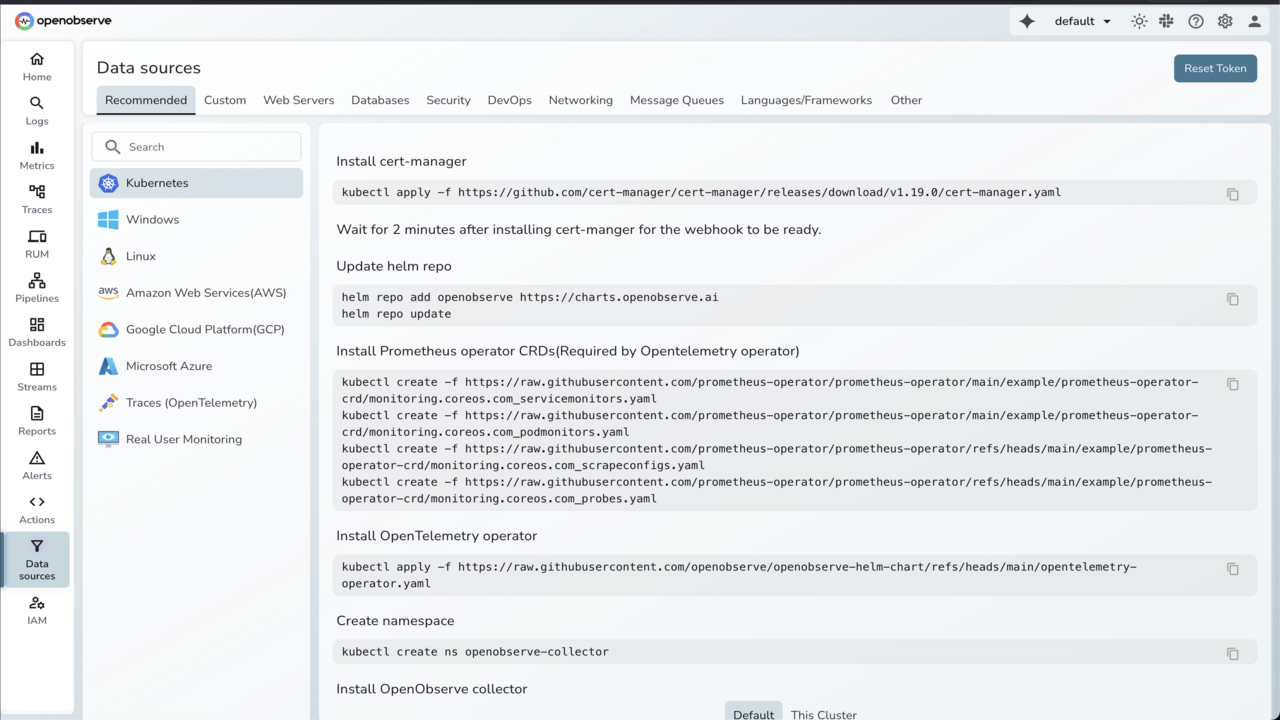
Image
Data Sources
OpenObserve is a cloud native observability platform (Logs, Metrics, Traces) that provides ~140x lower storage costs. Could be higher or lower based on data entropy) for real life log data, significantly lower operational cost and ease of use. It can scale to petabytes of data, is highly performant and allows you to sleep better at night. If you are looking for an observability tool for logs, metrics and traces, do evaluate OpenObserve and how its approach towards observability could help you build better software, save money on observability costs, and sleep better. We built OpenObserve on a simple truth - the best tech grows in the open. Our open source foundation isn't just a checkbox; it's our lifeblood. When observability tools hide their inner workings, everyone loses. That's why we've thrown open our codebase, letting you peek under the hood, tinker with the engine, or rebuild entire systems to fit your world. Our community keeps us honest. Developers from Boston to Bangalore contribute code that solves real problems they've faced firsthand. This diversity of thought has taken us places we never would have discovered alone. We're pragmatists about sustainability too. While our core platform remains free for all, our enterprise offerings fund the coffee that fuels our late-night coding sessions. This balance ensures OpenObserve stays both accessible and evolving.
Highlights
- Extremely performant - Very high ingestion rates and search speed. Upto 5x lower compute requirements compared to the competition.
- Extremely low storage cost. Upto 140x lower storage cost compared to the competition. Awesome GUI, Easy to get started with and maintain with stateless nodes.
Details
Sold by
Categories
Delivery method
Deployed on AWS
New
Introducing multi-product solutions
You can now purchase comprehensive solutions tailored to use cases and industries.

Features and programs
Financing for AWS Marketplace purchases
AWS Marketplace now accepts line of credit payments through the PNC Vendor Finance program. This program is available to select AWS customers in the US, excluding NV, NC, ND, TN, & VT.

Pricing
Pricing is based on actual usage, with charges varying according to how much you consume. Subscriptions have no end date and may be canceled any time.
Additional AWS infrastructure costs may apply. Use the AWS Pricing Calculator to estimate your infrastructure costs.
Dimension | Description | Cost/MB |
|---|---|---|
Ingestion | Ingested data in MB | $0.00048828 |
Query | Queried data in MB | $0.00000976 |
Pipeline | Transformed data in MB | $0.00019531 |
Remote Pipelines | Exported data in MB | $0.00029296 |
Data Retention | Data Retention in MB/hour | $0.00000013 |
Dimensions summary
You pay only for what you use across five independent metrics, with no upfront commitment or per-seat charges. Ingestion covers data you bring into the platform, measured in MB. Query covers data you search, also in MB. Pipeline covers data you transform in real time, while Remote Pipelines covers data you export to external destinations. Data Retention charges for storage over time, measured in MB per hour. Each dimension bills separately based on your actual volume, so your total cost scales directly with usage rather than a fixed tier.
Top-of-mind questions for buyers
Each of these dimensions bills per megabyte of data. Ingestion counts data you send into the platform. Query counts data scanned when you search. Pipeline counts data transformed in real time. Remote Pipelines counts data exported to external destinations. Each megabyte is measured against actual volume processed.
Data Retention bills per megabyte per hour, so it charges for storage held over time. The other four dimensions charge per megabyte of data moved or processed once. Retention cost grows the longer you keep data, while ingestion, query, pipeline, and remote pipeline costs reflect one-time volume events.
It depends on your workload. High data intake pushes Ingestion cost up. Heavy searching raises Query cost. Long storage periods increase Data Retention, since it bills per megabyte per hour. Real-time transformation drives Pipeline cost, and exporting data drives Remote Pipelines. All five bill independently on the same invoice.
openobserve.ai
Helpful?
Vendor refund policy
available

Legal
Vendor terms and conditions
Upon subscribing to this product, you must acknowledge and agree to the terms and conditions outlined in the vendor's End User License Agreement (EULA) .
Content disclaimer
Vendors are responsible for their product descriptions and other product content. AWS does not warrant that vendors' product descriptions or other product content are accurate, complete, reliable, current, or error-free.
Delivery details
Software as a Service (SaaS)
SaaS delivers cloud-based software applications directly to customers over the internet. You can access these applications through a subscription model. You will pay recurring monthly usage fees through your AWS bill, while AWS handles deployment and infrastructure management, ensuring scalability, reliability, and seamless integration with other AWS services.
Support
Vendor support
AWS infrastructure support
AWS Support is a one-on-one, fast-response support channel that is staffed 24x7x365 with experienced and technical support engineers. The service helps customers of all sizes and technical abilities to successfully utilize the products and features provided by Amazon Web Services.
Similar products

Altitude™ is a modular, scalable, and rapidly deployable infrastructure platform that can be setup in a matter of days and tailored to meet your organization's specific requirements. Altitude™ is a managed service that provides robust security, compliance, and financial governance capabilities to meet tackle the most sensitive mission spaces; all without sacrificing on the end-user experience.

SHIFT™ is an emulation and testing platform that emulates high-side, air-gapped and restricted Cloud Service Provider (CSP) Regions. It provides detailed feedback on interactions that your workload makes within these environments and most importantly, tells you how to fix your code.

ClickHouse Cloud is an extraordinarily fast, seamlessly scalable and delightfully easy-to-use online analytical database.
Arduino Cloud is an all-in-one IoT platform that empowers businesses to go to market quickly, giving them the right framework to securely prototype, deploy and manage their IoT projects at any scale and from any location for a wide range of hardware products.
Customer reviews
Computer Software
Easy Setup, All-in-One Observability for Logs, Metrics, Traces, and More
Reviewed on Sep 25, 2026
Review provided by G2
What do you like best about the product?
It's very easy to install and start playing with it. All different types of telemetry logs, metrics, traces, synthetic, RUM, etc., and now even LLM and database monitoring can be done using this single tool, which makes it easy to maintain.
What do you dislike about the product?
It's a great tool, UI can be improved a bit though.
What problems is the product solving and how is that benefiting you?
Openobserve is basically allowing us to monitor different things all in a single place without needing different components, and it's easy to get started so we can now focus on development instead of monitoring existing products with AI SRE Agent by OpenObserve.
Arjun P.
Super Simple Setup and Effortless Multi-Tenancy
Reviewed on Sep 25, 2026
Review provided by G2
What do you like best about the product?
Super simple to setup and easy for multi-tenancy
What do you dislike about the product?
The only challenge I see today is UI as that is an important aspect
What problems is the product solving and how is that benefiting you?
All our customer's telemetry is easy to be collected and helps search fast.
Rishit b.
Simplifying Observability with oTel
Reviewed on Sep 25, 2026
Review provided by G2
What do you like best about the product?
I like OpenObserve because the platform is easy to use and very beginner-friendly. I use otel to record traces and logs, and switching from a different vendor to OpenObserve felt hassle-free and straightforward.
What do you dislike about the product?
In today’s world, everything is getting connected to agentic AI, such as Codex and Claude. The fact that OpenObserve doesn’t have a connector is something I really dislike.
What problems is the product solving and how is that benefiting you?
OpenObserve makes observability simpler for me during agile development. I use O2 because it integrates easily with platforms like AWS and GCP, which makes it easier to move between different environments. Its use of OpenTelemetry also gives me a more standardized approach to collecting and managing telemetry data.
Information Technology and Services
Openobserve: Easy Setup, All-in-One Maintenance, and Great Support
Reviewed on Sep 25, 2026
Review provided by G2
What do you like best about the product?
Openobserve is very easy to install and get started to try out different features. They have great support to help you get started when stuck. Easy to maintain as it does not have multiple components to maintain and we got everything we needed in one place
What do you dislike about the product?
There are a lot of features which gets added every week and the UI keeps changing frequently making it difficult to catch up
What problems is the product solving and how is that benefiting you?
We had huge bills with our earlier tool and that too unexpected way beyond our calculations, OpenObserve solved that for us.
Information Technology and Services
Easy Setup and Unified Observability Without a Proprietary Language
Reviewed on Sep 24, 2026
Review provided by G2
What do you like best about the product?
OpenObserve is very easy to install and set up compared to other tools. It brings everything together in one place, so I don’t need to keep switching context. There’s also no proprietary language to learn, which makes switching to it much easier.
What do you dislike about the product?
The docs aren’t updated as frequently as the features are.
What problems is the product solving and how is that benefiting you?
When we were using Datadog, there were a lot of hidden charges that made the bill very high. OpenObserve’s straightforward pricing has helped us reduce our bill, and it has also lowered the team’s effort spent tuning different ingestions just to save costs.