Auto-deploy EKS clusters with CDK and Grafana Monitoring
As more organizations rely on Kubernetes to orchestrate their containerized applications and rely on internal developer platforms to accelerate and empower development teams in provisioning and operating their own infrastructure, offering a Kubernetes solution that is fully automated and observable becomes a key concern.
In this implementation walkthrough, you will learn how the AWS Cloud Development Kit (AWS CDK) can be used to build a self-service Amazon Elastic Kubernetes Service (Amazon EKS) offering for your developers, fully configured with Grafana Cloud Kubernetes Monitoring on deployment.
Before getting started
You must have an Amazon Web Services (AWS) account with enough permissions to deploy all required resources, including AWS CloudFormation templates, AWS Identity and Access Management (IAM) roles, Amazon EKS clusters, and AWS Marketplace offerings.
Initial setup
Before starting to build your solution, you will need to gather some data and configure some initial requirements that will be necessary as you progress through this walkthrough.
Subscribe to Grafana Cloud in AWS Marketplace
Start by subscribing to Grafana Cloud using your AWS Credentials from AWS Marketplace. Signing up to Grafana Cloud will provide you with the necessary access to follow the remainder of this implementation guide.
It is recommended to choose the Pay as you go subscription to make sure you only pay for the services you consume, without any long term commitment.
Gather the necessary configuration details
First you will need to make sure you have the required details to grant access to the Grafana Cloud Kubernetes Monitoring Amazon EKS add-on to your Grafana Cloud instance.
Three services will be used by Grafana Cloud Kubernetes Monitoring to push all telemetry to Grafana Cloud:
Prometheus for metric data
Grafana Loki for logs
Grafana Tempo and distributed traces
Each of these services will expose a unique endpoint specific to your Grafana Cloud organization as well as require an individual username and API for authentication.
Additionally, you need to make sure that the Grafana Cloud Kubernetes Monitoring offering in AWS Marketplace is subscribed to and available in your AWS account.
Grafana Cloud endpoints and access credentials
Start by getting the required credentials and hostnames that will be used later to configure the Grafana Cloud Amazon EKS add-on.
Log into your Grafana Cloud account and go to “My Account.” Here you will see the various organizations that may exist in your account. If there are none, make sure one is created before continuing.
Once you have located the right organization, click the “Launch” button to access its various services.
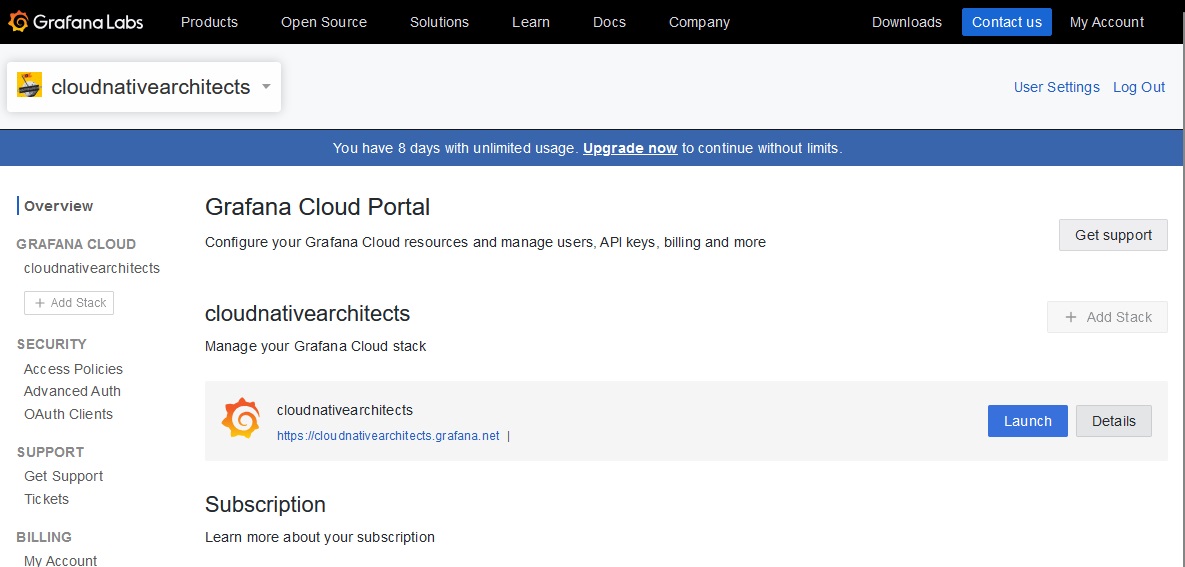
You will be taken to a page listing the various services available in the stack for the organization selected. As mentioned earlier, you will need to get credentials for Prometheus, Loki, and Tempo.
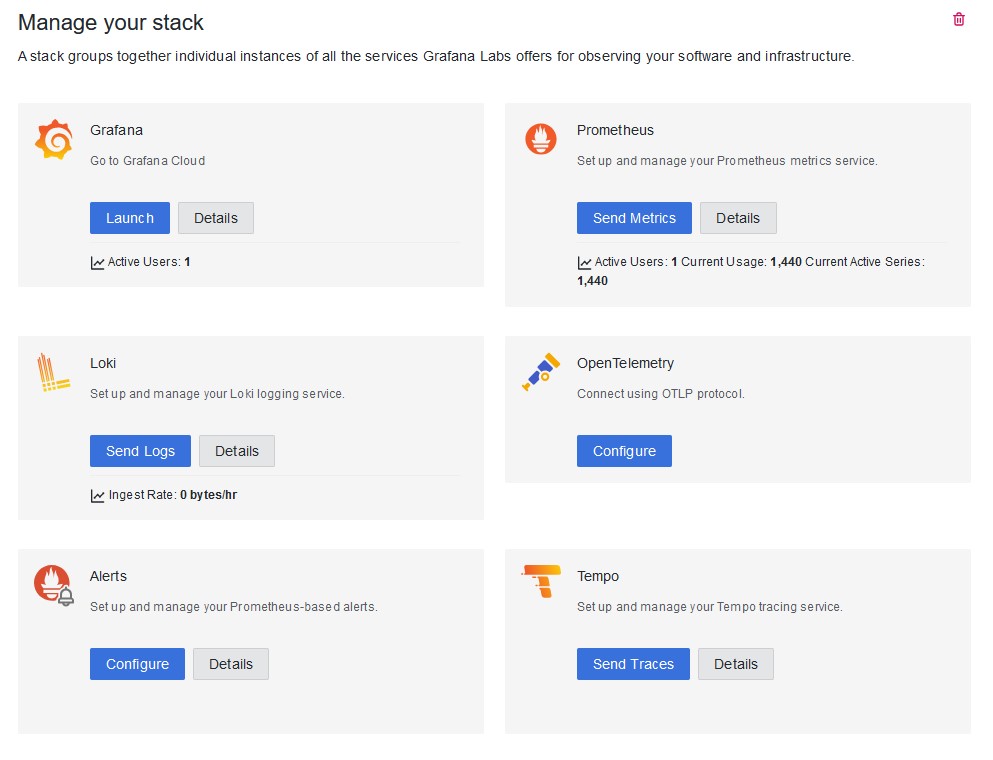
Let’s use Prometheus as an example. Click the “Details” button under Prometheus. This will take you to the service’s specific access details:
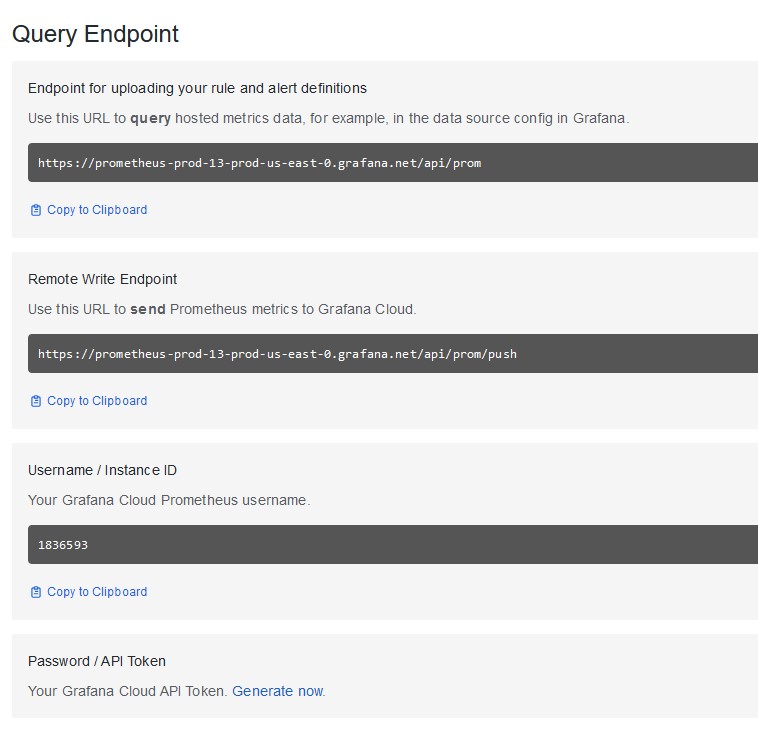
From here, make sure you note the following details:
Your specific hostname, which is the piece of the URL before “.grafana.net.” In the screenshot above you would be looking for “prometheus-prod-13-us-east-0.” This will be your Prometheus Hostname.
The Grafana Cloud Prometheus username, which is the numeric string under “Username / Instance ID.” This will be your Prometheus username.
You will also need to generate an API Token by clicking the “Generate now” link under “Password / API Token.” You will need to provide a name for the token during creation. Once done, you will be able to see the token only once. Make sure you copy it and store it. This will be your Prometheus password.
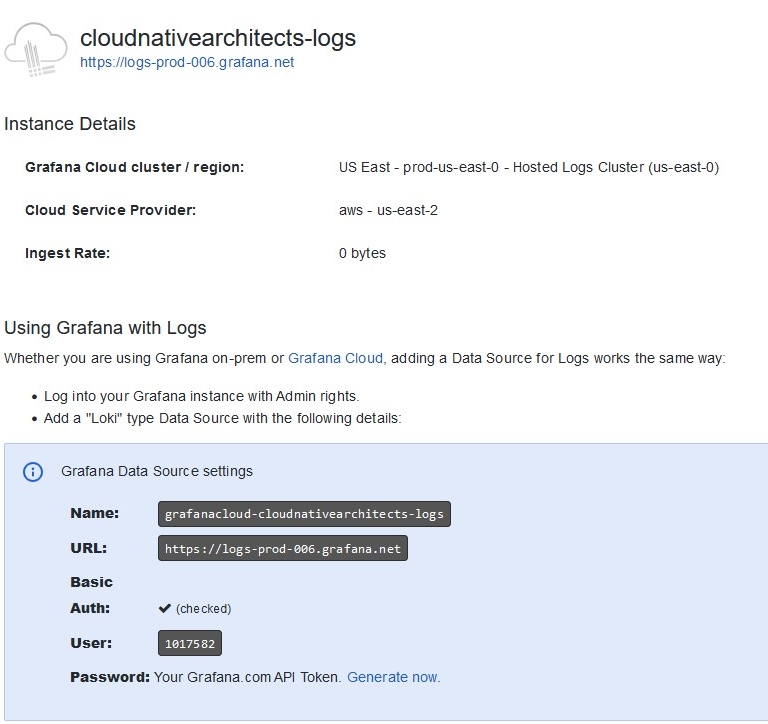
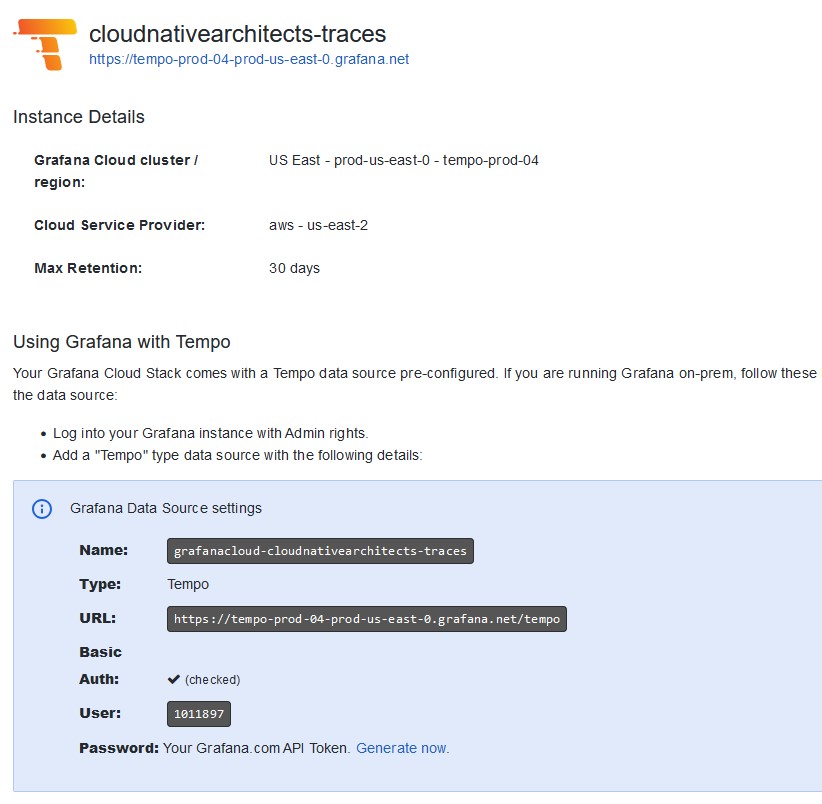
You’ll need to follow similar steps for Loki and Tempo. Each service will show a slightly different interface as can be seen from the screenshots above. Nevertheless, for each service you will need a hostname, username, and password, following the same process as you did for Prometheus.
Make sure you note all these details for later use, as they will be required in the configuration of the self-service Amazon EKS offering you will be building using AWS CDK.
Grafana Cloud Kubernetes Monitoring subscription in AWS Marketplace
Now let’s look at the AWS side of things. In AWS you will need to ensure an active subscription exists for the Grafana Cloud Kubernetes Monitoring product in AWS Marketplace. This entitlement will be required by the Grafana Cloud Amazon EKS add-on you will be deploying and configuring programmatically to enable cluster observability.
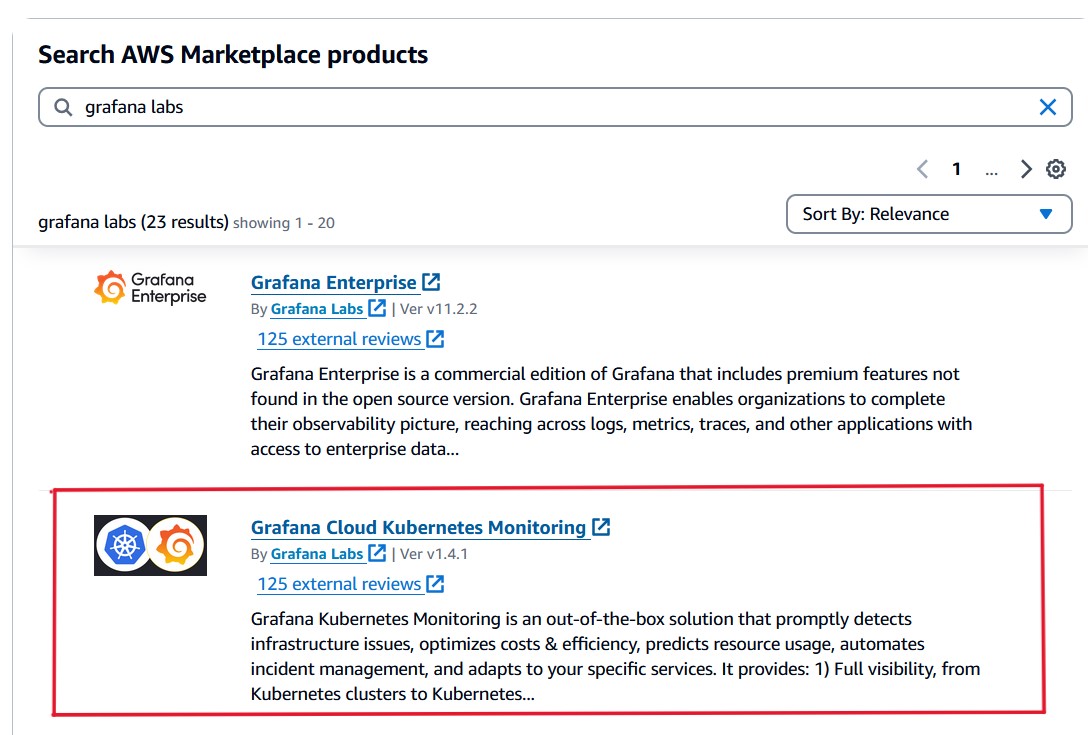
In AWS Marketplace, look for Grafana Labs, and locate the Grafana Cloud Kubernetes Monitoring offering. From its product page, click the “Continue to Subscribe” button to register your subscription—and don’t worry, this product is completely free of AWS charges.

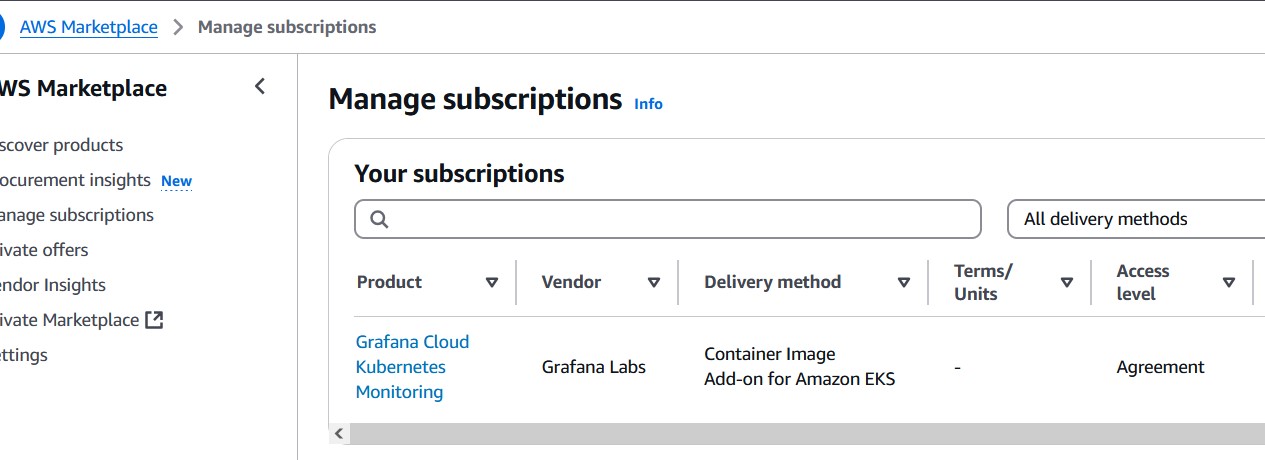
You can confirm the subscription is correctly configured by going to “Manage subscriptions” in the AWS Management Console.
Let’s build our observable Amazon EKS cluster with Grafana Cloud’s built-in self-service offering
Create your .env file
You’ll be using a .env file to store the access details gathered from Grafana Cloud as well as the desired AWS identity you wish to grant admin access to the Amazon EKS cluster created.
In this .env file you will also assign a name to this deployment, which will be used to uniquely identity it against other deployments that have used the same solution.
A good practice is to use a team or application identifier. In our example you can see that we’re identifying this solution as owned by the “marketplace” team.

TEAM_ID should be the unique identifier for this cluster. It will be used as a prefix for all resources created as part of the deployment.
MASTER_ROLE must be the ARN of the role you wish to grant admin access to the cluster.
The remaining environment variables should be the various details you noted down in the “Access Credentials” section.
AWS CDK-based observable Amazon EKS with Grafana Cloud
No changes have been made to the default structure created by AWS CDK when starting a new TypeScript project:
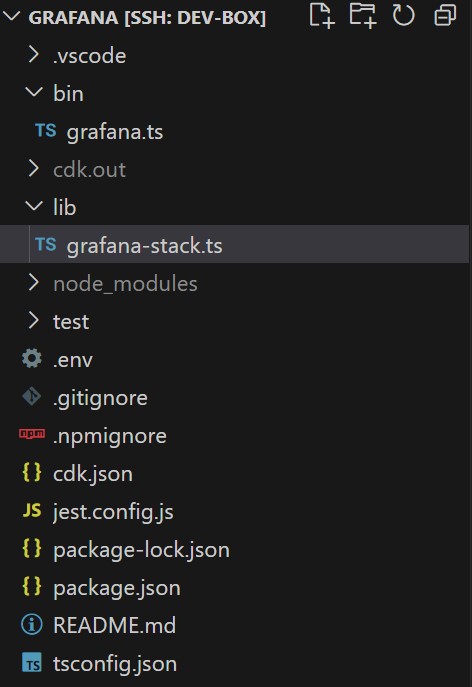
Our full implementation will be done on two specific files:
lib/grafana-stack.ts
This is the core of the implementation, where the GrafanaStack class is declared, which extends the cdk.Stack class.
bin/grafana.ts
This will be your entrypoint, which AWS CDK will execute when running cdk deploy.
The entry point
In bin/grafana.ts we’ve added a small configuration handler, that uses the .env package to read configuration from the .env file you created earlier. Take note of the different variables that are required, which will match the details indicated earlier in this walkthrough.
dotenv.config();

export type ConfigProps = {
  TEAM_ID: string;
  MASTER_ROLE: string;
  PROMETHEUS_HOST: string;
  PROMETHEUS_USERNAME: string;
  PROMETHEUS_PASSWORD: string;
  LOKI_HOST: string;
  LOKI_USERNAME: string;
  LOKI_PASSWORD: string;
  TEMPO_HOST: string;
  TEMPO_USERNAME: string;
  TEMPO_PASSWORD: string;
};

export const getConfig = (): ConfigProps => ({
  TEAM_ID: process.env.TEAM_ID || `unknown`,
  MASTER_ROLE: process.env.MASTER_ROLE || `unknown`,
  PROMETHEUS_HOST: process.env.PROMETHEUS_HOST || `unknown`,
  PROMETHEUS_USERNAME: process.env.PROMETHEUS_USERNAME || `unknown`,
  PROMETHEUS_PASSWORD: process.env.PROMETHEUS_PASSWORD || `unknown`,
  LOKI_HOST: process.env.LOKI_HOST || `unknown`,
  LOKI_USERNAME: process.env.LOKI_USERNAME || `unknown`,
  LOKI_PASSWORD: process.env.LOKI_PASSWORD || `unknown`,
  TEMPO_HOST: process.env.TEMPO_HOST || `unknown`,
  TEMPO_USERNAME: process.env.TEMPO_USERNAME || `unknown`,
  TEMPO_PASSWORD: process.env.TEMPO_PASSWORD || `unknown`,
});
After initializing the configuration, a new AWS CDK application is created and an instance of GrafanaStack added to it. GrafanaStack is the class that holds the full implementation which we’ll walk through next.
const config = getConfig();
console.log(config);


const app = new cdk.App();
new GrafanaStack(
  app,
  config.TEAM_ID,
  config.MASTER_ROLE,
  config.PROMETHEUS_HOST,
  config.PROMETHEUS_USERNAME,
  config.PROMETHEUS_PASSWORD,
  config.LOKI_HOST,
  config.LOKI_USERNAME,
  config.LOKI_PASSWORD,
  config.TEMPO_HOST,
  config.TEMPO_USERNAME,
  config.TEMPO_PASSWORD,
  false);
The implementation
GrafanaStack holds our full implementation. Note that this is a basic example that is not production ready, as indicated below, and should be extended and modified to be adjusted to your specific production environment requirements.
As you can see, we’ve added all the required configuration attributes to the constructor of the class, which allows us to dynamically configure with Grafana Cloud specific instance configuration. There are other ways to accomplish this, using AWS CDK environments, parameters, or context, but for the purpose of this walkthrough, this should serve as a good example and reference that you can adapt to other specific scenarios.
export class GrafanaStack extends cdk.Stack {
  constructor(
    scope: cdk.App,
    id: string,
    kubernetesRole: string,
    prometheusHost: string,
    prometheusUsername: string,
    prometheusPassword: string,
    lokiHost: string,
    lokiUsername: string,
    lokiPassword: string,
    tempoHost: string,
    tempoUsername: string,
    tempoPassword: string,
    createVPC: boolean,
    props?: cdk.StackProps,
    vpcID?: string) {
    super(scope, id, props);
In the GrafanaStack class we’re creating an eksCluster object, with basic configuration parameters. These parameters can be modified to match your specific environment requirements as well as the different configuration interface you want to expose to consumers of this class.
    const eksCluster = new eks.Cluster(this, `${id}-eks`, {
      vpc: vpc,
      defaultCapacity: 0,
      version: eks.KubernetesVersion.V1_29,
      kubectlLayer: new KubectlV28Layer(this, "kubectl"),
      ipFamily: eks.IpFamily.IP_V4,
      clusterLogging: [
        eks.ClusterLoggingTypes.AUDIT,
      ],
      outputClusterName: true,
      outputConfigCommand: true,
      authenticationMode: eks.AuthenticationMode.API_AND_CONFIG_MAP,
    });

    const userRole = iam.Role.fromRoleArn(this, "Role", kubernetesRole);
    const clusterMasterRole = eksCluster.adminRole;

    userRole.grantAssumeRole(clusterMasterRole);
Notice that the role passed through configuration has been granted access to the automatically created cluster role.
Grafana Cloud requires a secret that holds the configuration that it will use to push telemetry into your Grafana Cloud instance. We are passing this data as stringData using the configuration parameters used when creating an instance of the GrafanaStack cloud. Make sure to modify this to use AWS Secrets Manager or other more secure means of secret injection method to avoid data exposure.
    const grafanaSecret = eksCluster.addManifest('grafana-secret', {
      apiVersion: 'v1',
        kind: 'Secret',
        metadata: {
          name: 'grafana-cloud',
          namespace: 'monitoring',
        },
        stringData: {
          "prometheus-host": `https://${prometheusHost}.grafana.net`,
          "prometheus-username": `${prometheusUsername}`,
          "prometheus-password": `${prometheusPassword}`,
          "loki-host": `https://${lokiHost}.grafana.net`,
          "loki-username": `${lokiUsername}`,
          "loki-password": `${lokiPassword}`,
          "tempo-host": `https://${tempoHost}.grafana.net`,
          "tempo-username": `${tempoUsername}`,
          "tempo-password": `${tempoPassword}`,
        }
    })
Now all you need to do is add the Grafana Cloud Kubernetes Monitoring Amazon EKS add-on, which takes only a few lines of code.
    const grafanaAddOn = new eks.Addon(this, "addonGrafana", {
      addonName: "grafana-labs_kubernetes-monitoring",
      cluster: eksCluster,
    });
  }
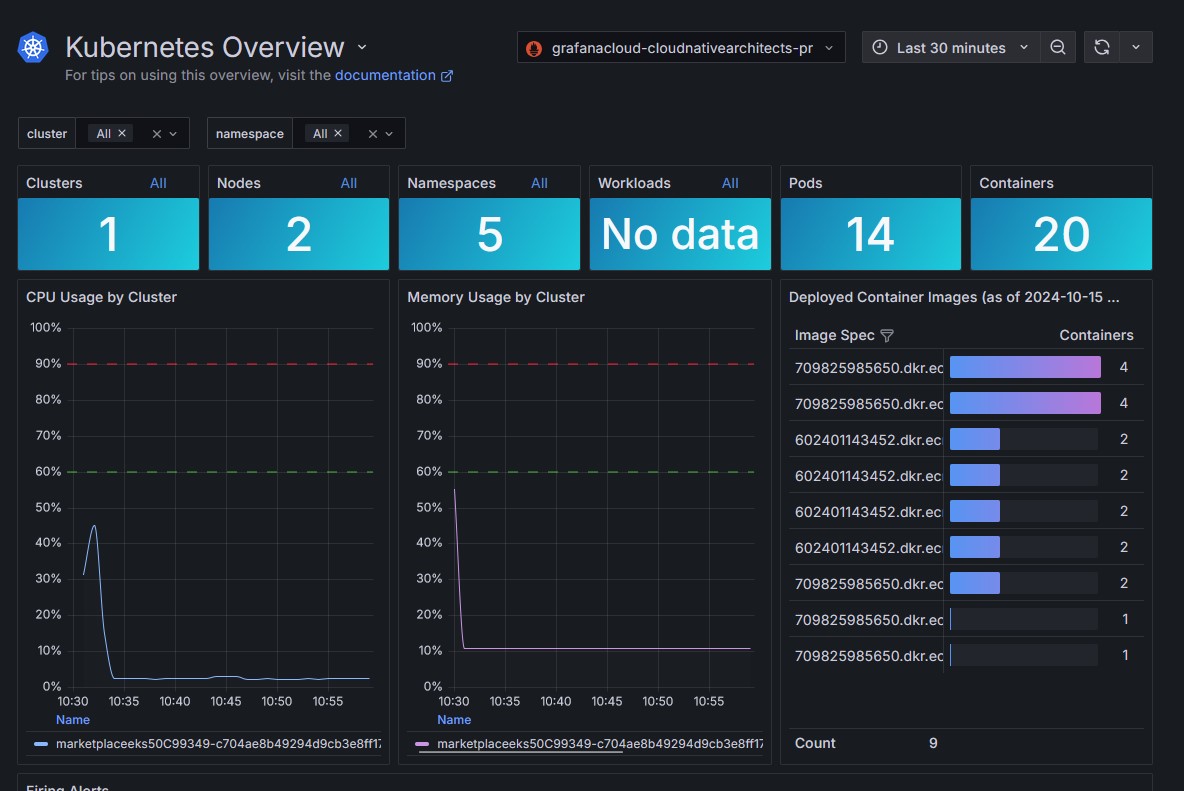
With these last couple of code snippets, you are automatically deploying all required Grafana agents into your cluster and configuring them to push data out to your Grafana Cloud instance.
Now you are ready to use AWS CDK to deploy this solution, by using the cdk deploy command. You will see a list of the different resources that will be created.
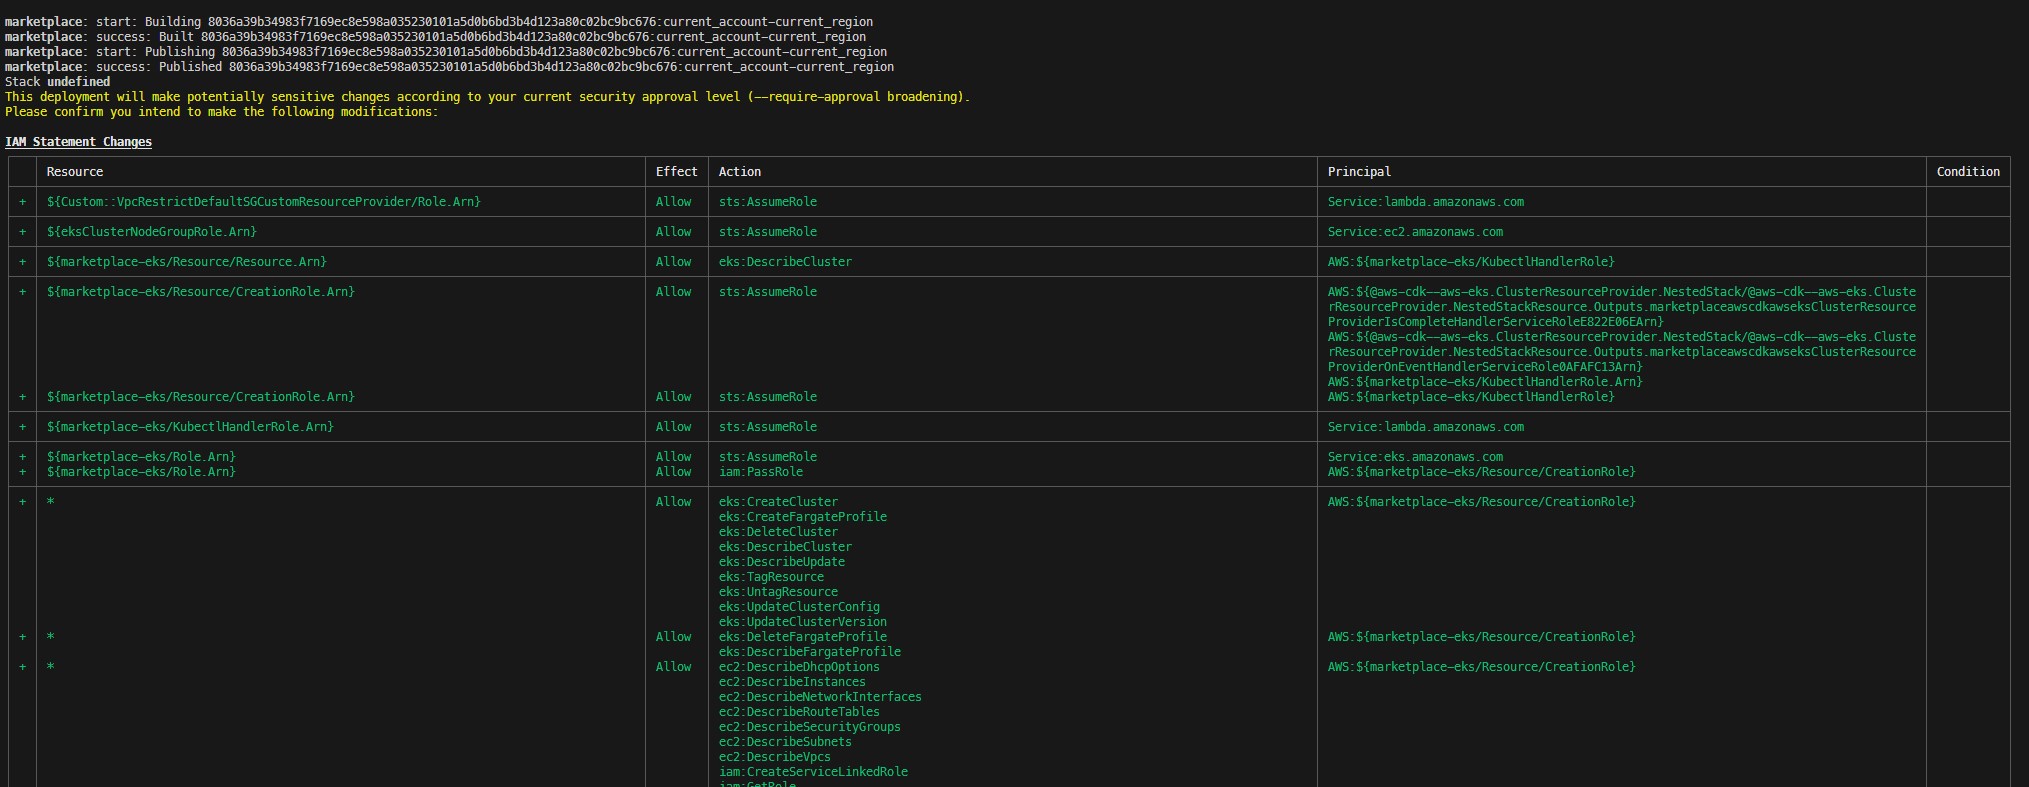
Wait for the solution to finish deploying, it will take a few minutes to complete. Once done, you will be able to go to your Grafana Cloud Kubernetes Monitoring dashboard and have real time access to your cluster telemetry.
Next steps
With this walkthrough, you can see how simple it is to get Amazon EKS clusters instantly and consistently deployed and observable using Grafana Cloud. To get started, try Grafana Cloud in AWS Marketplace using your AWS account, and the Grafana Cloud Kubernetes Monitoring Add-on to start building following the steps in this guide.
Disclaimer
This guide will help you understand implementation fundamental and serve as a starting point. The reader is advised to consider security, availability and other production-grade deployment concerns and requirements that are not within scope of this implementation guide for a full scale, production-ready implementation.
Why AWS Marketplace for on-demand cloud tools
Free to try. Deploy in minutes. Pay only for what you use.