Agentic root cause analysis and incident response
Gain full-stack visibility into application health, performance, and user experience with AI-powered observability platforms that surface insights, not just data.
About the series
This article is part of a multi-part Amazon Web Services (AWS)–authored series that explores the use of modern DevOps tools and AI-based features to accelerate software development and maintenance on AWS. The first article in this series introduces a fictional scenario and provides detailed background on the example.com application and the team managing it. This article focuses on the monitor and observe phase. You will learn how modern functionalities and AI-based features provided by independent software vendors (ISVs), when used alongside AWS services, can help you identify the root cause of common problems, use natural language queries to debug complex and unique issues, and set up predictive alerts for your AWS infrastructure components so you can act before problems occur.
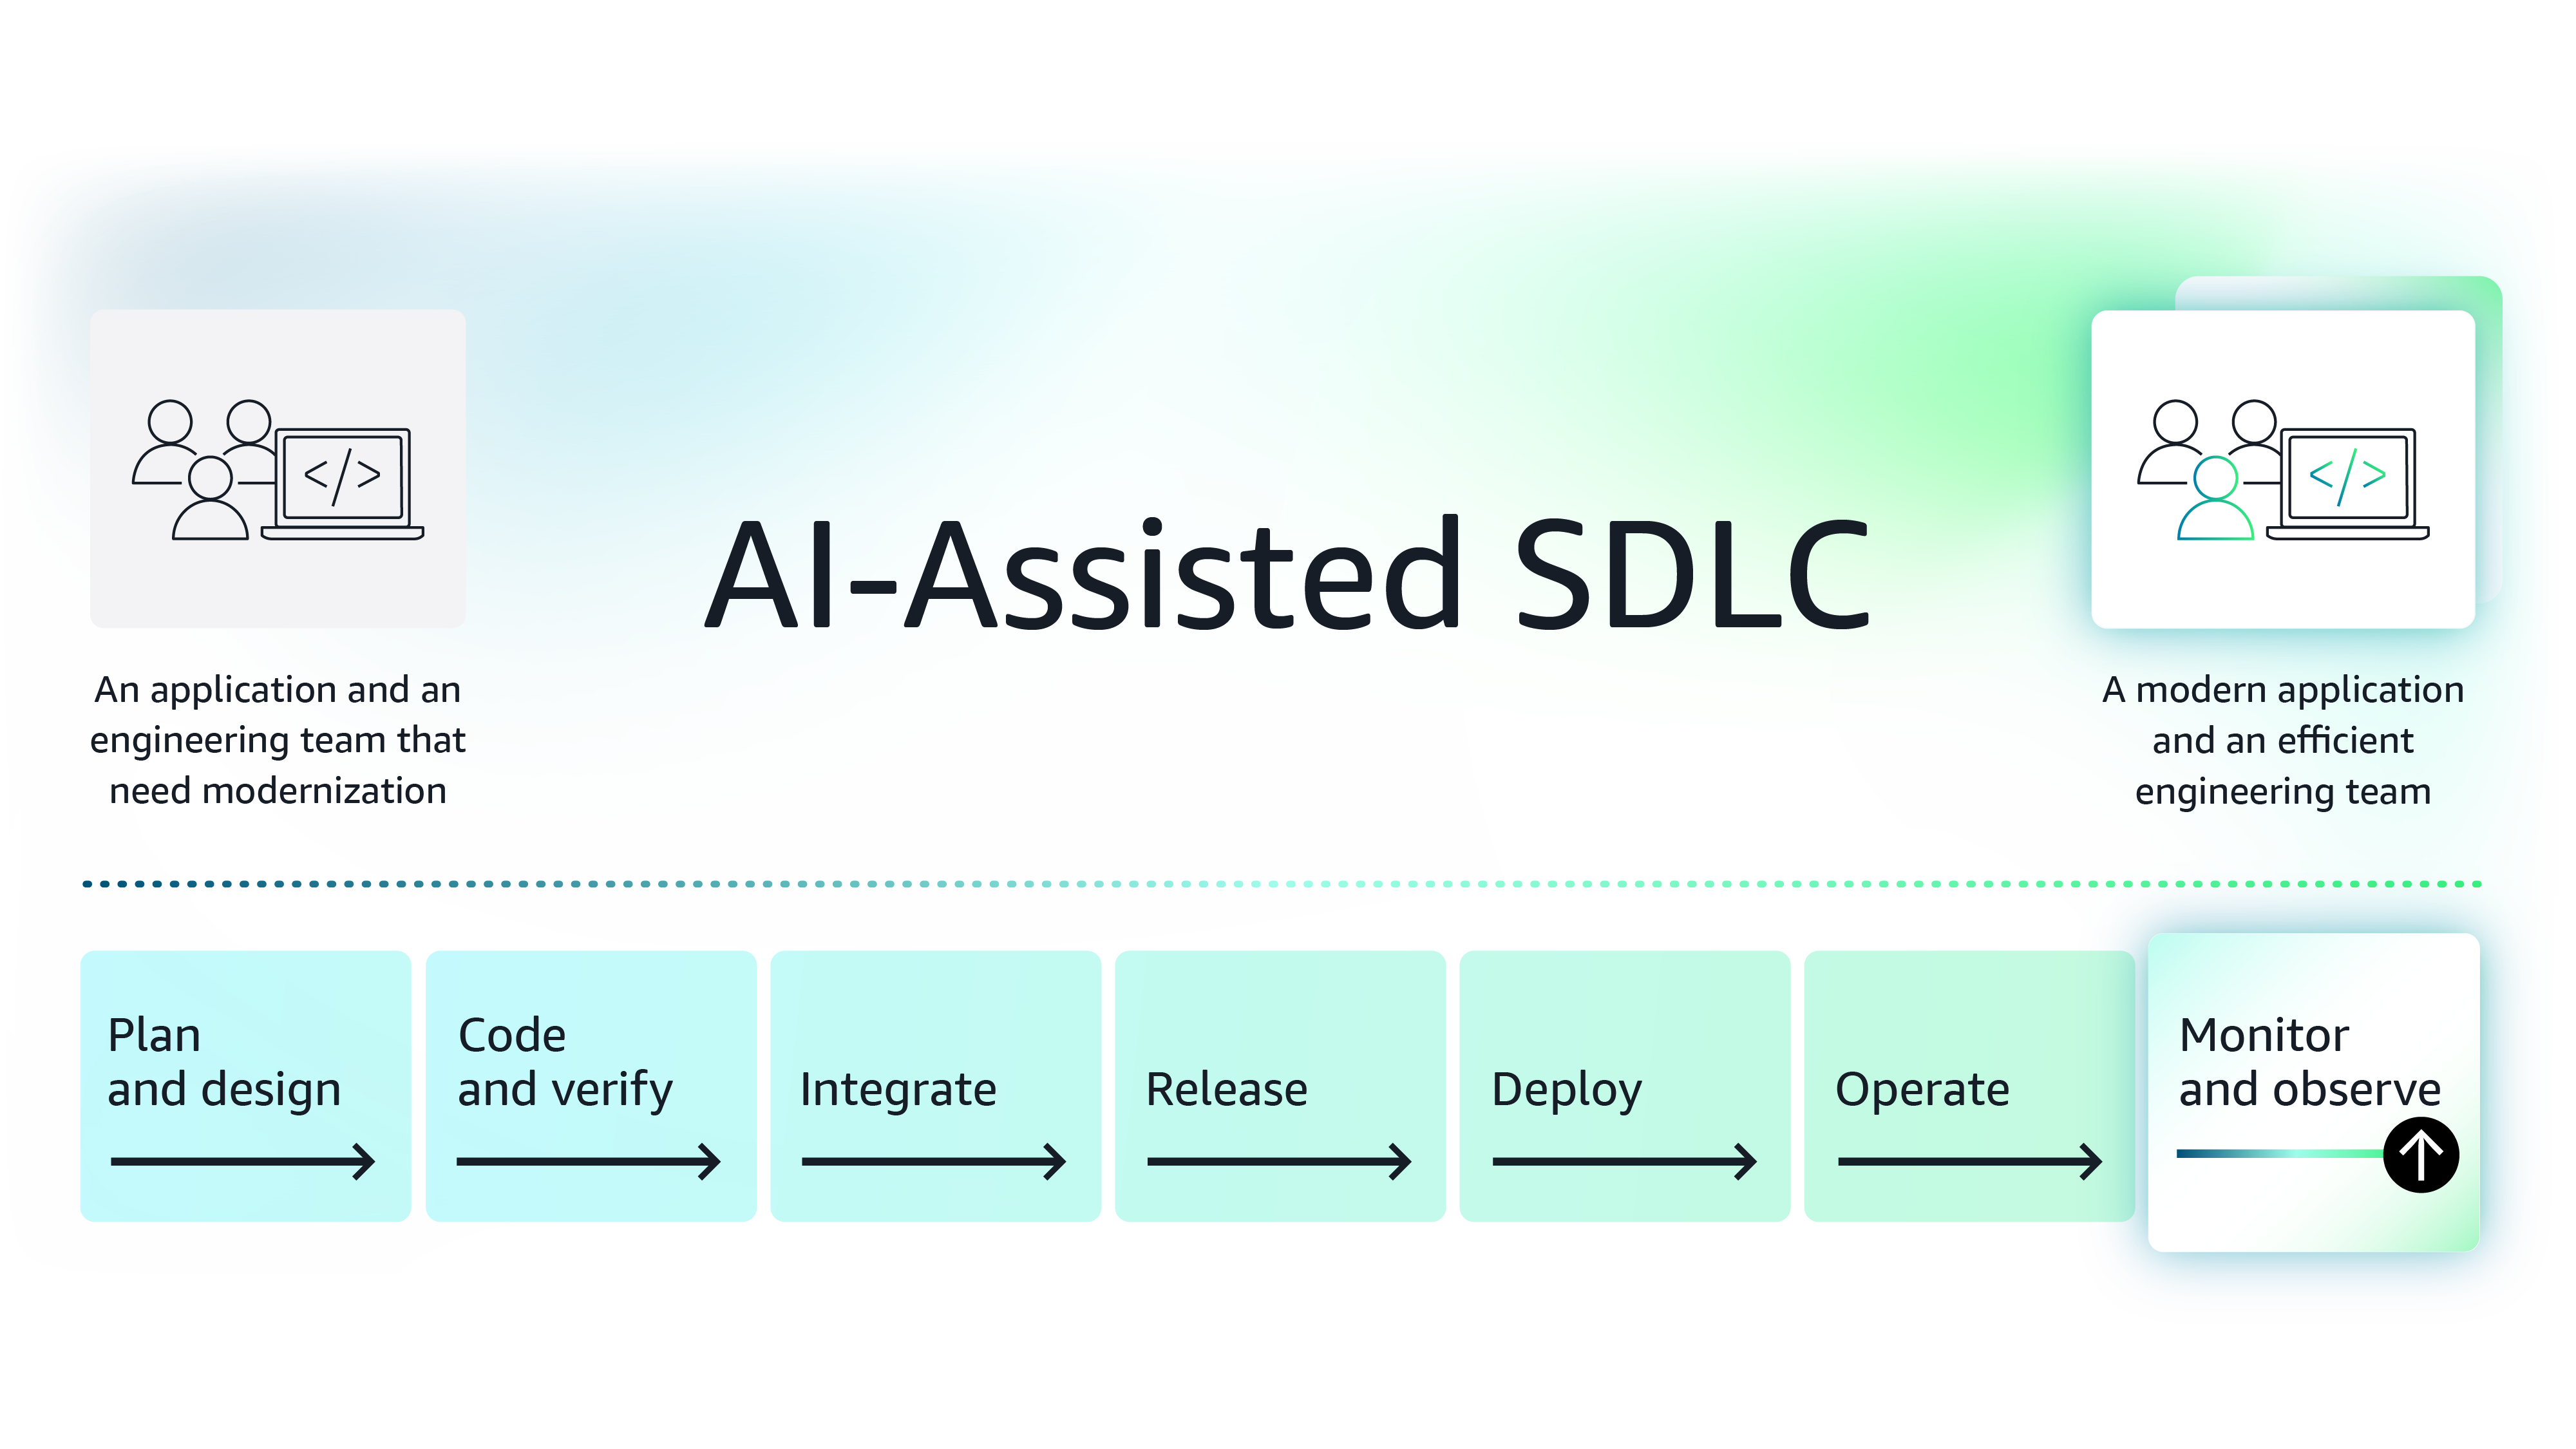
Figure 1: The modernization journey of the example.com application
Background - You are a site reliability engineer (SRE) brought on board by the principal engineer (PE) to support the example.com application. The application has been going through an overhaul. The engineering team has been transforming the highly coupled architecture into a distributed microservices-based architecture. The team has also been implementing and releasing customer-requested features, and soon the application will move back into the maintenance phase.
Although the application is generally stable, issues do occur, and as an SRE, you spend a significant amount of time identifying their root cause. There are multiple reasons for this: logs are distributed, you have to manually correlate multiple signals, and you have not implemented proactive alerting. To support a smooth transition into the maintenance phase, the PE has asked you to ensure the application is observable and that issues can be proactively identified and resolved.
Specifically, you must address the following requirements:
- Use an AI agent to identify the root cause - Issue root cause identification is a time-sensitive activity with serious implications. By quickly identifying the root cause of an issue, you can bring the application back to a healthy state as soon as possible.
- Troubleshoot logs using natural language queries - SREs troubleshoot logs for various reasons. You may need to identify a specific business outcome, the reason behind a system responding in a specific manner, or the root cause of an unforeseen issue. The bigger the user base, the more difficult it is to troubleshoot, as you have to comb through and understand a large number of distributed logs. You must explore and implement a solution to quickly troubleshoot logs, ideally using natural language patterns.
- Automate incident response using ML-driven forecasting capabilities
You must proactively identify issues so you can take the appropriate corrective actions. For example, if an Amazon Elastic Compute Cloud (Amazon EC2) instance is failing due to a disk outage, you want to know about it beforehand, so you can prevent customers from being affected. You need an advanced predictive analytics-based solution that proactively informs you about the possibility of such an event.
As a tenured SRE, you understand that metrics, traces, events, and logs are foundational pillars of modern observability and application performance monitoring solutions. The right approach is to bake in application observability and centralize logging into an application performance monitoring solution that supports distributed tracing and provides proactive AI alerts. You explore several solutions, but three solutions equipped with advanced AI features stand out.
Root cause identification
Use case 1: Using an AI agent to identify the root cause
Migrating to a microservices-based architecture on AWS has improved the example.com application’s long-term posture, but it has also made it harder to pinpoint the exact cause of the issue. Logs are scattered and troubleshooting and resolving issues take time. With advances in AI, observability solutions now offer automated Root Cause Analysis (RCA), helping you pinpoint the root cause faster.
AI-powered observability tools, such as Logz.io, use the language-understanding capabilities of LLMs to unify logs, metrics, and traces and provide AI-driven insights.
About Logz.io Open 360 Observability Platform
The Logz.io Open 360™ observability platform provides the ability to monitor, troubleshoot, and manage costs for AWS workloads. It provides flexible OpenTelemetry Integration enabling you to standardize observability pipelines for unified data collection and scalability. At the of the platform is the Logz.io AI Agent, a virtual teammate that automates data analysis, accelerates root cause investigations, and delivers actionable insights.
To test it, you simulate a real-world environment, load the logs from the day the issue occurred into Logz.io, and, without reading the resolution, debug and identify the root cause.
In the ticket, a customer reported receiving a “service unavailable” error. To debug this issue further, as shown in Figure 2, you start by searching for the keyword “unavailable”. You receive over a thousand log entries, indicating that the error affected multiple systems. You run additional queries only to find that it affected only the frontend containers running on Amazon Elastic Kubernetes Service (Amazon EKS).
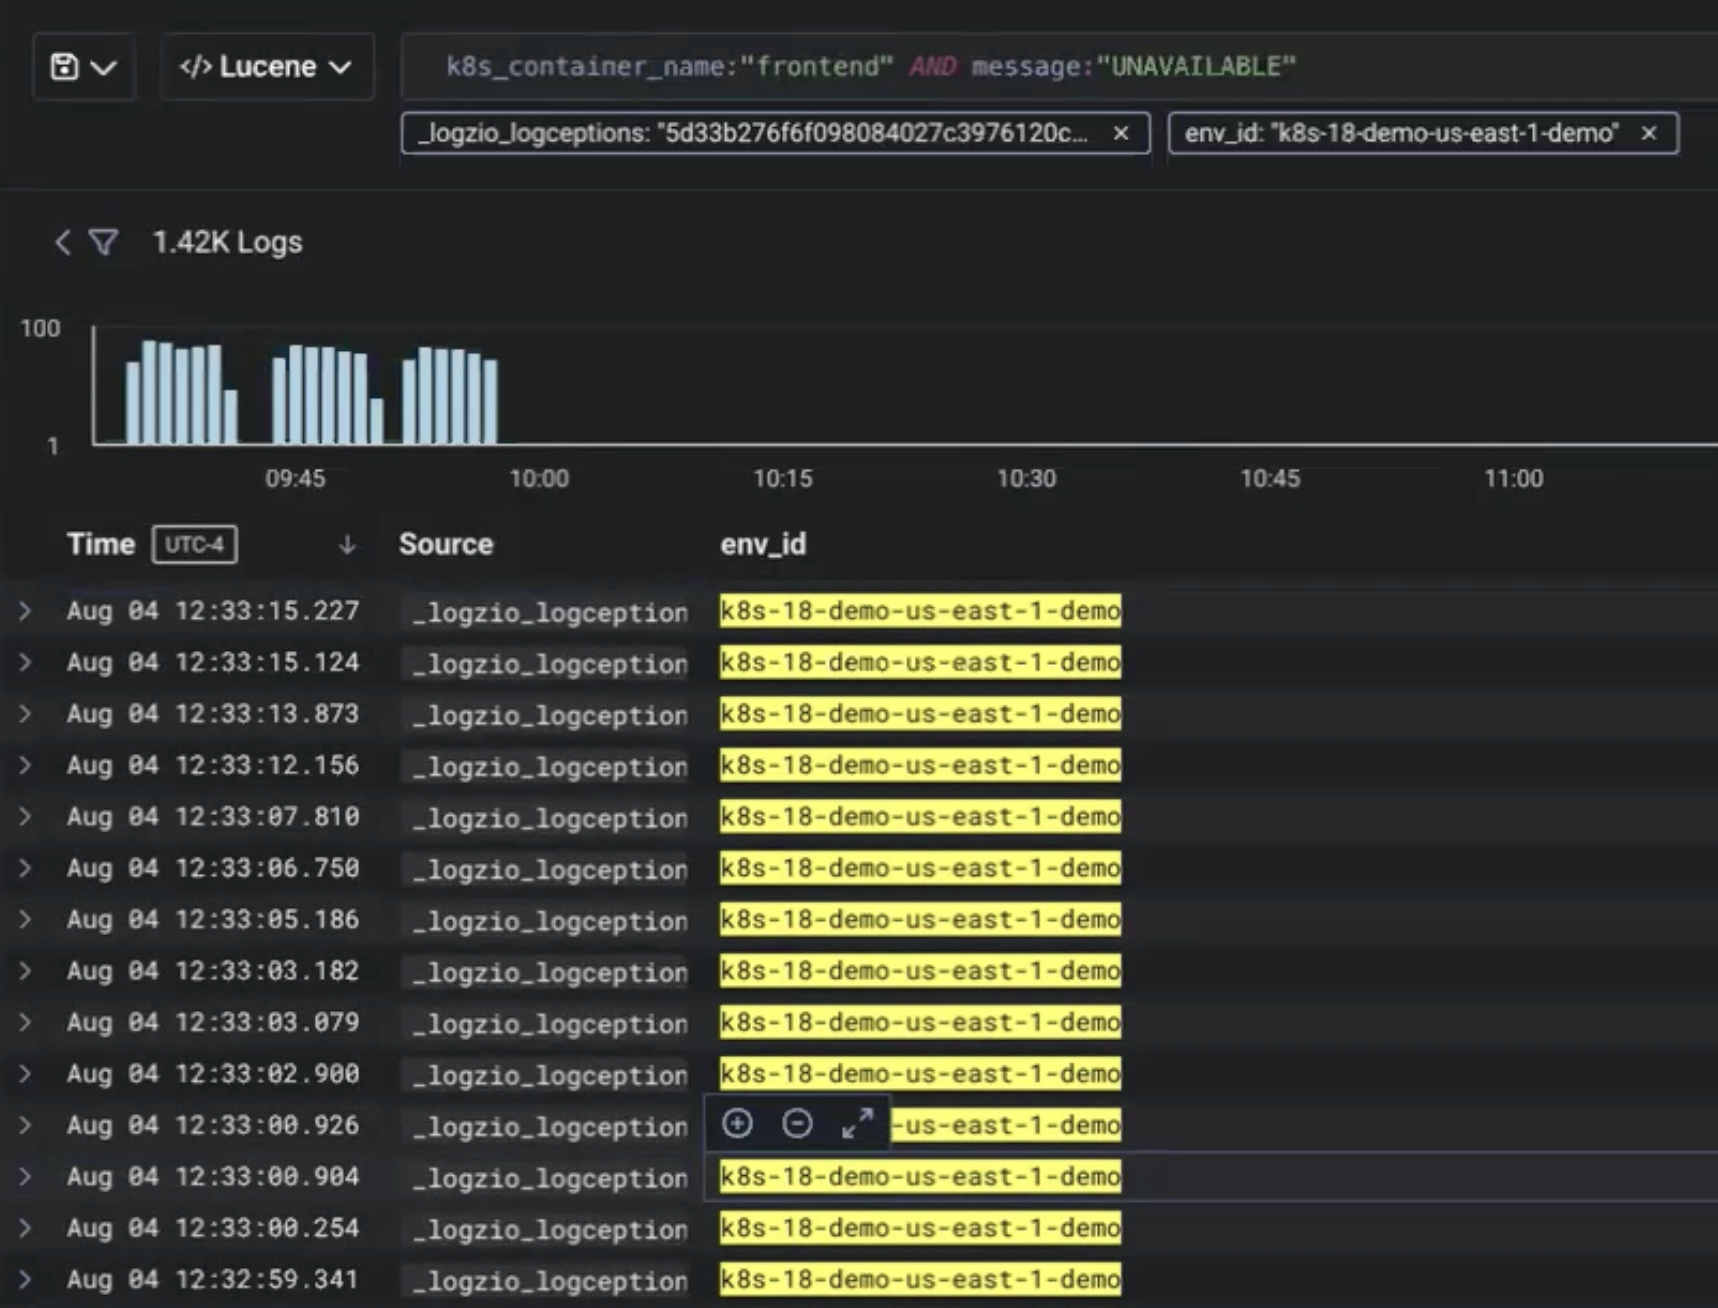
Figure 2: Log search result [Manual vs. AI-Driven Alert Triage and RCA: Who Will Win?]
Next, you review the infrastructure dashboards and find no infrastructure issues. This suggests that the error is related to interservice communication. A quick time check shows that you spent about 2 hours writing queries and concluded that the error involved service-to-service communication. Despite spending this amount of time, you have yet to identify the exact issue.
Now you decide to try the AI agent feature for performing root cause analysis. The AI agent employs an approach identical to yours. As shown in Figure 3, the AI agent first forms a strategy to get to the root cause:
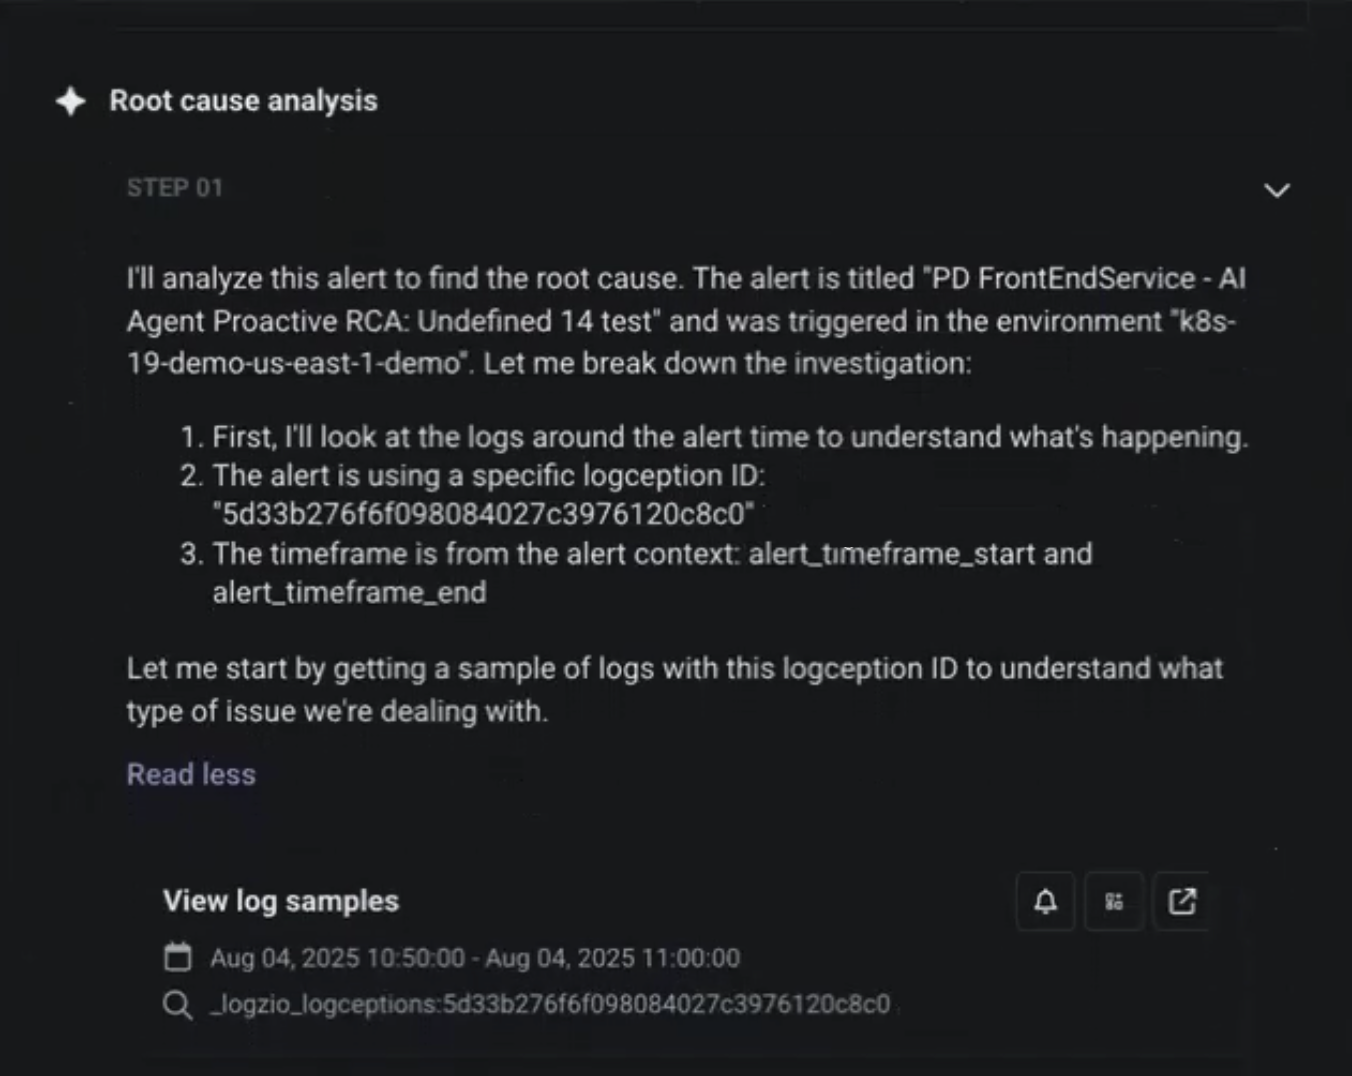
Figure 3: Step 1 of the approach chosen by the AI agent
Next, as shown in Figure 4, it reports the status and analyzes the distribution of the error.
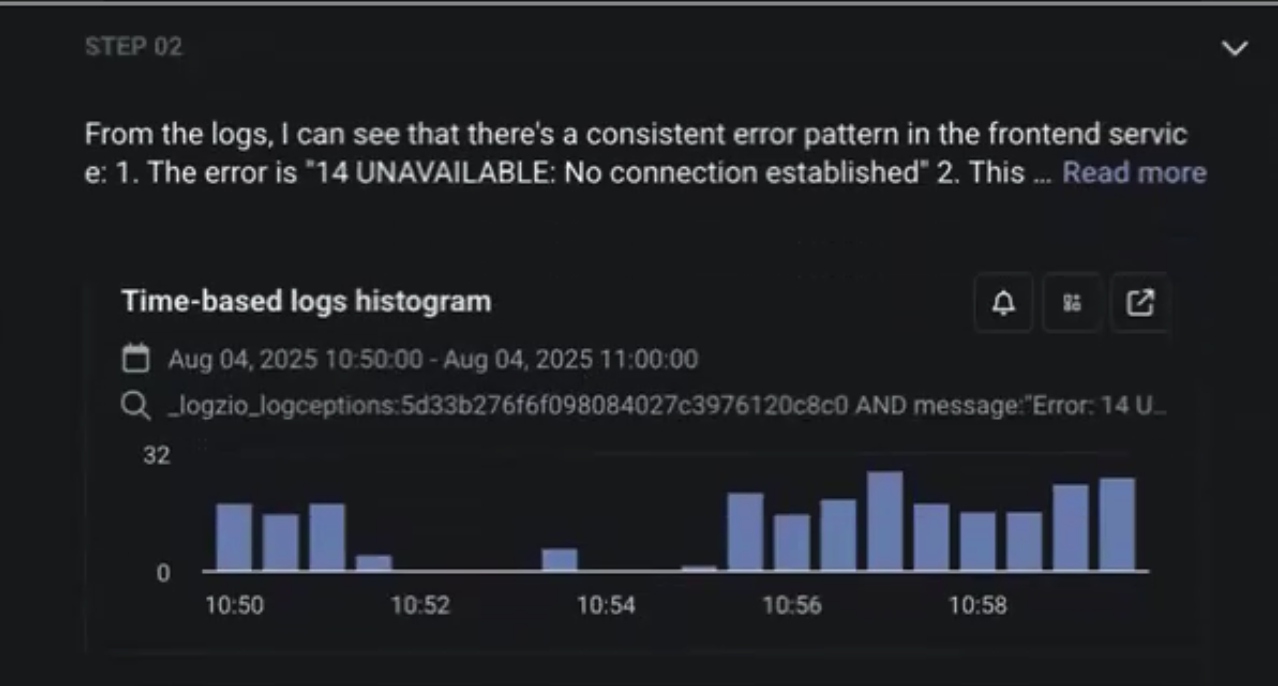
Figure 4: Step 2 of the approach chosen by the AI agent
Next, as shown in Figure 5, it finds that 14 events occurred within a specific timeline. It concludes that the issue affects the frontend service and is related to the Recommendations API.
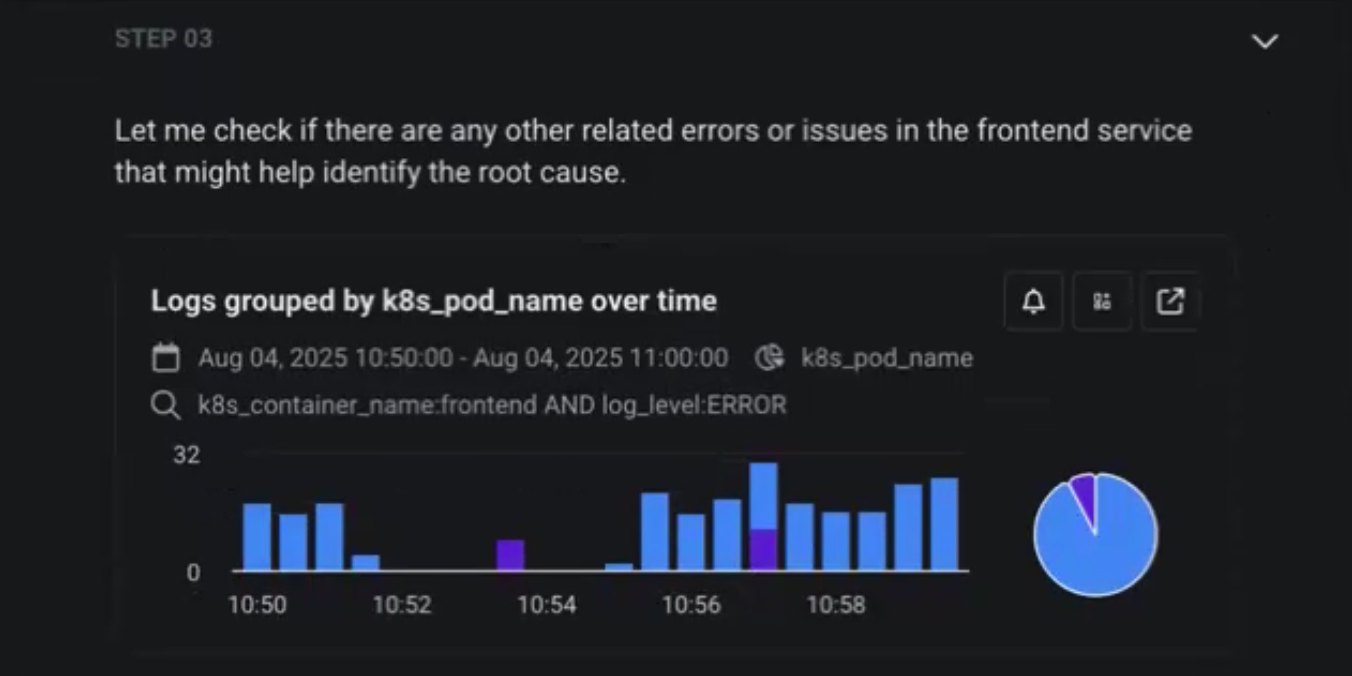
Figure 5: Step 3 of the approach chosen by the AI agent
Next, it determines whether any other errors occurred and provides an RCA. As shown in Figure 6, the primary issue occurred when the Amazon EKS-based frontend containers began invoking the Recommendations API.
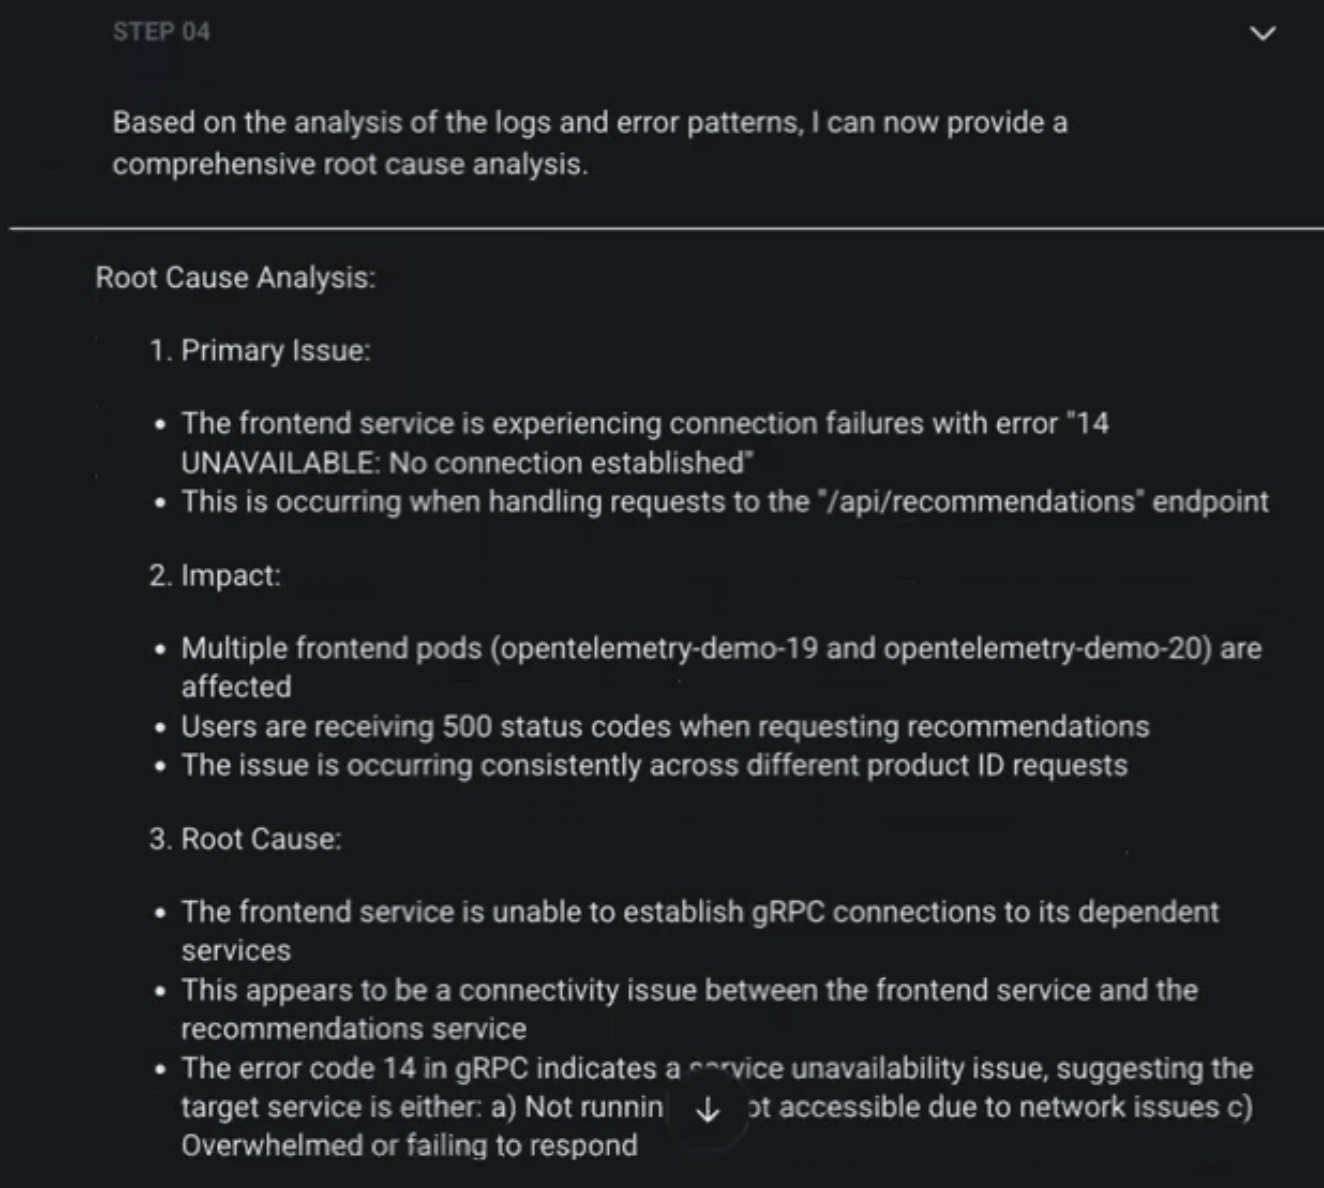
Figure 6: Step 4 of the approach chosen by the AI agent
Finally, as shown in Figure 7, it summarizes the next steps, including checking the recommendations service, reviewing service discovery configuration, and analyzing logs associated with the recommendations service.
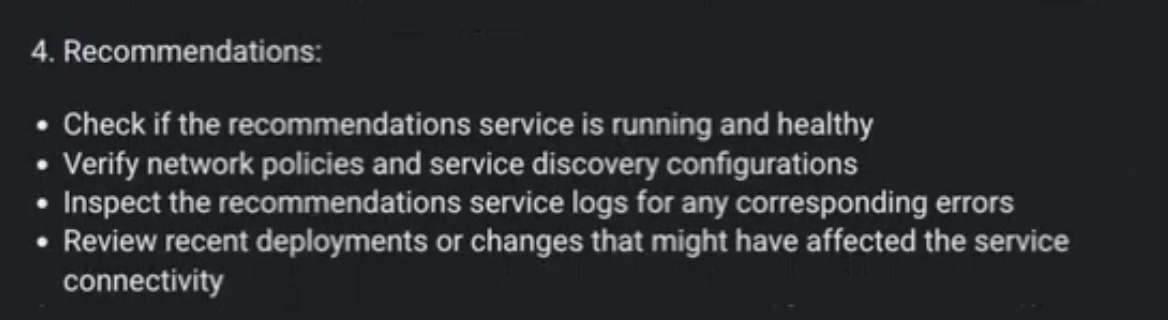
Figure 7: Recommendations provided by the AI agent
To summarize, the Logz.io AI agent completed the analysis in under a minute and produced a comprehensive, accurate assessment. This ability will enable you to identify and resolve issues much faster.
Natural language troubleshooting
Use case 2: Troubleshoot logs using natural language queries
As a tenured SRE, you acquire very specific knowledge over the years from your experiences working with numerous applications, diverse frameworks, and varied infrastructures. Your understanding of the application, combined with your knowledge and intuition, enables you to debug complex and novel issues and solve challenges caused by systems behaving unexpectedly. However, getting to the crux requires iterative log lookups based on a specific criterion, each more complex than the previous. Writing these queries is time-consuming.
An AI-based feature offered by the Sumo Logic Log Analytics Platform can significantly accelerate troubleshooting by providing a natural language interface for asking questions and translating them into a search query language.
About Sumo Logic Log Analytics Platform
You can use Sumo Logic to get end-to-end visibility across your AWS environment and accelerate root cause analysis. It provides out-of-the-box analytics and prebuilt dashboards for AWS tools like Amazon EC2, Amazon Simple Storage Service (Amazon S3), and Elastic Load Balancing (ELB), and helps minimize mean time to resolution (MTTR).
You decide to test it by simulating your morning check-in routine. Each morning, you first check for any failures that occurred while you were away. As shown in Figure 8, instead of writing a query in search query language, you type the query “Query to find all events where the log.category contains the word fail”. The Sumo Logic platform converts a natural-language query into a search query, applies the appropriate filters, and displays the results. It also provides contextual suggestions.
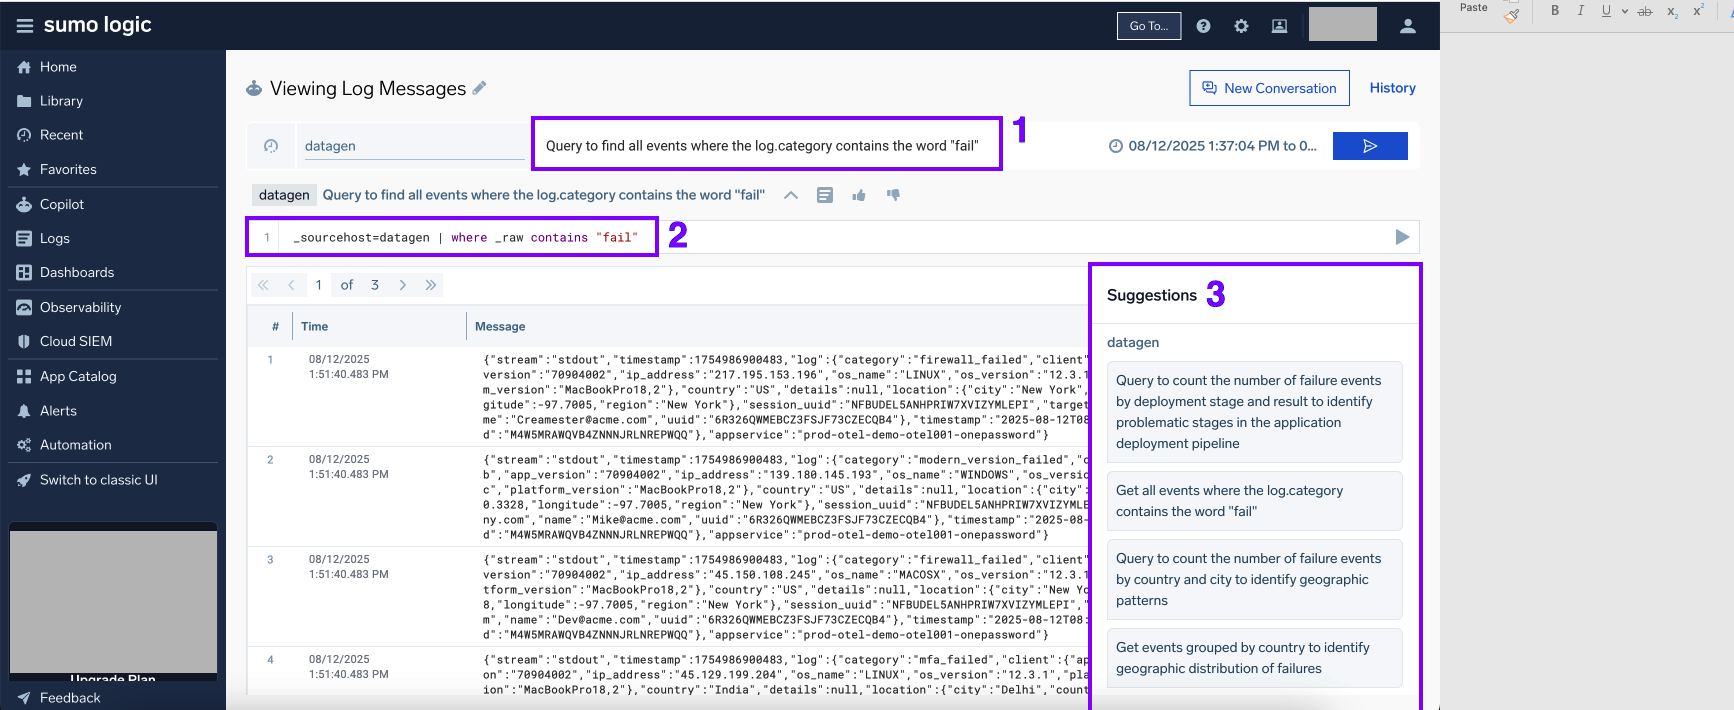
Figure 8: Sumo Logic search console
To better understand the impact of these failures across regions, you decide to further explore logs using the AI-guided suggestion.
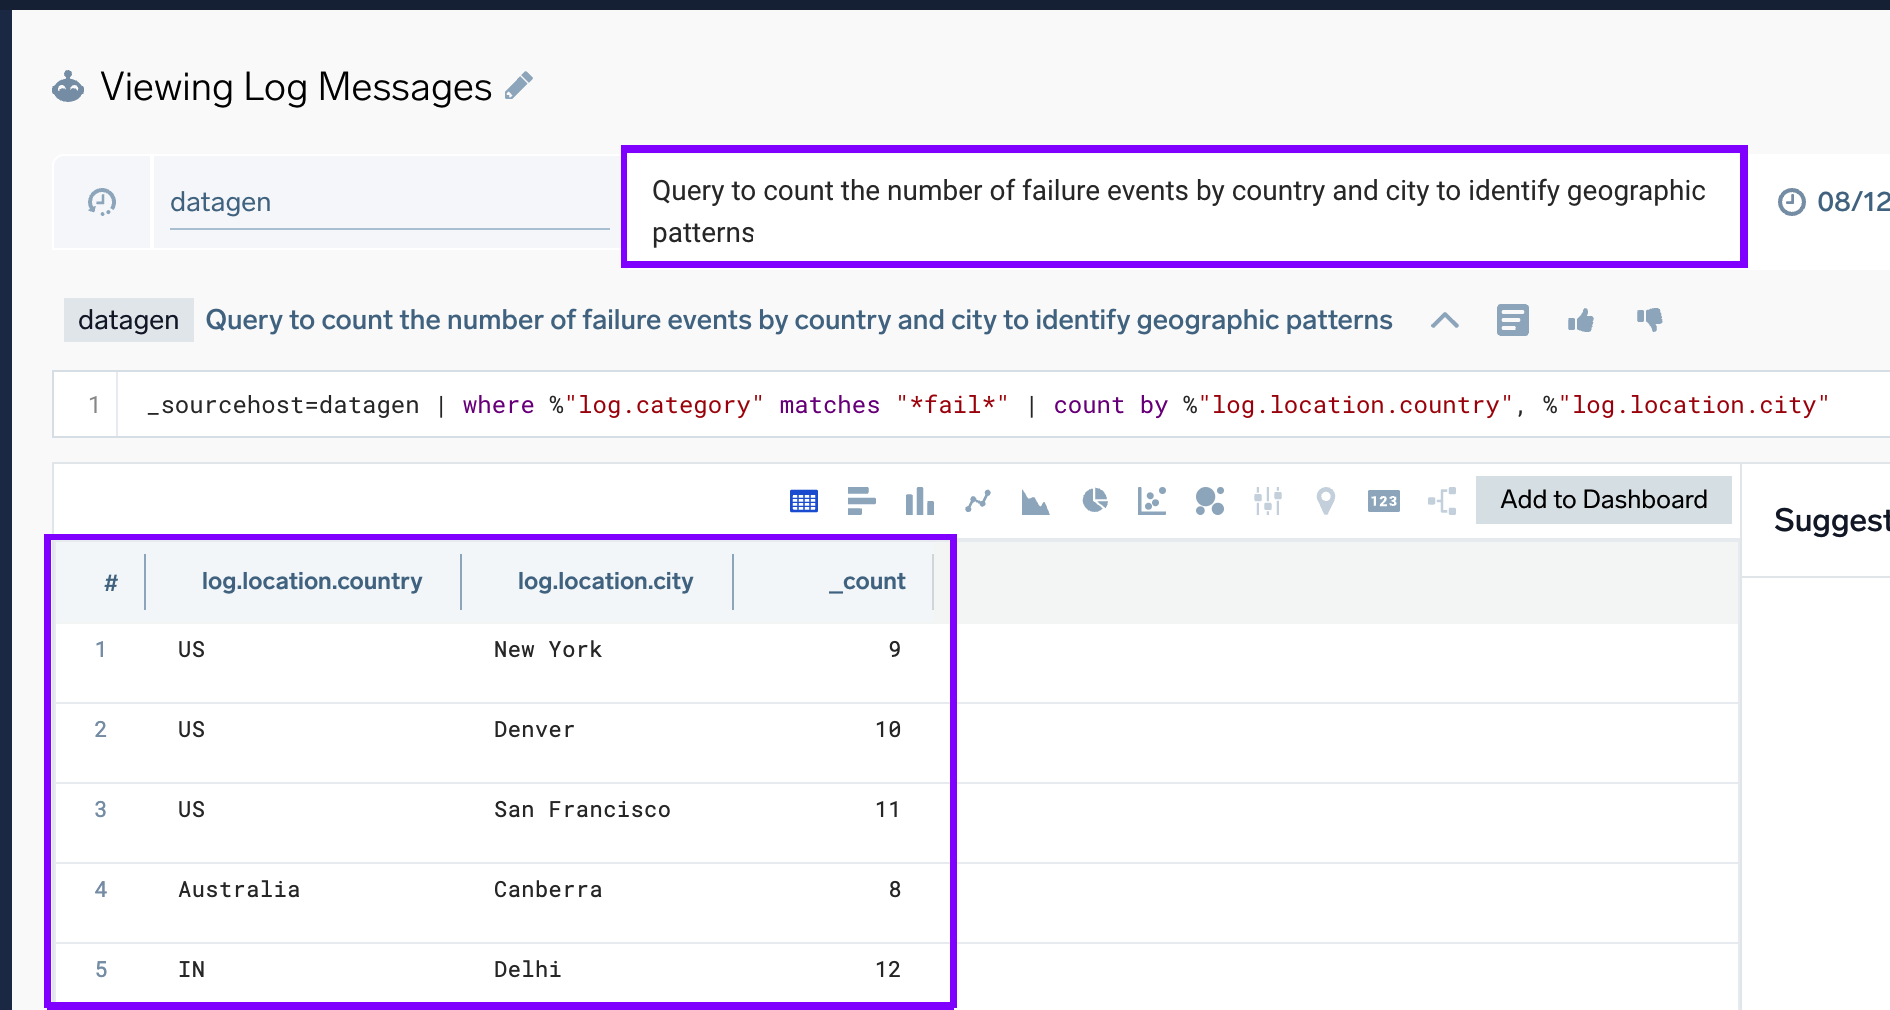
Figure 9: Search results
As shown in Figure 9, the result provides further insights into all regions affected by the error. Sumo Logic also transforms the query results into easy-to-understand, automated visualizations that you can add to a dashboard.
Ultimately, you run your standard morning queries and add them to a dashboard, as shown in Figure 10.
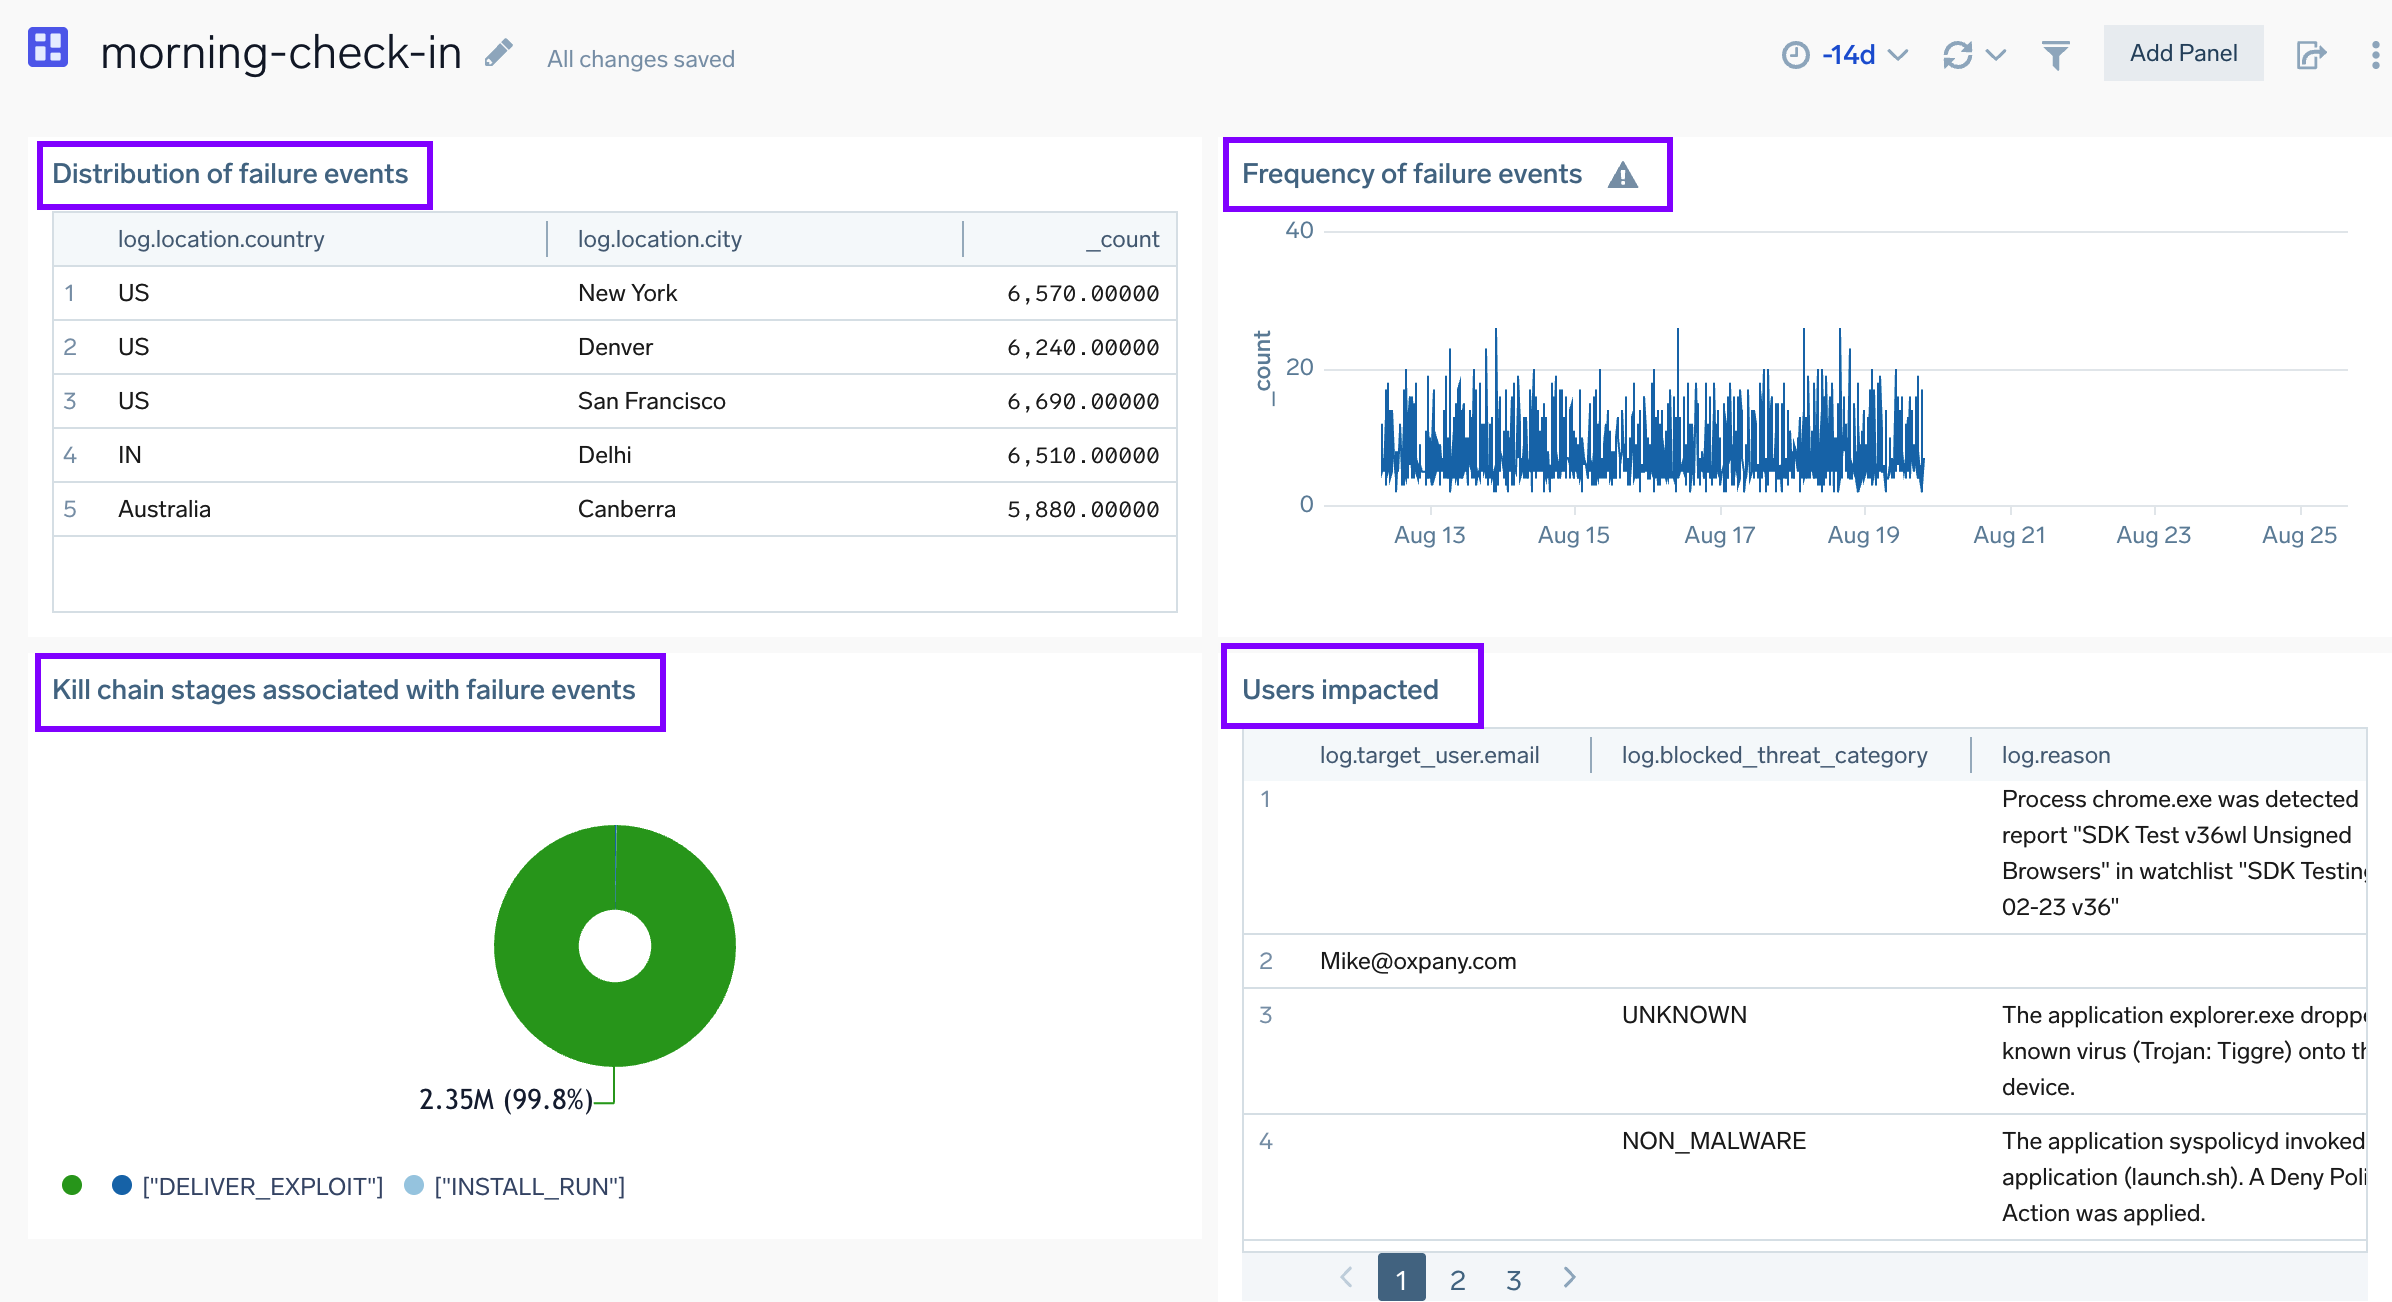
Figure 10: Dashboard showing a unified view of application errors
The dashboard can save you about 20 minutes each day, and its natural language query-conversion capability will help you debug and identify the root cause of unknown issues much faster.
Predictive incident response
Use case 3: Automate incident response using AI-driven forecasting capabilities
Your application has a module that runs proprietary code on GPU-based Amazon EC2 instances. These instances sometimes fail due to disk capacity issues, resulting in customer impact. As an SRE, you are responsible for keeping all Amazon EC2 instances operational. To ensure you catch issues such as disk capacity outages early, you need a solution with advanced predictive capabilities.
You learn about Dynatrace Davis® AI, which provides machine-learning-powered workflows that forecast a specific metric using historical time-series data and send alerts before the event occurs. You decide to give it a try.
About Dynatrace
Dynatrace is a full-stack observability platform you can use for monitoring your AWS-based workloads. Dynatrace integrates with many AWS services, including Amazon EC2, AWS Lambda, Amazon Elastic Container Service (Amazon ECS), Amazon EKS, AWS Fargate, and Amazon Bedrock.
To begin, you install Davis® for Workflows from Dynatrace Hub [Dynatrace Hub] and build a scheduled workflow. Within the workflow, you select Generic Forecast Analysis as the analyzer and specify the time-series data using the following DQL query:
timeseries avg(dt.host.disk.free), by:{dt.entity.host, dt.entity.disk}, bins: 120, from:now()-7d, to:now()
The analyzer’s output is a prediction that you input into a small typescript code to test whether the prediction exceeds the configured threshold. Then, as shown in Figure 11, you set up two remediation actions: sending a Slack message to the operations team and generating a Davis® alert.
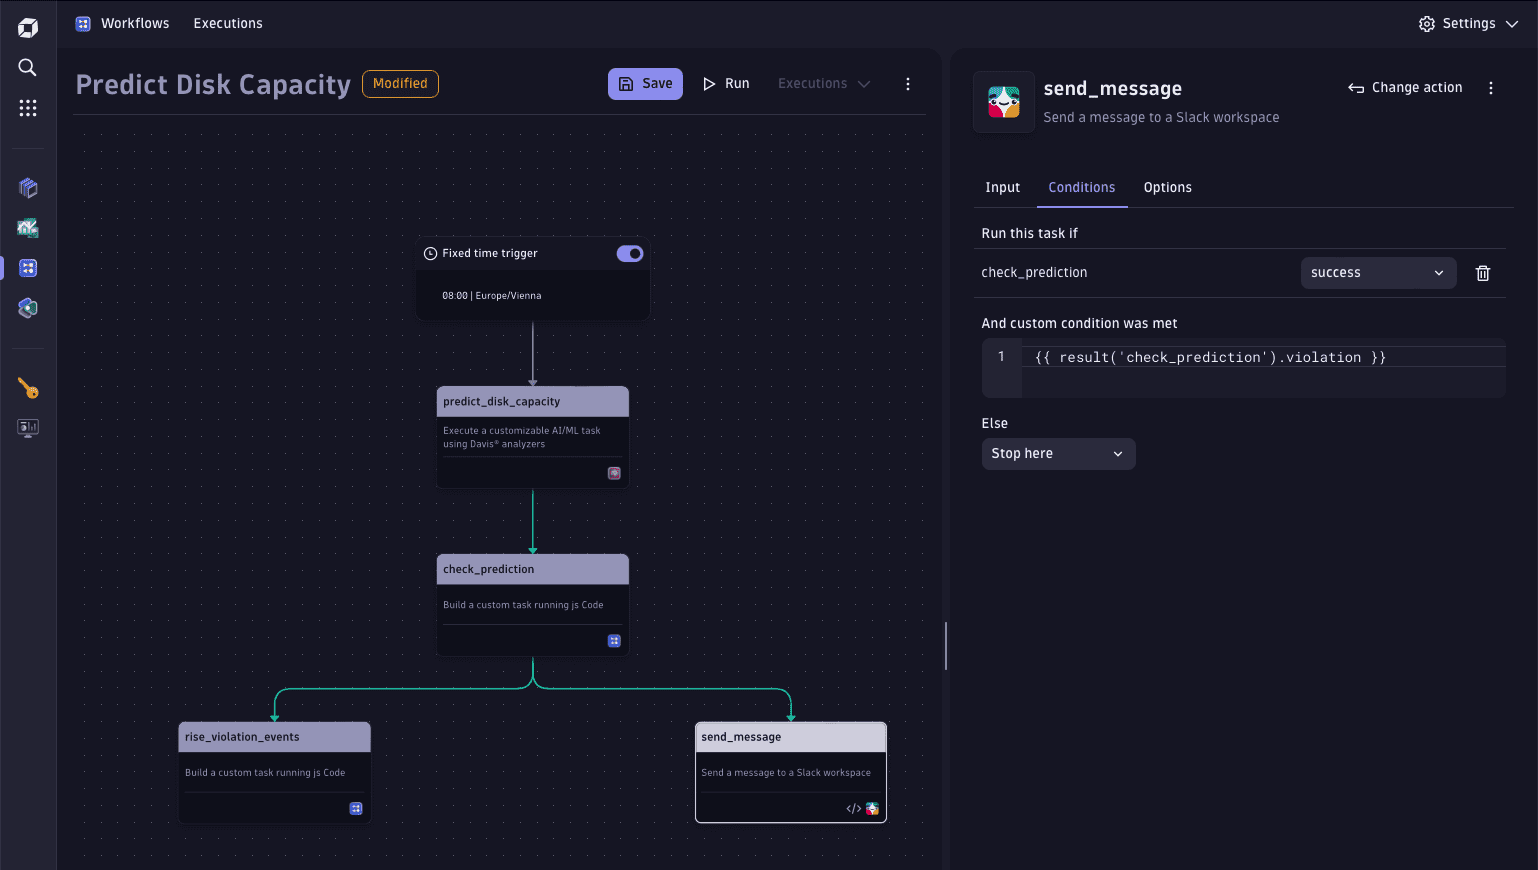
Figure 11: Predict Disk capacity workflow [AI in Workflows - Predictive Maintenance of Cloud Disks]
With the workflow configured, you get notifications whenever Dynatrace Davis® AI predicts a disk outage for the Amazon EC2 instance. The dashboard shown in Figure 12 shows how Dynatrace Davis® AI forecasts an outage on March 27 and prevents the disk from running out on March 31.
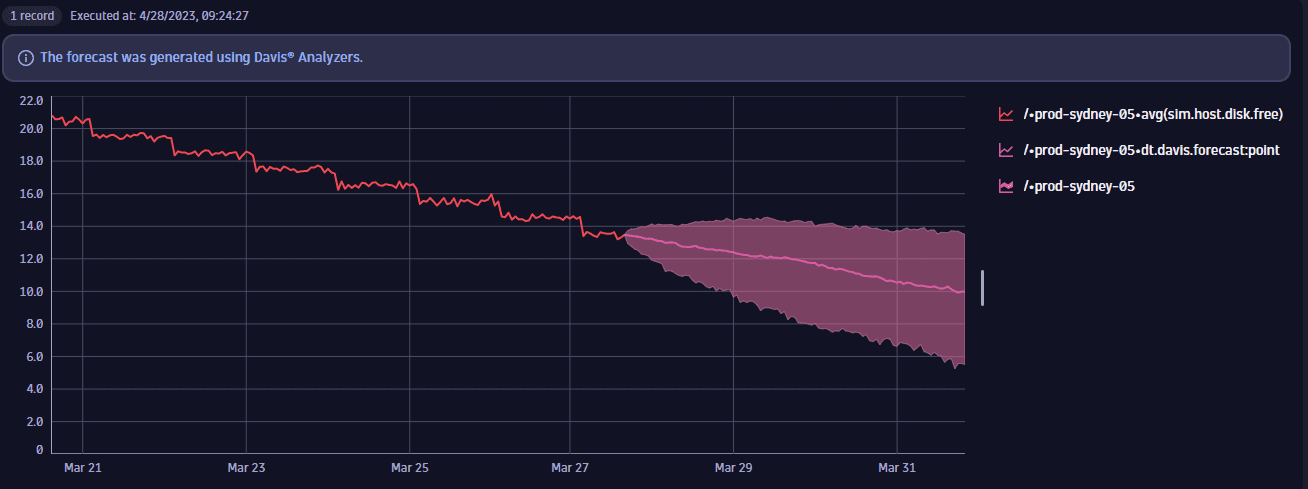
Figure 12: Prediction for Amazon EC2 instance
With a four-day lead time, you could proactively clean up temporary training files, provision additional storage, and reschedule model retraining jobs before they started impacting customers.
To summarize, with forecasting tools like Dynatrace, you can predict issues and act before they occur. Dynatrace also offers anomaly detection capabilities that help you identify anomalies and generate proactive alerts for action.
Key takeaways
By implementing modern ML and AI-based features offered by observability solutions, you can enhance your AWS-based application’s reliability and significantly reduce MTTR.
This article explained how implementing an AI-augmented approach while keeping humans in the loop can help you address the following use cases efficiently:
- Using AI agents to quickly identify root causes of common problems for your AWS-native applications.
- Using natural language queries to debug complex and unique issues.
- Setting up predictive alerts for your AWS infrastructure components so you can act before problems occur.
- Combining third-party software solutions from AWS Marketplace with your AWS-native tooling to achieve efficiency in the monitor and observe stage.
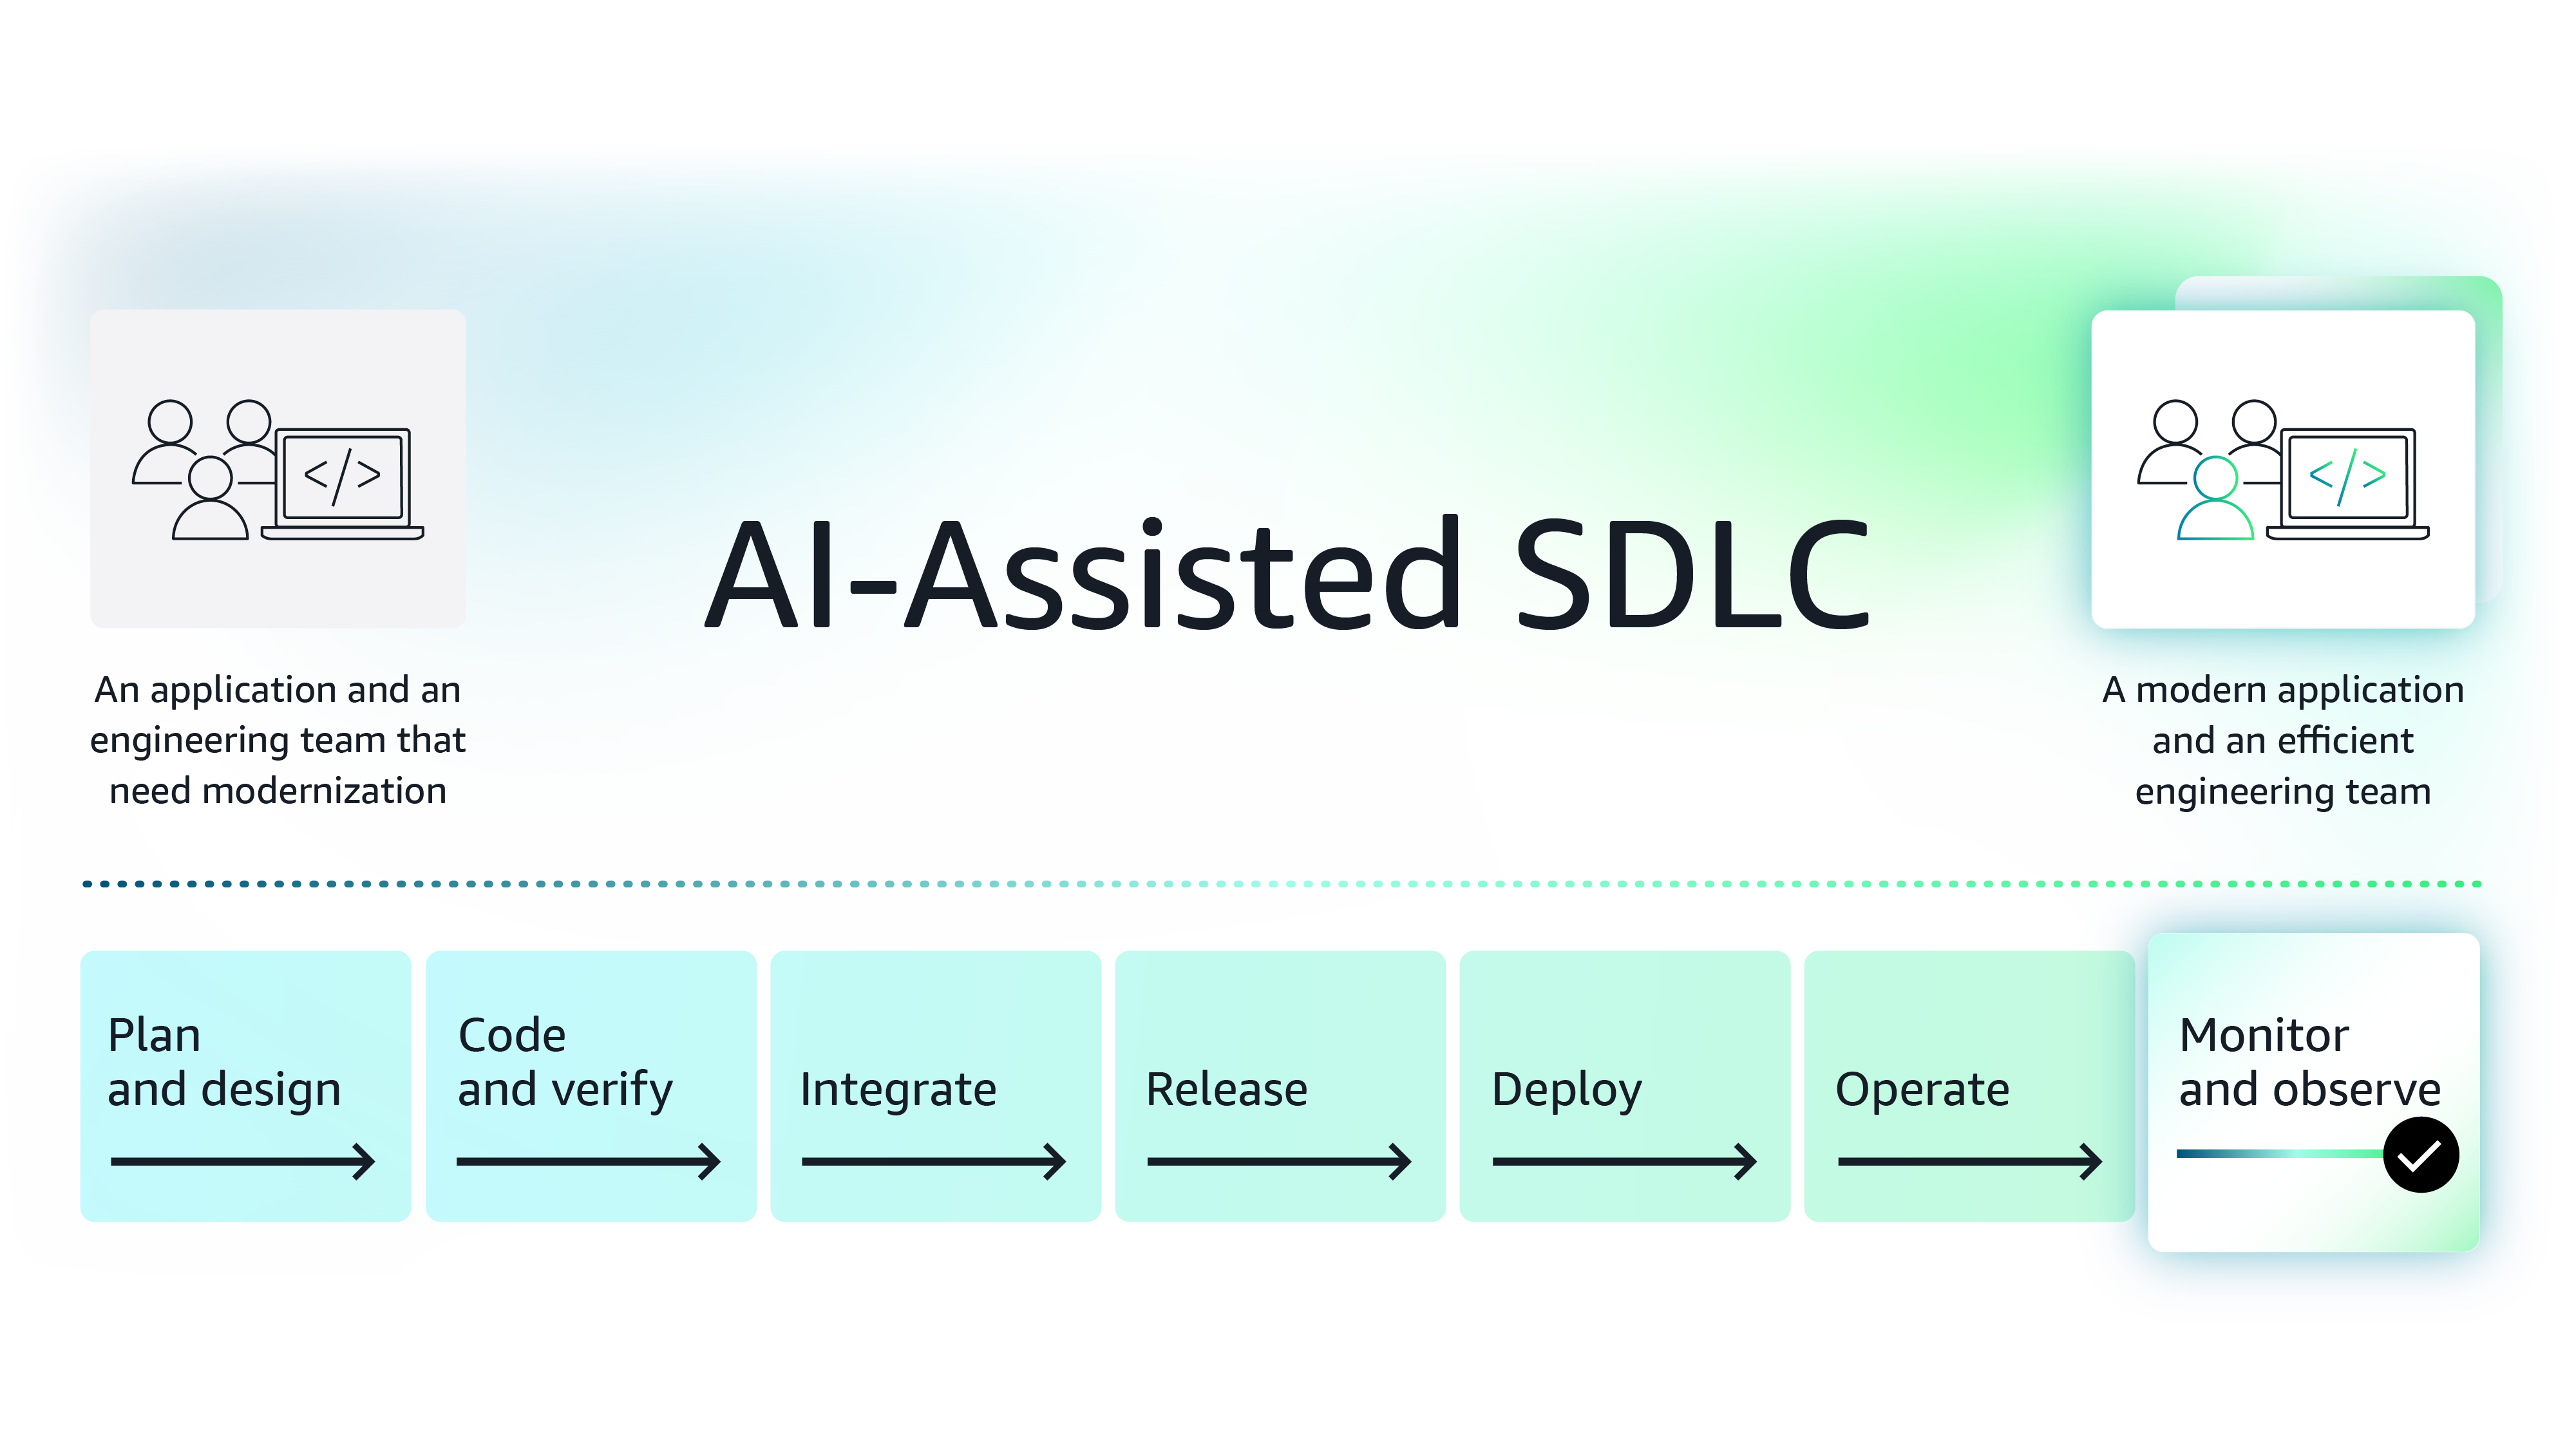
Figure 13: Improve monitoring and observability phases of software development lifecycle using modern, AI-based tools
Next steps
While this article introduces three solutions, AWS Marketplace is a curated digital storefront, comprised of Agentic and Generative AI third-party software that can help you make the monitor and observe stage more efficient. AWS also offers AWS DevOps Agent, which can help you optimize your DevOps workflows. Organizations looking for ways to boost efficiency by integrating AI into various aspects of their SDLC, can explore these tools further, conduct POCs, and then procure the software in AWS Marketplace.
Note on procuring third-party software for your team - Procuring third-party software is made easier in AWS Marketplace because enterprise organizations save procurement time and costs using standard contracts, flexible pricing models, custom pricing and term negotiations with vendors and consulting partners, and consolidated license and spend management.
Featured tools

Explore the series
Why AWS Marketplace for on-demand cloud tools
Free to try. Deploy in minutes. Pay only for what you use.
Featured tools are designed to plug in to your AWS workflows and integrate with your favorite AWS services.
Subscribe through your AWS account with no upfront commitments, contracts, or approvals.
Try before you commit. Most tools include free trials or developer-tier pricing to support fast prototyping.
Only pay for what you use. Costs are consolidated with AWS billing for simplified payments, cost monitoring, and governance.
A broad selection of tools across observability, security, AI, data, and more can enhance how you build with AWS.