Streamline feature release readiness with AI
Manage release complexity with infrastructure as code, automated environment provisioning, and intelligent observability, so every release is predictable and reversible.
About the series
This article is part of a multi-part Amazon Web Services (AWS)–authored series that explores the use of modern DevOps tools and AI-based features to accelerate software development and maintenance on AWS. The first article in this series introduces a fictional scenario, with detailed background on the example.com application and the team managing it. This article focuses on the release phase of the software development lifecycle (SDLC). You will learn how modern features and AI-based capabilities from independent software vendors (ISVs), when used alongside AWS services, can help you minimize release risk by providing a detailed deployment plan for review and enabling comprehensive monitoring of your application performance against a baseline.
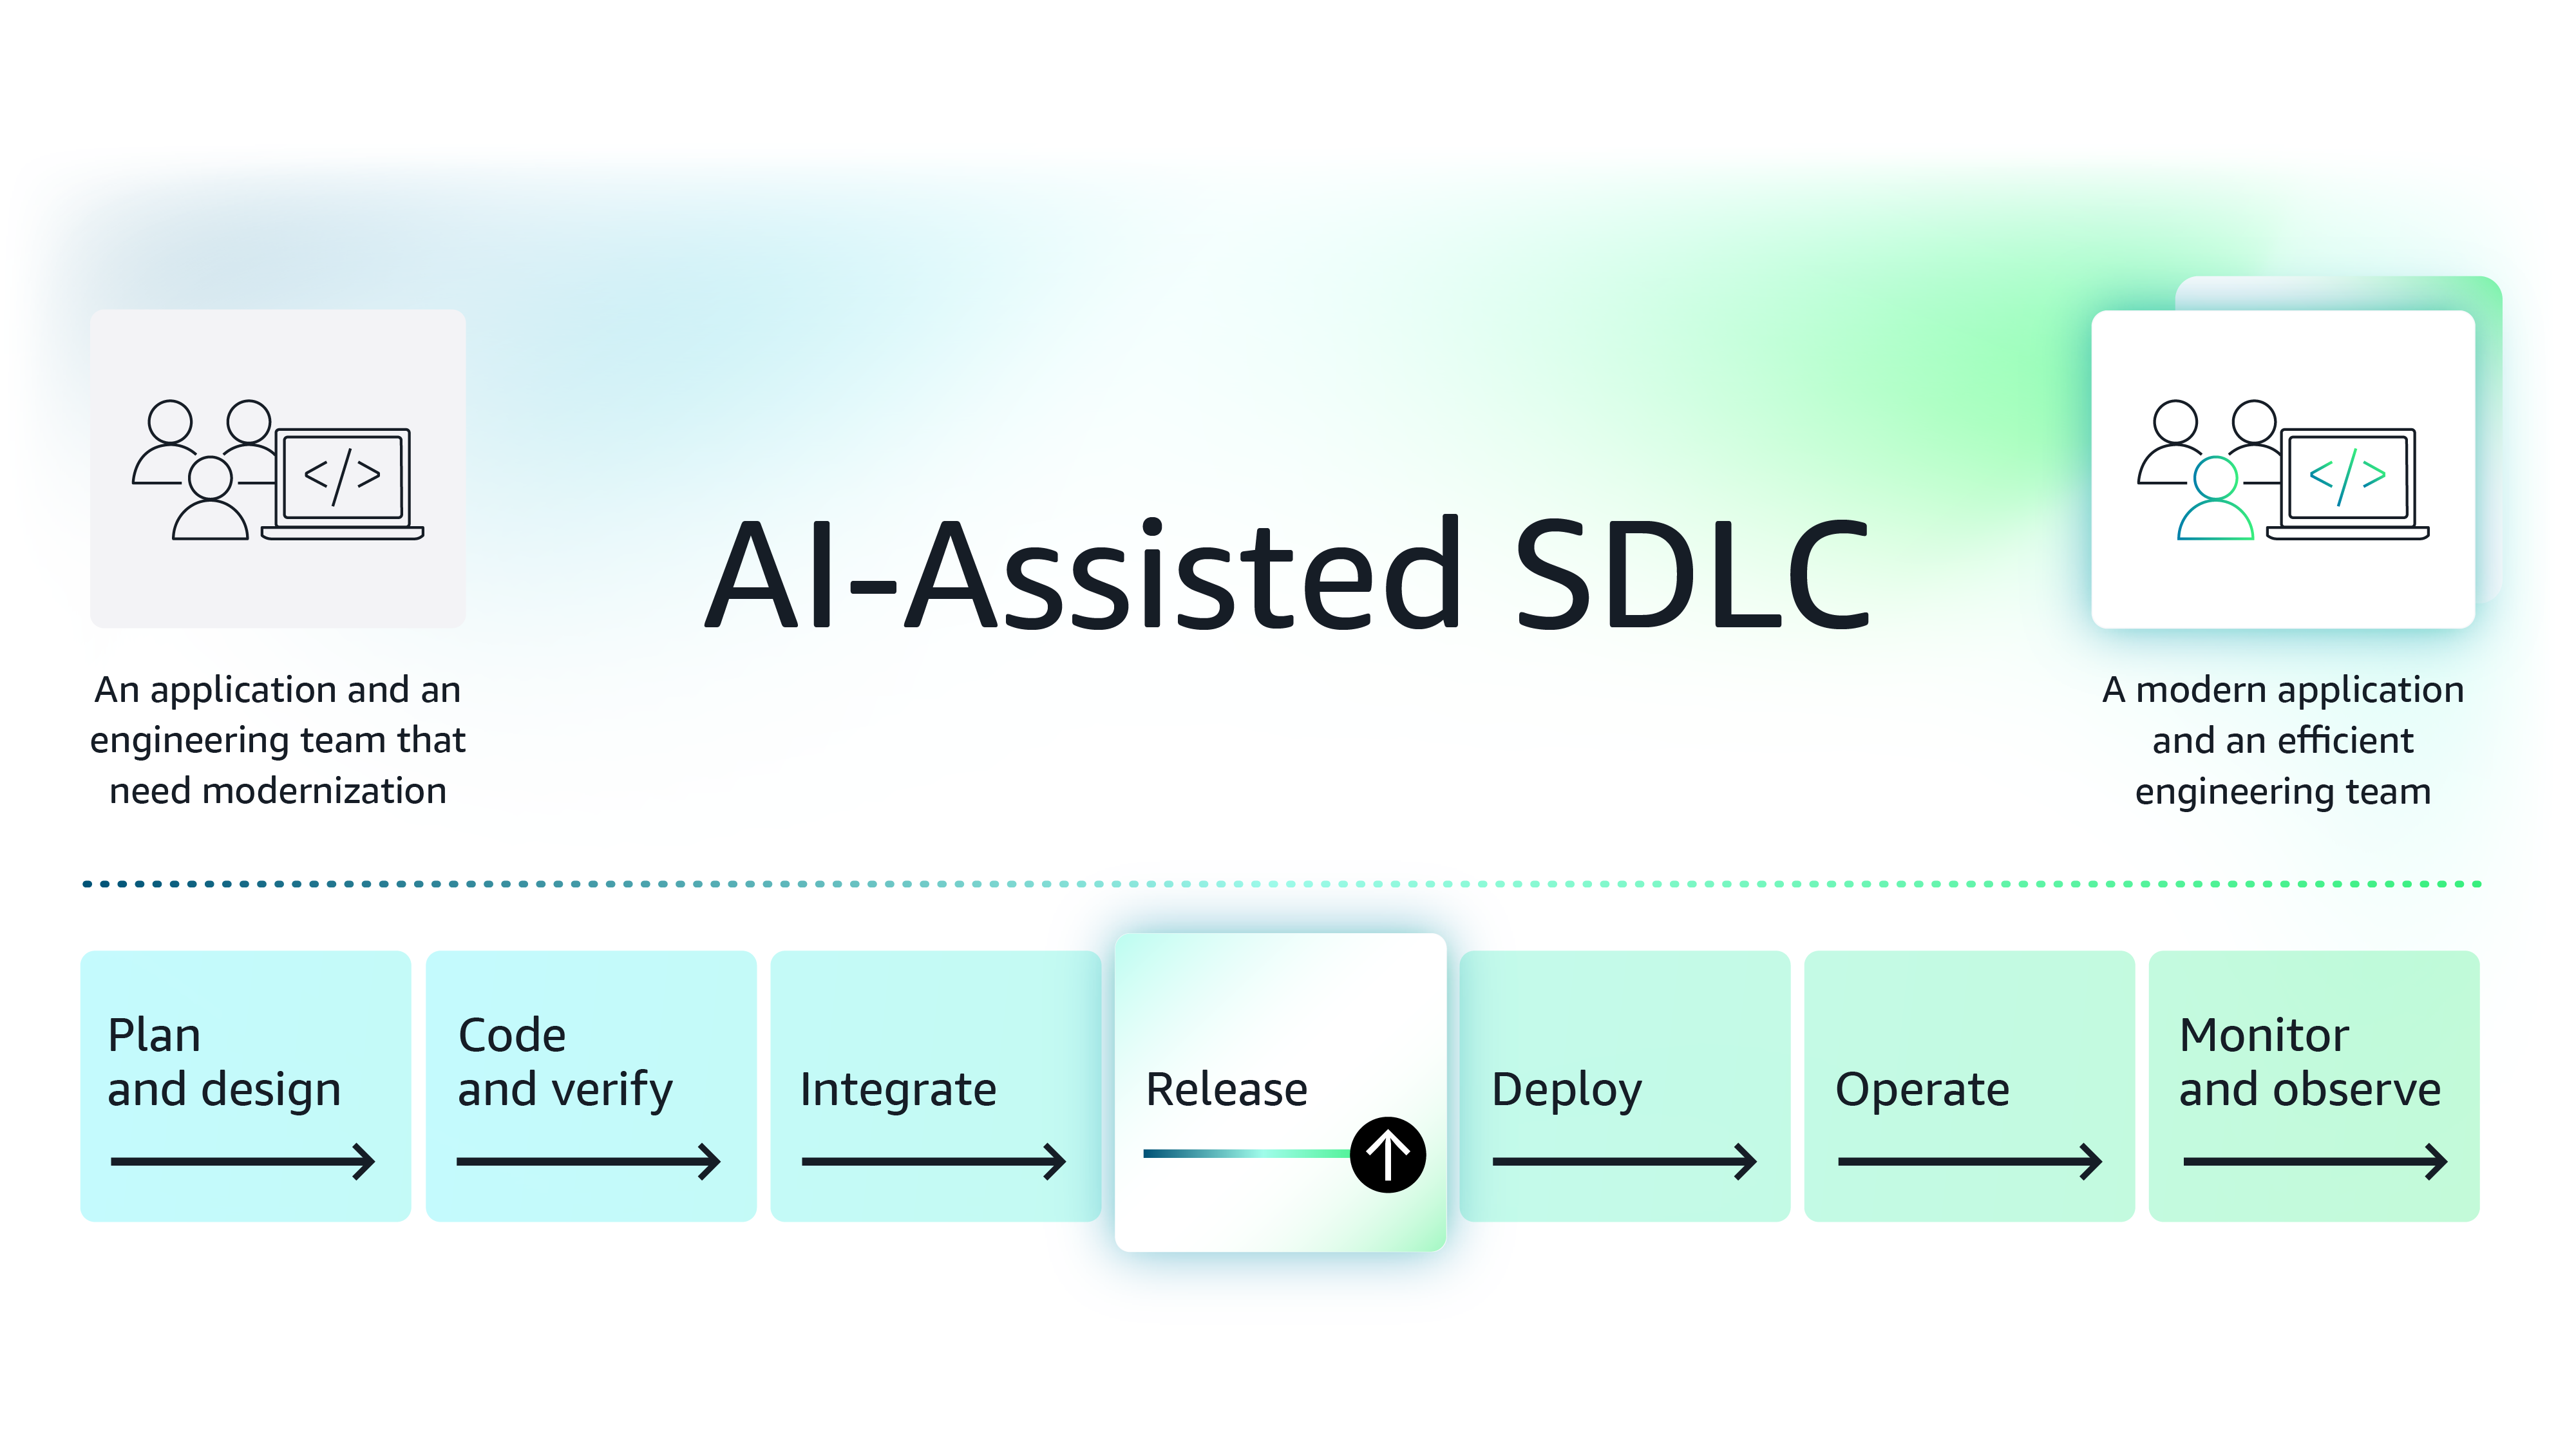
Figure 1: The modernization journey of the example.com application
Background – You are a shared SRE (Site Reliability Engineer) brought on board to support the example.com application. Over the coming months, the team plans to roll out incremental features while modernizing the existing application architecture. Sprints follow a set, consecutive schedule, and to prevent delays, the Principal Engineer (PE) has asked you to ensure that the release phase progresses smoothly. The release phase is crucial because it is time-bound, and important activities, such as confirming application and feature readiness, must occur in a short timeframe. As an SRE, it is your job to minimize release risk by addressing the following important aspects for this phase:
- Automatically build a detailed deployment plan for review - It is important to exercise caution when working with the production environment because even minor changes can directly impact customers and, consequently, the business. To ensure that the right changes reach production, you need a detailed list of changes to be made in the deployment environment. A thorough deployment plan allows you and the PE to review the exact changes, helping identify issues early and increasing confidence in the release.
- Ensure the application’s performance does not degrade - The example.com application’s slow performance has caused numerous issues. Although the team has addressed all performance issues and stabilized the application, you must continue to monitor it to ensure performance remains stable. Each API must be monitored, and you must verify that its performance meets or exceeds the previous baseline.
Automate deployment planning
Use case 1: Automatically build a detailed deployment plan for review
As an SRE, to give the PE and the team clear insight into upcoming changes to the production environment, you need to develop a detailed deployment plan that outlines changes, dependencies, and configurations, along with the order in which resources should be updated or deployed. Having used Terraform, an Infrastructure as Code (IaC) tool, for provisioning resources, you know that it can support the infrastructure provisioning requirements of the example.com application. HashiCorp enables you to bring infrastructure as code expertise directly into your Kiro development workflow, enabling you to simplify writing HashiCorp Configuration Language (HCL) code for provisioning infrastructure. More importantly, Terraform has a terraform plan command that provides the exact list of changes that will occur during the deployment. This detailed information can serve as the deployment plan for the team to review during the release phase. You must run Terraform commands from a reliable remote environment that you, the PE, and your extended SRE team can access, so project deliveries continue even when you’re on vacation.
You come across IBM HashiCorp Cloud Platform (HCP), a managed Terraform service that meets enterprise requirements.
About IBM HashiCorp Cloud Platform (HCP):
HCP is a fully managed platform that offers Terraform as a service, eliminating the hassle of deploying and maintaining it. HCP provides a secure remote execution environment, allowing you and your team to collaboratively manage changes to the application infrastructure.
You decide to do a quick proof of concept to see if it meets expectations.
You start by signing up and installing the Terraform CLI on your computer. The Terraform CLI connects with HCP Terraform, allowing you to trigger remote runs from your local machine. As shown in Figure 2, you run the HCL code to spin up three Amazon Elastic Compute Cloud (Amazon EC2) instances.
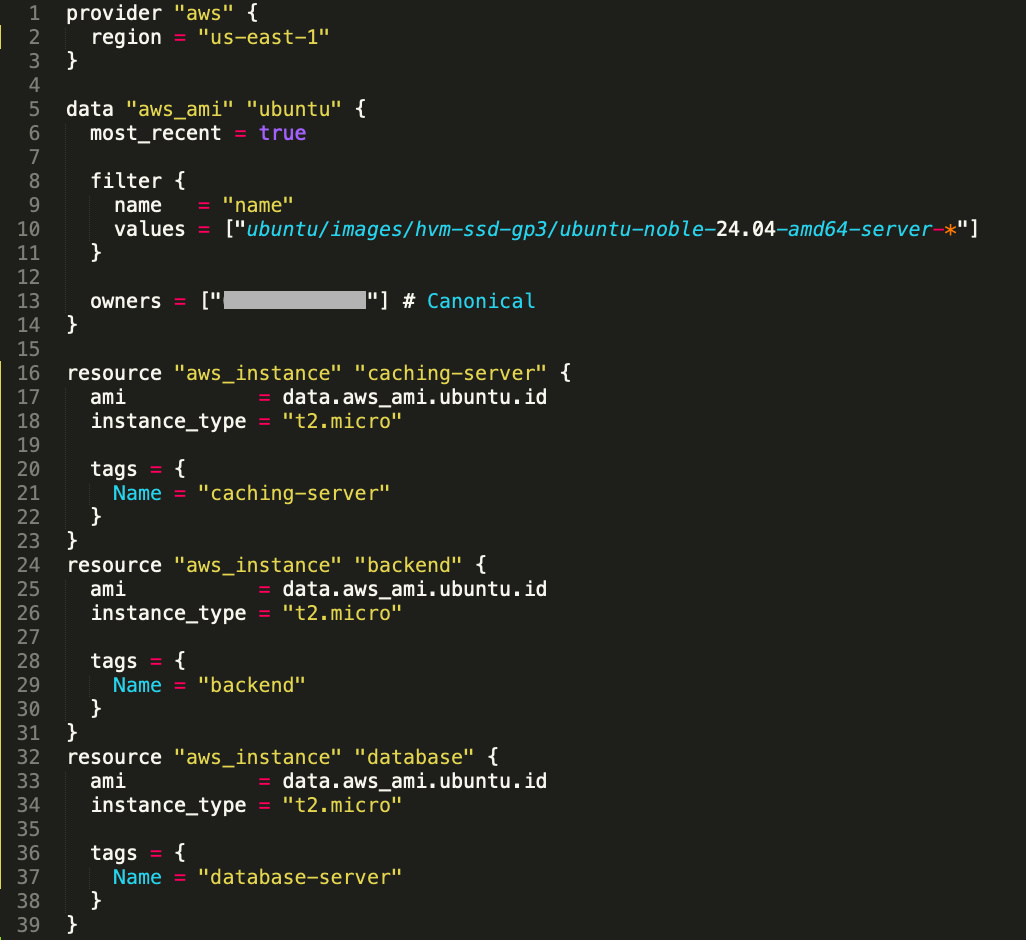
Figure 2: HCL code for spinning up Amazon EC2 instances [Create infrastructure]
Next, you make several changes to the Terraform configuration, including updating the instance type and tags for the Amazon EC2 instances, and replacing the frontend server with a backend caching server. Then you run the terraform plan command using CLI. This produces a detailed deployment plan that you can review from the HCP portal.
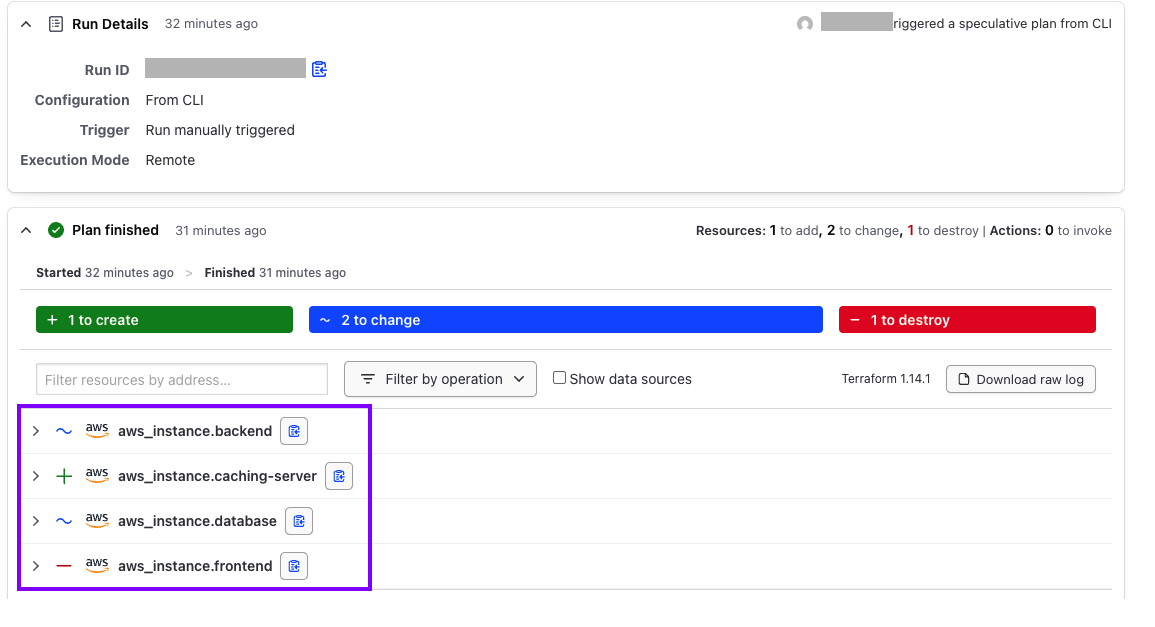
Figure 3: Terraform plan command output [Ensure application performance]
As shown in Figure 3, the plan shows that two resources will be updated, one will be deleted, and one resource will be created. The example shows how Terraform determines which resources to create, delete, or update during deployment. It also determines the sequence in which these changes should be implemented. This detailed deployment plan provides you and the team with an important, auditable checklist to review at the Go/No-Go decision point.
Terraform configuration files can also be stored in a version control system such as GitHub. With HCP Cloud, you can set up a version control workflow for your HCP Cloud workspace. This allows your HCP workspace to monitor repository changes and take appropriate actions. As shown in Figure 4, whenever Terraform detects a commit or pull request on branches other than the default repository, it runs terraform plan. Additionally, it adds a new check to the GitHub pull request and links it to the plan command. This check passes only if the terraform plan command completes successfully.
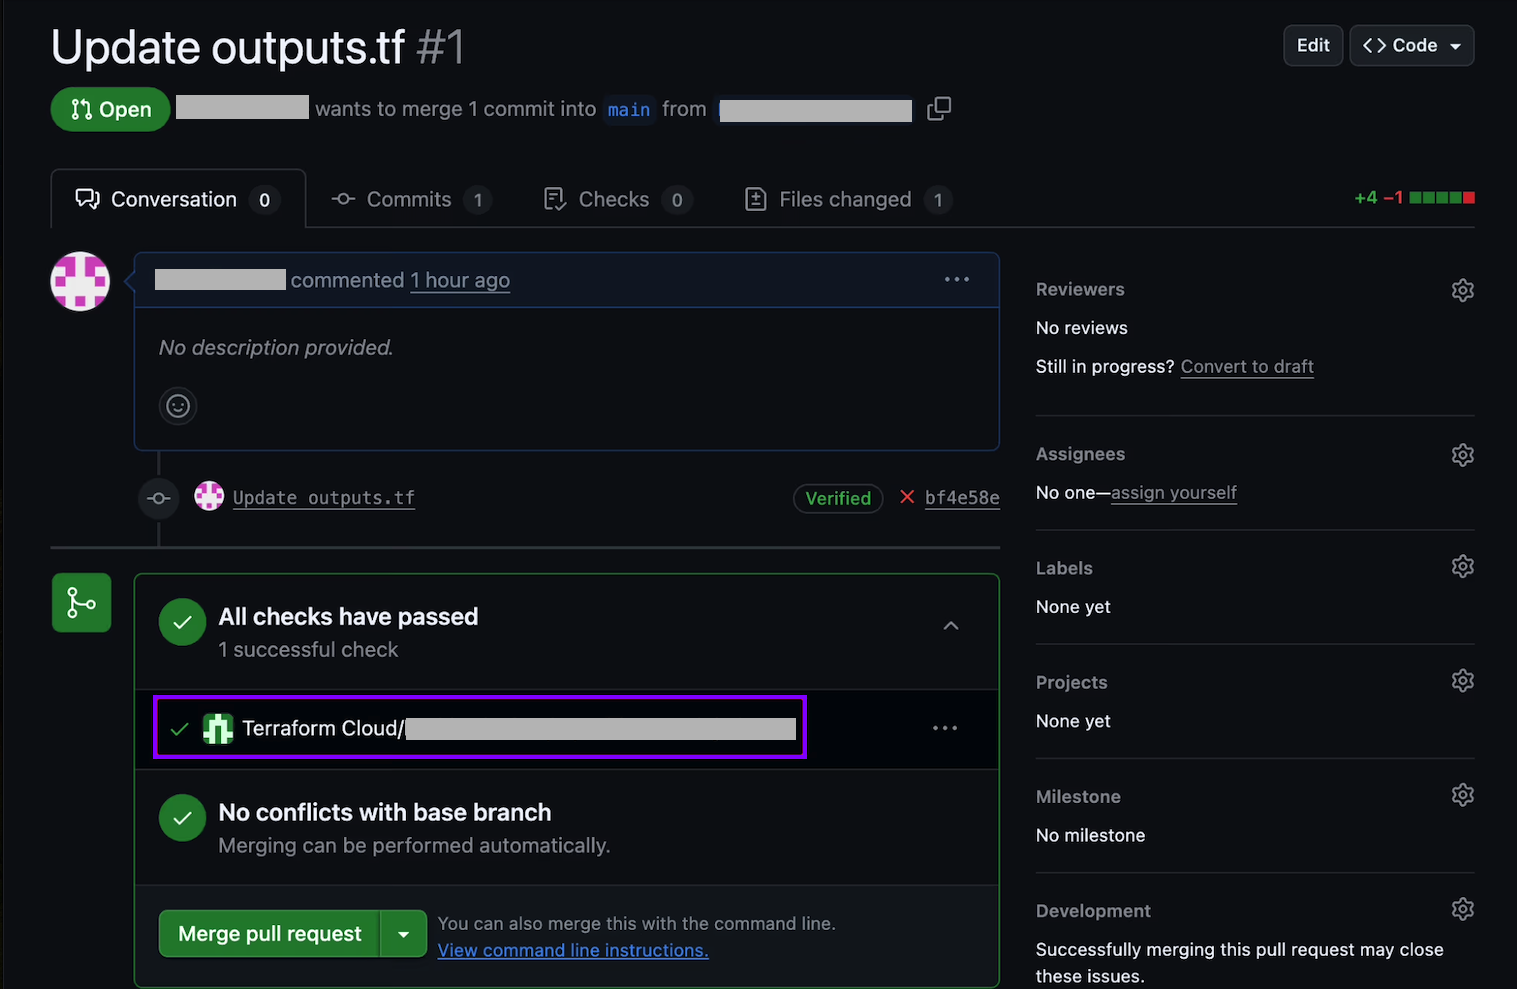
Figure 4: Version-controlled workflow triggering terraform plan command as part of a check [Ensure application performance]
HCP runs the terraform apply command only after the pull request is merged or commits are made to the default branch, which is typically the main branch.
In summary, this approach allows you to modernize the application deployment process and easily create a detailed deployment plan for the team to review. Furthermore, if you wish to introduce further efficiencies into the CI/CD process by implementing an agentic approach, you can use the Terraform MCP server available on AWS Marketplace.
Ensure application performance
Use case 2: Ensure the application’s performance does not degrade
By the time the sprint reaches the release phase, the application should match its expected production performance. At this stage, you need to monitor the application’s performance against a baseline and confirm that API-level performance has not degraded.
As you begin exploring solutions, you discover New Relic: the Observability Platform. New Relic offers features that make it easy to monitor the application’s performance, allowing you to identify problems before they reach production.
About New Relic
New Relic offers complete visibility into application performance. It includes a telemetry data platform that enables you to ingest, analyze, and alert on all your metrics, events, logs, and traces.
You decide to explore it further. After subscribing to New Relic, you connect your AWS account with it and ingest metrics via its Amazon CloudWatch integration. Next, you install New Relic infrastructure agents on your AWS compute resources, such as Amazon EC2, containers, or a Lambda function. After integration, you begin to see detailed metrics in the New Relic console.
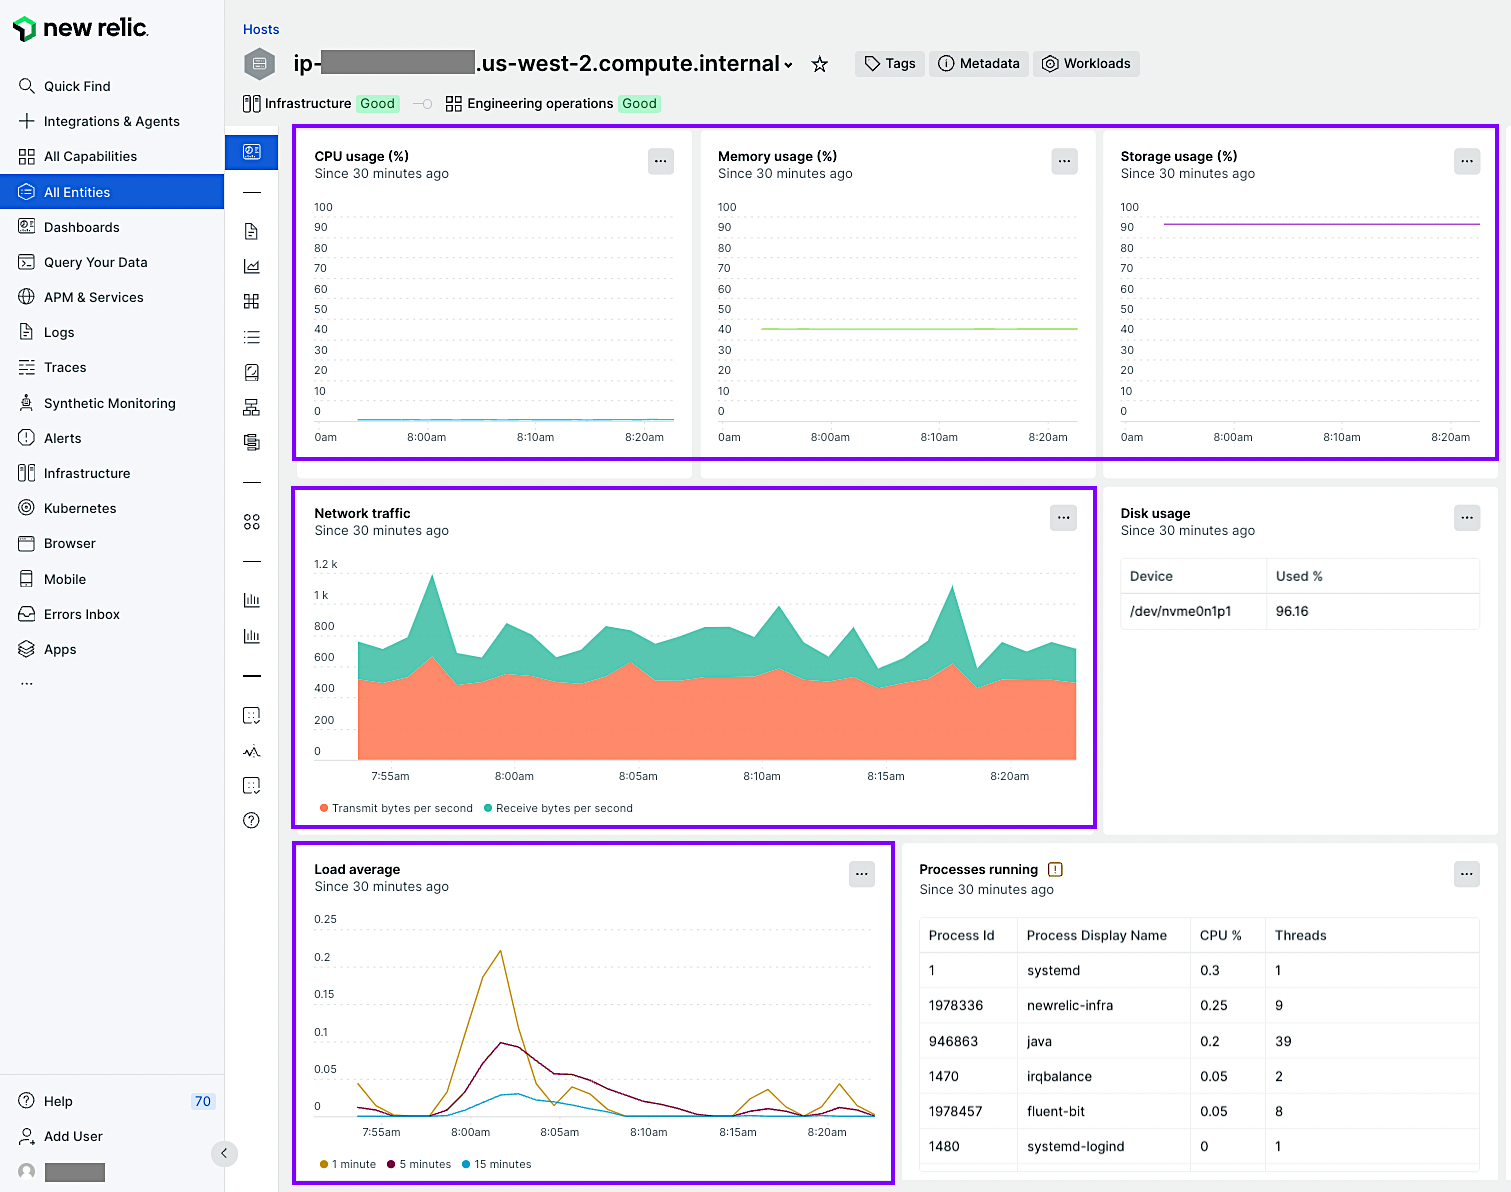
Figure 5: New Relic dashboard for monitoring Amazon EC2 instances [Optimizing cloud costs with observability: A practical guide to performance monitoring]
As shown in Figure 5, the New Relic dashboard helps you understand infrastructure performance in the staging environment.
While this helps you gain visibility into individual infrastructure components, you can get a high-level performance visibility of the entire application by monitoring four key signals: 1) latency, 2) traffic, 3) errors, and 4) saturation. As shown in Figure 6, New Relic provides a Golden Signals dashboard QuickStart [2] that allows you to monitor these signals at the API level.
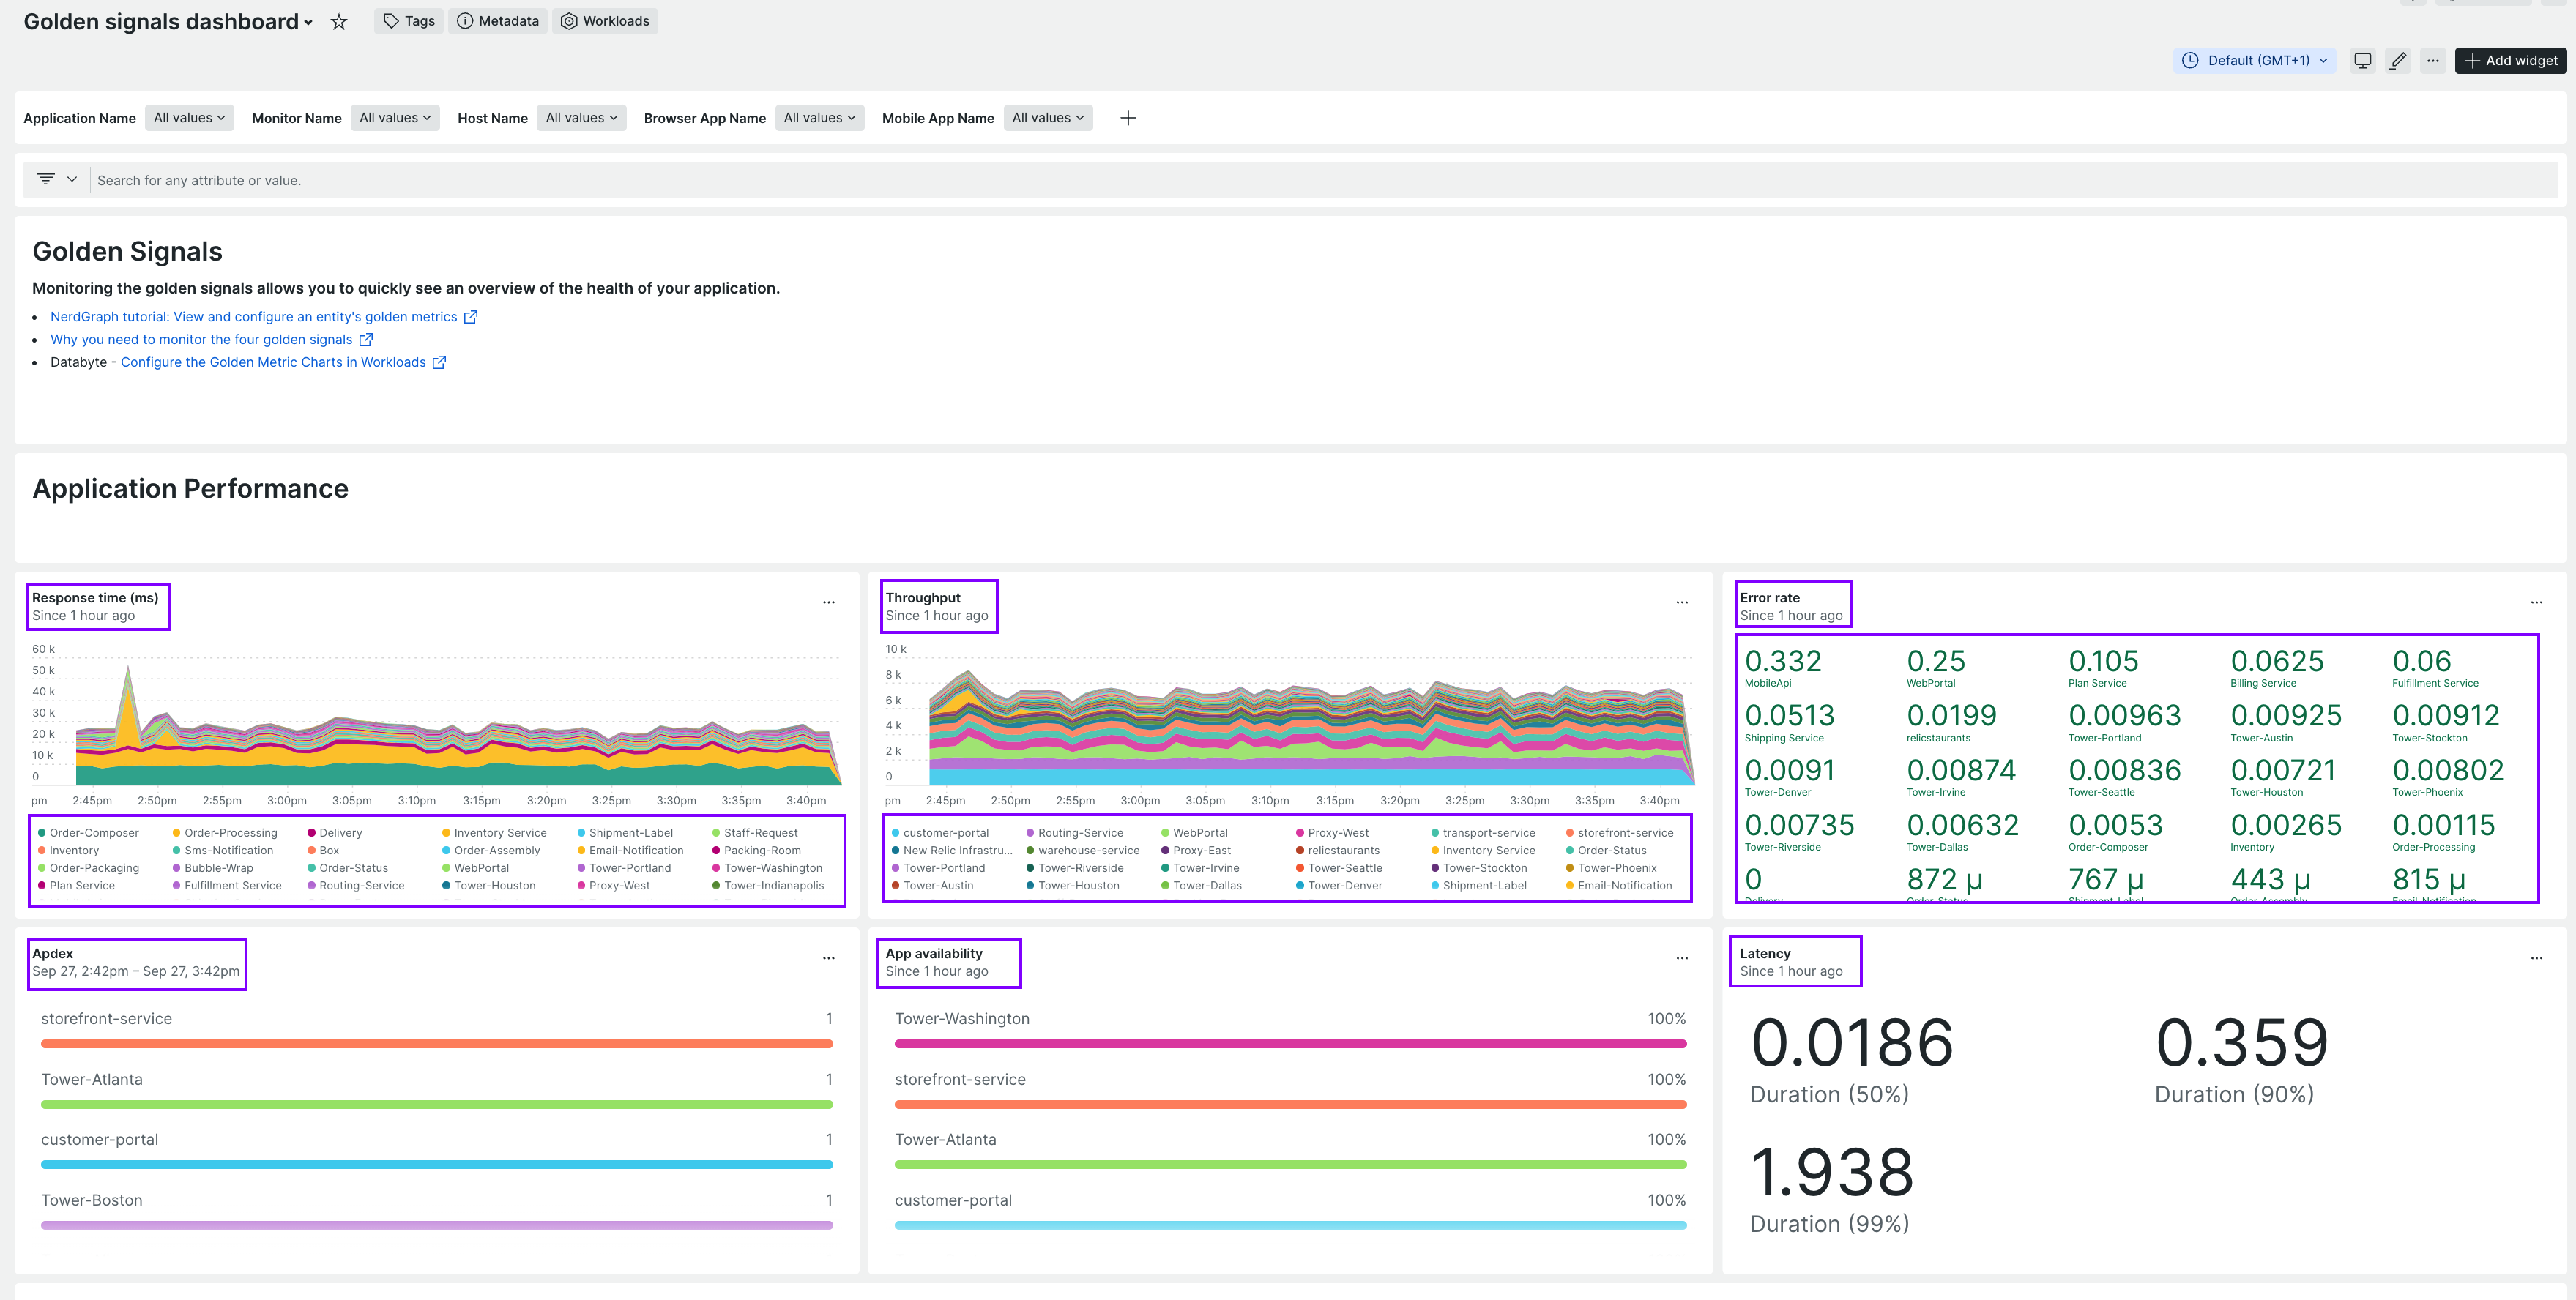
Figure 6: New Relic’s golden signal monitoring dashboard
By monitoring golden signals in your staging environment, especially during the release phase, you gain a rough estimate of how your individual microservices will perform in production.
To better understand whether these services are performing better or worse since deployment, you can use change tracking. Change tracking lets you set a marker to compare your application’s current performance with the previous deployment. Once you’ve tracked a deployment, New Relic’s application performance monitoring dashboards display change markers.
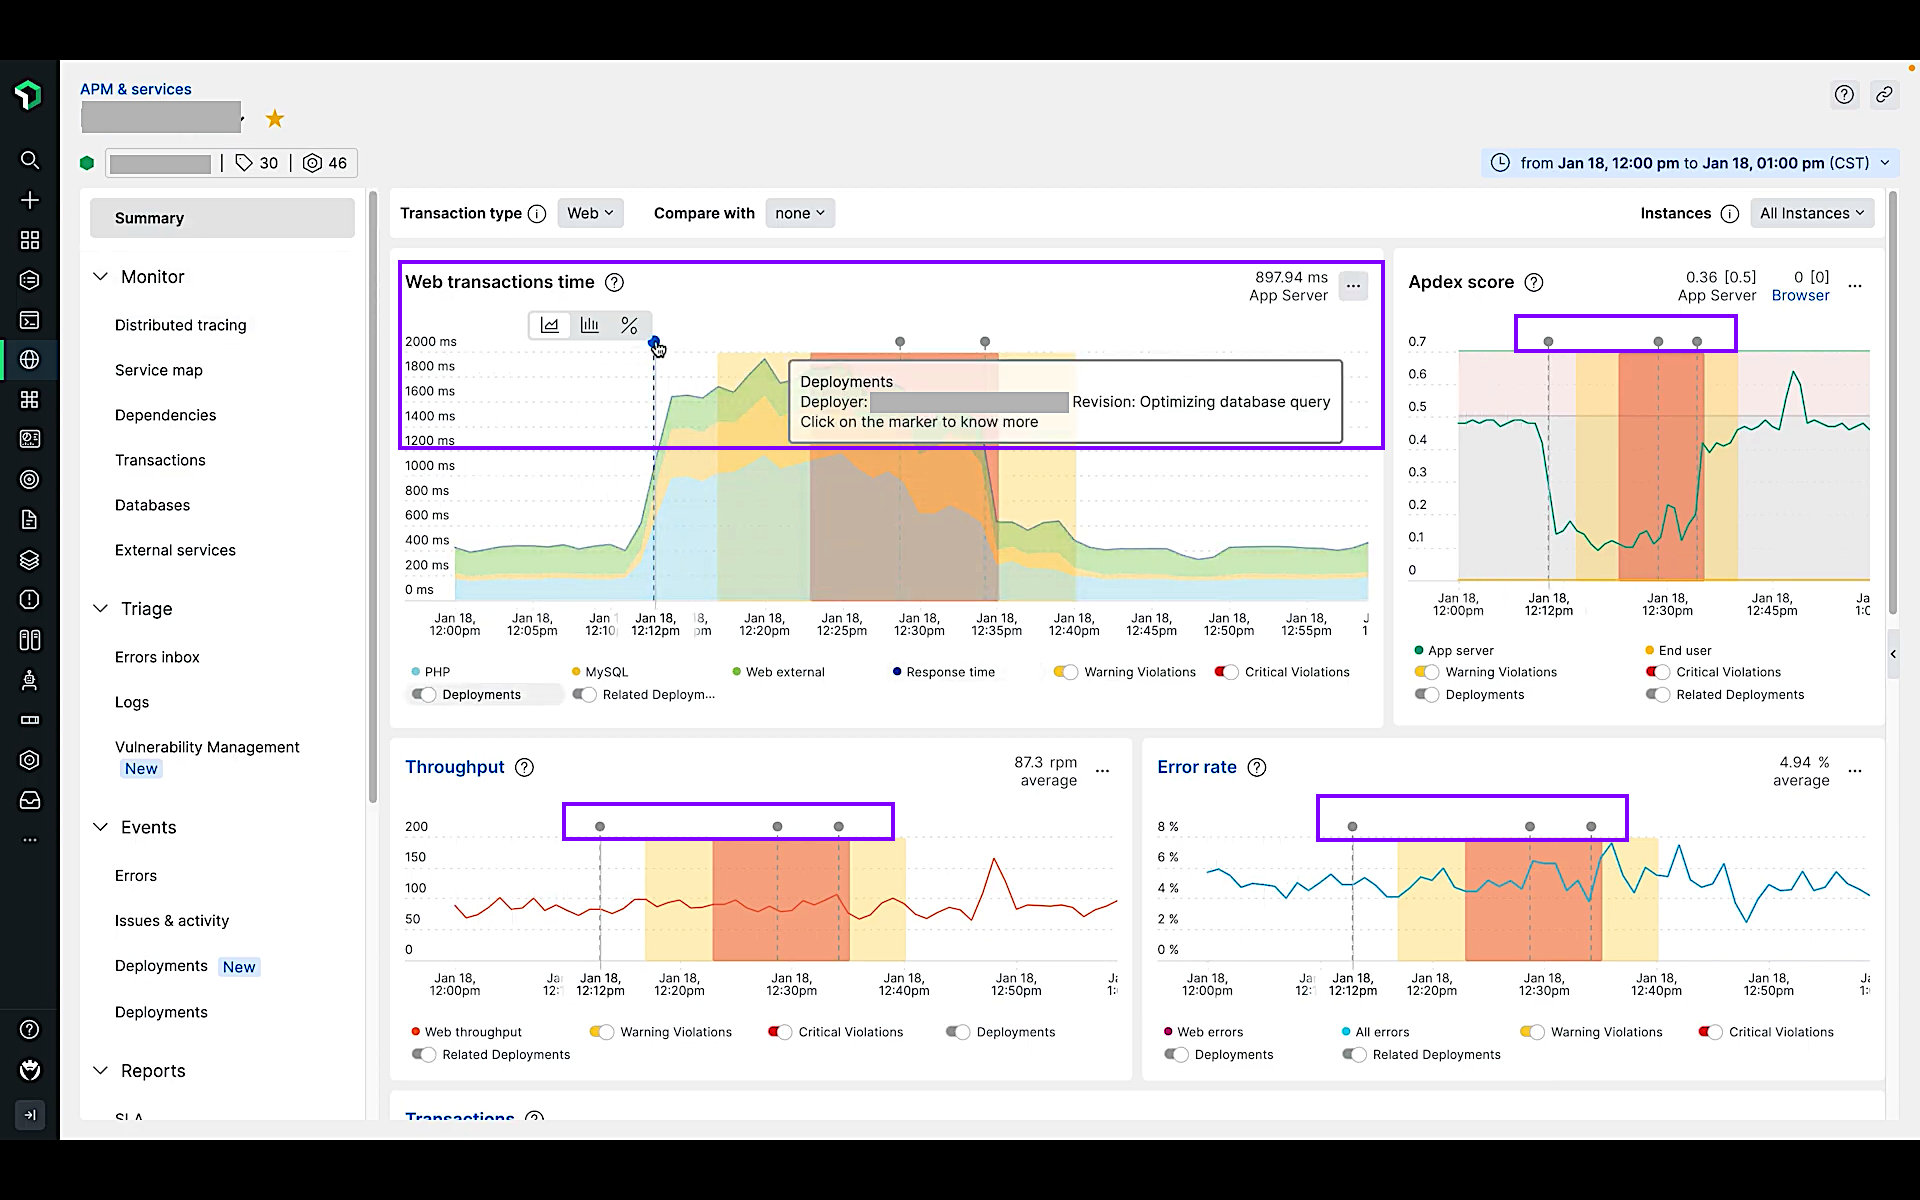
Figure 7: New Relic dashboard displaying metrics like web transaction time, error rate, and throughput [Change tracking]
As shown in the Figure 7 dashboard, near the first change marker, a faulty release involving a database query optimization caused higher latency, increased error rates, and a lower application performance index (Apdex) score. The second marker indicates a faulty hotfix, while the third marker corresponds to a rollback that ultimately stabilized application performance. By including change markers in your continuous integration/continuous deployment (CI/CD) pipeline, you can quickly understand the impact of your deployment.
By using the Golden Signals dashboard and change tracking together, you can review whether the application performance is stable. This approach helps ensure performance stability during the release process.
Key takeaways
This article explained how implementing an AI-augmented approach while keeping humans in the loop can help you address the following use cases efficiently:
- Automatically build a detailed deployment plan for team to review.
- Ensure the application’s performance does not degrade.
- Combine third-party software solutions from AWS Marketplace with your AWS-native tooling to achieve efficiency in the release stage.
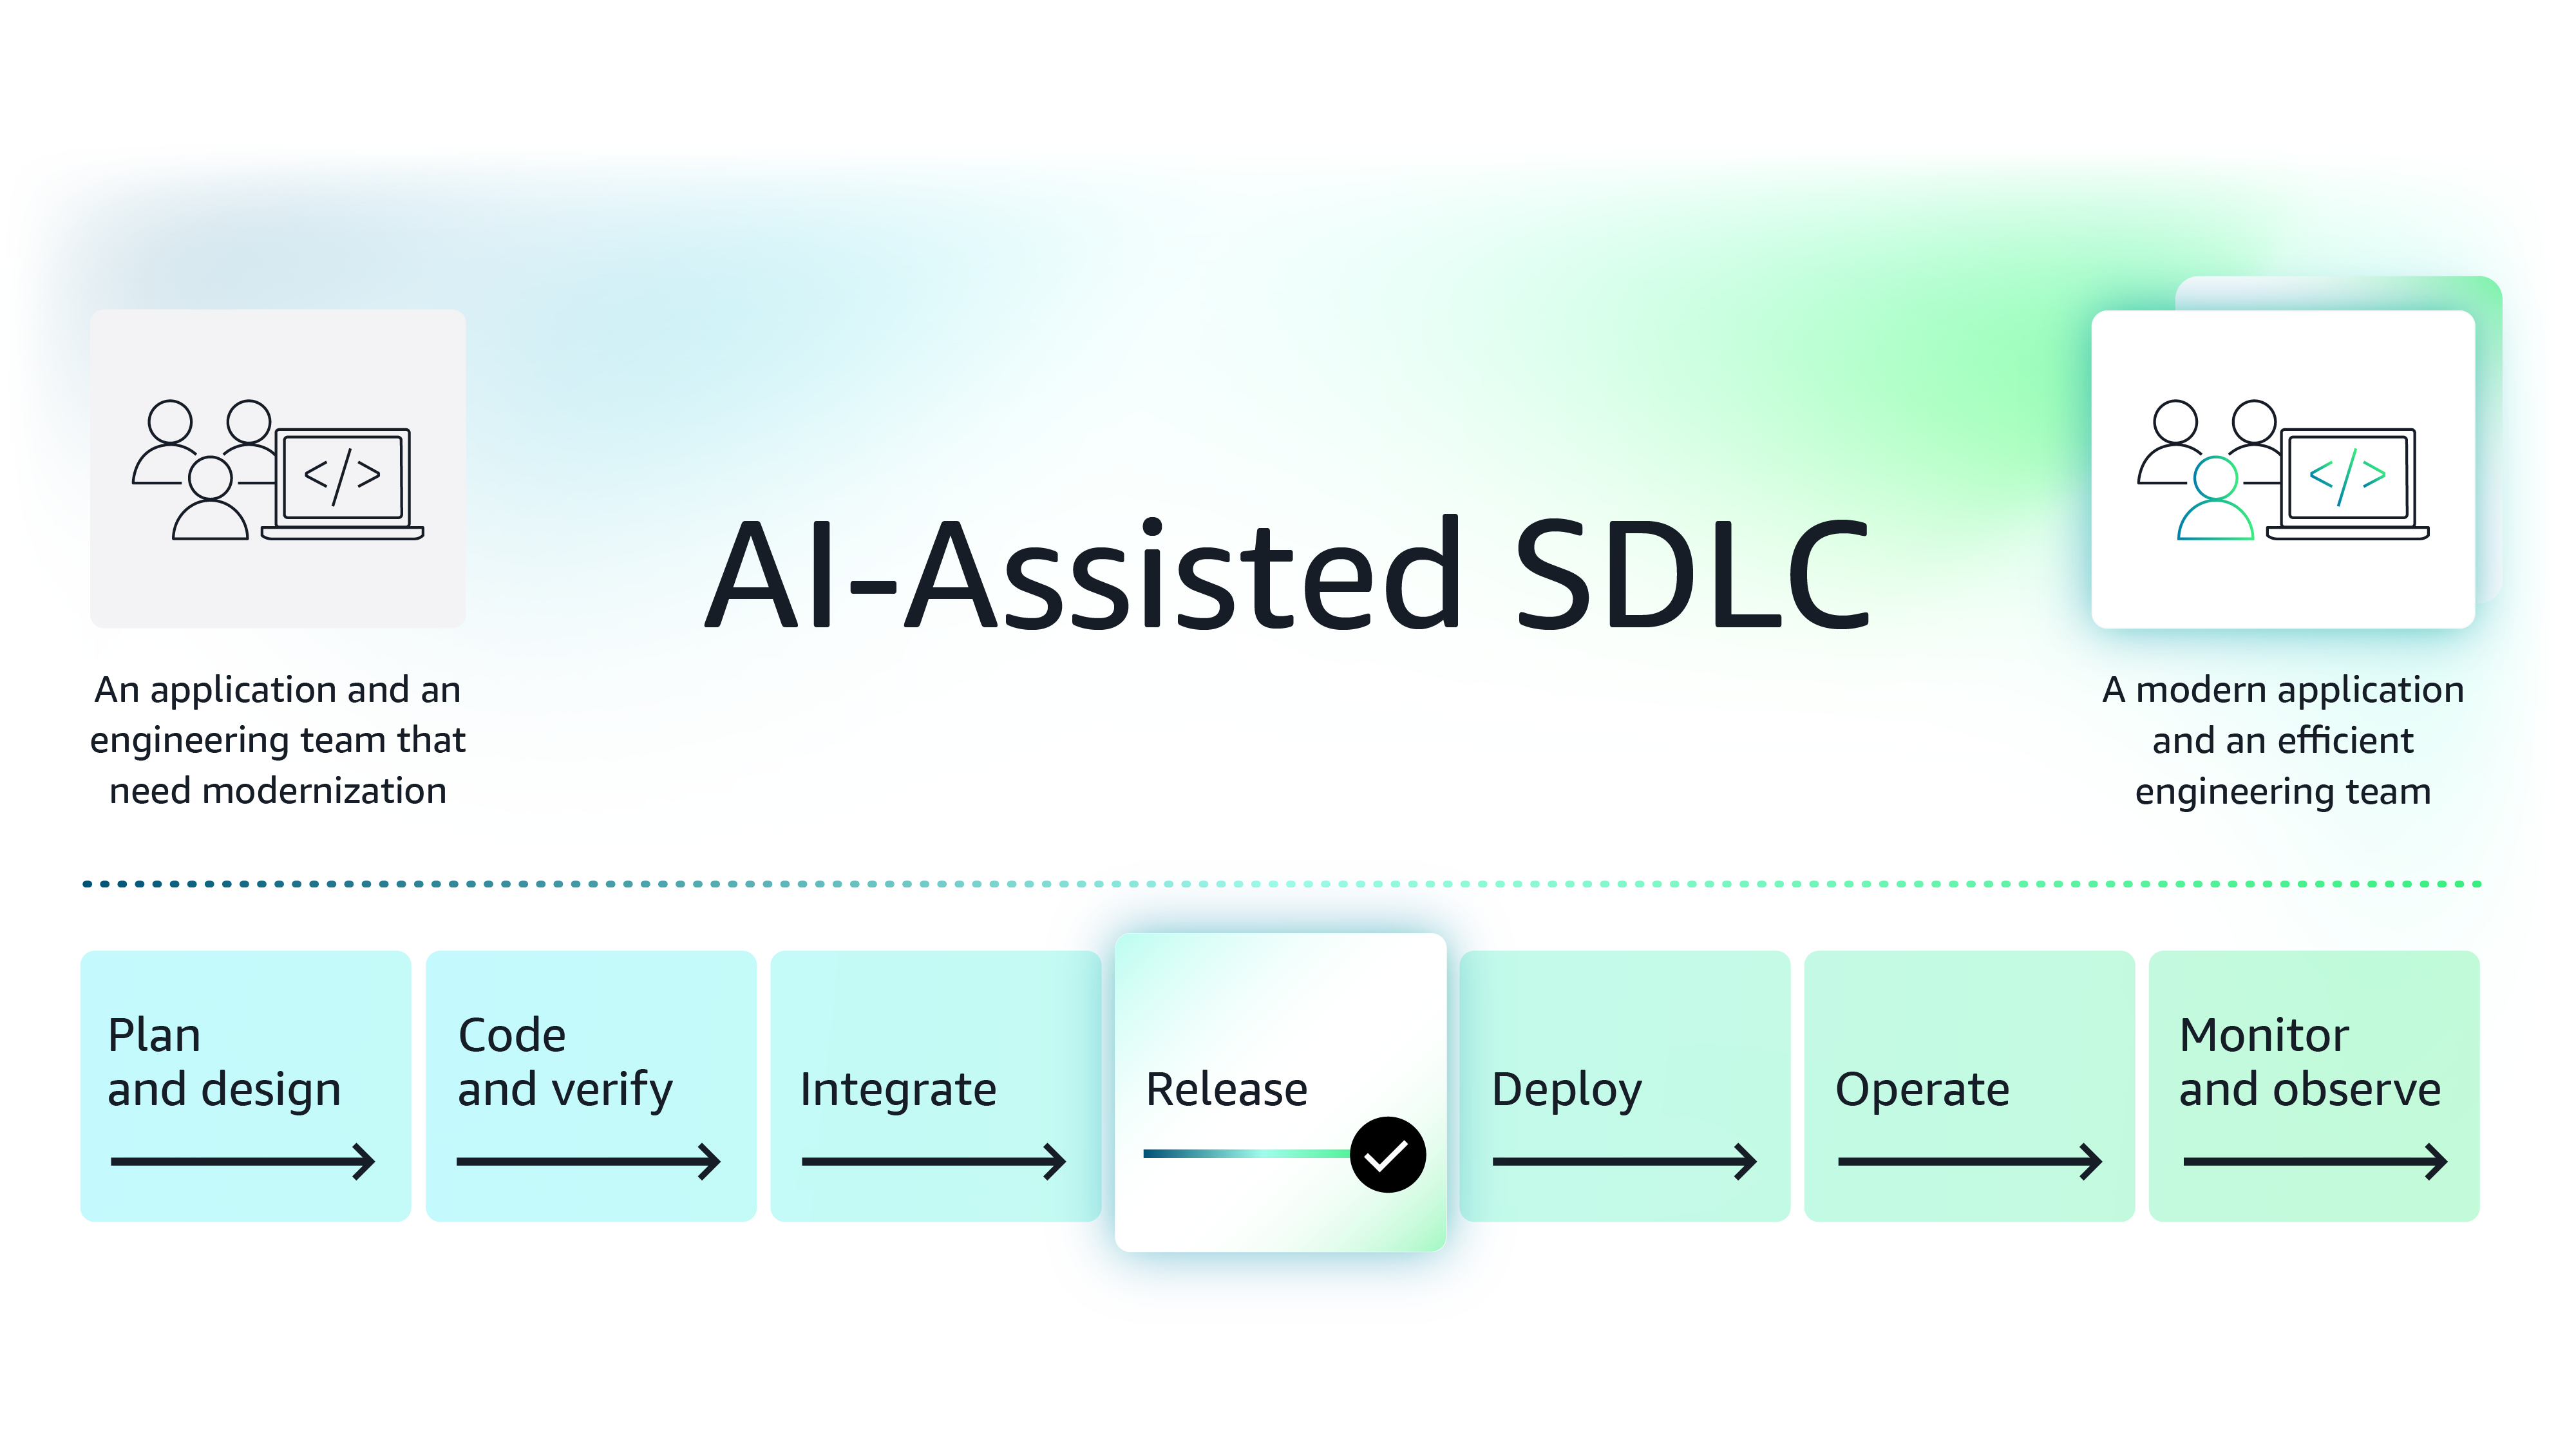
Figure 8: Improve release phase of the software development lifecycle using modern AI-based tools
Next steps
While this article introduces three solutions, AWS Marketplace is a curated digital storefront, comprised of Agentic and Generative AI third-party software that can help you make the release stage more efficient. Organizations looking for ways to boost efficiency by integrating AI into various aspects of their SDLC, can explore these tools further, conduct POCs, and then procure the software in AWS Marketplace.
Note on procuring third-party software for your team - Procuring third-party software is made easier in AWS Marketplace because enterprise organizations save procurement time and costs using standard contracts, flexible pricing models, custom pricing and term negotiations with vendors and consulting partners, and consolidated license and spend management.
See how modern functionalities and AI-based features provided by independent software vendors (ISVs) help you improve application deployment phase of SDLC.
Featured tools
Explore the series
Why AWS Marketplace for on-demand cloud tools
Free to try. Deploy in minutes. Pay only for what you use.
Featured tools are designed to plug in to your AWS workflows and integrate with your favorite AWS services.
Subscribe through your AWS account with no upfront commitments, contracts, or approvals.
Try before you commit. Most tools include free trials or developer-tier pricing to support fast prototyping.
Only pay for what you use. Costs are consolidated with AWS billing for simplified payments, cost monitoring, and governance.
A broad selection of tools across observability, security, AI, data, and more can enhance how you build with AWS.