import boto3
import json
import logging
from datetime import datetime

def lambda_handler(event, context):

    settings = Settings()

    #Set region
    region = 'us-east-1'
    if settings.region:
        region = settings.region

    #Init Clients
    ddbClient = boto3.client('dynamodb', region_name=ddbRegion)
    cloudWatchClient = boto3.client('cloudwatch', region_name=region)

    #New account object
    account = Account()

    #Get account limits
    account_limits(dynamoDBClient, account)

    #Get details for all tables in account
    account_tables(dynamoDBClient, cloudWatchClient, account, settings)

    #Analyse account object, print report and generate number of warnings
    warnings = generateReport(account, settings)

    #Add warnings as custom cloud watch metric if enabled in settings
    if(settings.addCustomMetric == 1):
        addWarningAsCustomCloudWatchMetric(cloudWatchClient, settings, warnings)

    #Print warning count
    message = str(warnings) + ' warning(s) found.View Log output below or go to CloudWatch log group to see detailed report.'

    return message

##############################################
#Add warning count as custom cloud watch metric
def addWarningAsCustomCloudWatchMetric(cloudWatchClient, settings, warnings):
    #Add custom metric to CloudWatch if enabled in settings
    cloudWatchClient.put_metric_data(
    Namespace=settings.customMetricNamespace,
    MetricData=[
        {
            'MetricName': settings.customMetricName,
            'Value': warnings,
            },
            ]
        )

##############################################
# Analyse account and generate report
def generateReport(account, settings):
    warnings = 0

    print('DynamoDB analysis report...')
    #Print Limits and Provisioned Capacity
    print('- TableMaxReadCapacityUnits=%s,\t TableMaxWriteCapacityUnits=%s' % (account.tableRcuLimit , account.tableRcuLimit))
    print('- AccountMaxReadCapacityUnits=%s,\t AccountMaxWriteCapacityUnits=%s' % (account.accountRcuLimit, account.accountWcuLimit))
    print('- ProvisionedRcu=%s,\t ProvisionedWcu=%s' % (account.provisionedRcu, account.provisionedWcu))

    #Warn on RCU account limit alert
    if(account.provisionedRcu >= (settings.accountLimitAlertLevel/100.0)*account.accountRcuLimit):
        print('\tRCU Limit Alert! Current provisioned RCU (%s) is %s %% of current account limit of %s.You have set warning threshold to %s%%.' % \
        (account.provisionedRcu, (100.0*account.provisionedRcu/account.accountRcuLimit), account.accountRcuLimit, settings.accountLimitAlertLevel))
        warnings += 1

    #Warn on WCU account limit alert
    if(account.provisionedWcu >= (settings.accountLimitAlertLevel/100.0)*account.accountWcuLimit):
        print('\tWCU Limit Alert! Current provisioned WCU (%s) is %s %% of current account limit of %s.You have set warning threshold to %s%%.' % \
        (account.provisionedWcu, (100.0*account.provisionedWcu/account.accountWcuLimit), account.accountWcuLimit, settings.accountLimitAlertLevel))
        warnings += 1

    for table in account.tables:
        print('- Table=%s, Rcu=%s, Wcu=%s' % (table.name, table.rcu, table.wcu))

        #Table RCU Warnings
        if(table.totalRcu >= (settings.accountLimitAlertLevel/100.0)*account.tableRcuLimit):
            print('\tRCU Limit Alert! Current provisioned RCU (%s) of table is %s %% of current table-max account limit of %s.You set warning threshold to %s%%.' % \
            (table.totalRcu, (100.0*table.totalRcu/account.tableRcuLimit), account.tableRcuLimit, settings.accountLimitAlertLevel))
            warnings += 1

        #Table WCU Warnings
        if(table.totalWcu >= (settings.accountLimitAlertLevel/100.0)*account.tableWcuLimit):
            print('\tWCU Limit Alert! Current provisioned WCU (%s) of table is %s %% of current table-max account limit of %s.You set warning threshold to %s%%.' % \
            (table.totalWcu, (100.0*table.totalWcu/account.tableWcuLimit), account.tableWcuLimit, settings.accountLimitAlertLevel))
            warnings += 1

        #GSI Warnings
        for gsi in table.gsi:
            if(gsi.gsiWarning == 1):
                print('\tGSI Warning! GSI %s has Wcu=%s while table has Wcu=%s.If there is not enough Wcu provisioned for GSI it can throttle table.' % \
                (gsi.name, gsi.wcu, table.wcu))
                warnings += 1

        #CloudWatch Alarm Warnings
        for cwm in table.cloudWatchMetrics:
            if(len(cwm.cloudWatchAlarms) == 0):
                print('\tCloudWatch Warning! %s has no CloudWatch Alarms configured.' % cwm.name)
                warnings += 1
            else:
                for cwa in cwm.cloudWatchAlarms:
                    if(cwa.hasActionsEnabled == 0):
                        print('\tCloudWatch Warning! alarm %s for metric %s has no action configured.' % (cwa.name, cwm.name))
                        warnings += 1

    return warnings

##############################################
#Get limits
def account_limits(client, account):
    response = client.describe_limits()
    account.tableRcuLimit = response.get('TableMaxReadCapacityUnits')
    account.tableWcuLimit  = response.get('TableMaxWriteCapacityUnits')
    account.accountRcuLimit = response.get('AccountMaxReadCapacityUnits')
    account.accountWcuLimit = response.get('AccountMaxWriteCapacityUnits')

##############################################
#Get tables
def account_tables(client, cloudWatchClient, account, settings):
    response = client.list_tables()
    tables = response.get('TableNames')

    for table in tables:
        odt = DynamoDBTable()
        analyse_table(client, cloudWatchClient, table, odt, settings)

        account.provisionedRcu += odt.totalRcu
        account.provisionedWcu += odt.totalWcu

        account.tables.append(odt)

##############################################
#Analyse tables and nested objects of each table
def analyse_table(client, cloudWatchClient, tableName, table, settings):
    response = client.describe_table(TableName=tableName)
    json.dumps(response, default=date_handler)
    table.name = tableName
    table.totalRcu = table.rcu = response['Table']['ProvisionedThroughput']['ReadCapacityUnits']
    table.totalWcu = table.wcu = response['Table']['ProvisionedThroughput']['WriteCapacityUnits']
    if('GlobalSecondaryIndexes' in response['Table']):
        gsis = response['Table']['GlobalSecondaryIndexes']
        for gsi in gsis:
            ogsi = DynamoDBGsi()
            ogsi.name = gsi['IndexName']
            ogsi.rcu = gsi['ProvisionedThroughput']['ReadCapacityUnits']
            ogsi.wcu = gsi['ProvisionedThroughput']['WriteCapacityUnits']
            table.totalRcu += ogsi.rcu
            table.totalWcu += ogsi.wcu
            if(ogsi.wcu != table.wcu and ogsi.wcu < ((settings.gsiThroughputAlertLevel/100.0)*table.wcu)):
                ogsi.gsiWarning = 1
                ogsi.gsiWarningDiff = table.wcu - ogsi.wcu
                table.gsiWarning = 1
            table.gsi.append(ogsi)

    checkCloudWatchAlarmsForTable(table, cloudWatchClient)

##############################################
#Check CloudWatchAlarms for Table
def checkCloudWatchAlarmsForTable(table, cloudWatchClient):
    checkCloudWatchAlarmForMetric(cloudWatchClient, table, 'ConsumedReadCapacityUnits')
    checkCloudWatchAlarmForMetric(cloudWatchClient, table, 'ConsumedWriteCapacityUnits')
    checkCloudWatchAlarmForMetric(cloudWatchClient, table, 'ReadThrottleEvents')
    checkCloudWatchAlarmForMetric(cloudWatchClient, table, 'WriteThrottleEvents')
    checkCloudWatchAlarmForMetric(cloudWatchClient, table, 'ThrottledRequests')

#Check CloudWatchAlarms for each metric
def checkCloudWatchAlarmForMetric(client, table, metricName):
    response = client.describe_alarms_for_metric(
    Namespace='AWS/DynamoDB',
    MetricName = metricName,
    Dimensions=[
        {
            'Name': 'tablename',
            'Value': table.name
        },
        ]
    )

    cloudWatchMetric = CloudWatchMetric()
    cloudWatchMetric.name = metricName

    metricAlarm = response.get('MetricAlarms')
    metricAlarmCount = len(metricAlarm)

    #Check if each alarm is properly configured
    if(metricAlarmCount > 0) :
        for m in range(0, metricAlarmCount) :
            cwAlarm = CloudWatchAlarm()
            cwAlarm.name = response.get('MetricAlarms')[m].get('AlarmName')
            if(response.get('MetricAlarms')[m].get('ActionsEnabled') == True):
                cwAlarm.hasActionsEnabled = 1
            cloudWatchMetric.cloudWatchAlarms.append(cwAlarm);

    table.cloudWatchMetrics.append(cloudWatchMetric)

##############################################
def date_handler(obj):
    if hasattr(obj, 'isoformat'):
        return obj.isoformat()
    else:
        raise TypeError

############ Class definitions #################

class Account:
    tableRcuLimit = 0
    tableWcuLimit = 0
    accountRcuLimit = 0
    accountWcuLimit = 0
    provisionedRcu = 0
    provisionedWcu = 0

    def __init__(self):
        self.tables = []

class DynamoDBTable:
    name = ''
    rcu = 0
    wcu = 0
    totalRcu = 0
    totalWcu = 0
    gsiWarning = 0

    def __init__(self):
        self.gsi = []
        self.cloudWatchMetrics = []

class CloudWatchMetric:
    name = ''

    def __init__(self):
        self.cloudWatchAlarms = []

class CloudWatchAlarm:
    name = ''
    hasActionsEnabled = 0

class DynamoDBGsi:
    name = ''
    rcu = 0
    wcu = 0
    gsiWarning = 0
    gsiWarningDiff = 0

class Settings:
    #AWS region
    region = 'us-west-2'
    #Generate warning if provisioned throughput is more than x% of account limit
    accountLimitAlertLevel = 50
    #Generate warning GSI has throughput less than x% of the table's throughput
    gsiThroughputAlertLevel = 50
    #Add warnings to CloudWatch as custom metric
    addCustomMetric = 0
    customMetricNamespace = 'kashif'
    customMetricName = 'DynamoDBAuditWarnings'
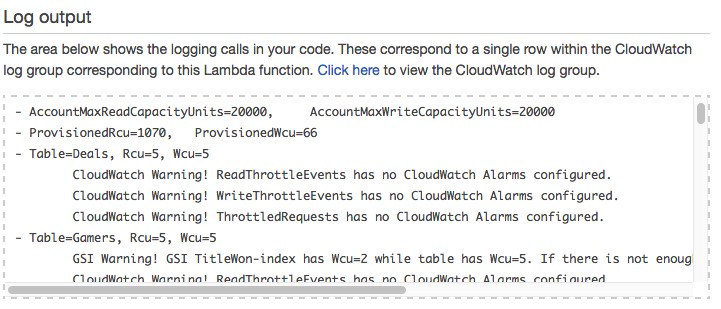 [Log output] で出力内容の詳細を表示できます。大量の警告がある場合、すべての警告が [Log output] に表示されないことがあります。この機能の完全な出力結果を得るには、[Click here] のリンクを選択し、[Log output] の下にある CloudWatch ロググループを表示します。
 Lambda 関数のコードには、警告を生成する AWS リージョンや閾値など、さまざまなパラメータを指定できます。次のコードブロックは、これらのパラメータを提供する方法を示しています。
 Josh Kahn 氏は、Amazon Web Services のソリューションアーキテクトです。同氏は AWS の顧客と協力し技術指導や設計アドバイスを提供しています。また、同氏の専門知識は、アプリケーションアーキテクチャー、サーバーレス、コンテナ、NoSQL 、機械学習にまで多岐にわたります。