Networking & Content Delivery
Scale traffic using multiple Interface Endpoints
Update: As of January 27, 2022, AWS PrivateLink publishes data points to Amazon CloudWatch for your interface endpoints, Gateway Load Balancer endpoints, and endpoint services. CloudWatch enables you to retrieve statistics about those data points as an ordered set of time series data, known as metrics. As a PrivateLink Endpoint owner, you can use metrics to track traffic volume and number of connections through your endpoints, monitor packet drops, and view connection resets (RSTs) by the service.
Introduction:
AWS PrivateLink is a networking service that is used to connect to AWS services, your internal services, and third-party Software as a Service (SaaS) services–all over the private, secure, and scalable AWS network.
AWS PrivateLink has two sides to it:
- Service provider: Responsible for offering the service. The service provider creates an Amazon Virtual Private Cloud (VPC) Endpoint Service (service) using Network Load Balancer (NLB).
- Service consumer: Consumes one or more services offered by service provider. To consume the service, the consumer creates an interface VPC endpoint (endpoint), using the service name provided by the service provider.
Challenge:
Security combined with simplicity has made AWS PrivateLink a go-to mechanism for secure consumption of services. It connects services across different accounts and Amazon VPCs, with no need for firewall rules, path definitions, or route tables. There is no need to configure an internet gateway, VPC peering connection, or manage VPC Classless Inter-Domain Routing (CIDRs).
That said, each interface endpoint currently supports a limited bandwidth for sustained and burst traffic per Availability Zone (AZ) as documented in the AWS PrivateLink quotas documentation. For use cases where you need higher throughput, such as connecting to services like Amazon Kinesis Data Streams, you might require sustained throughput of greater than what is offered per Availability Zone (AZ).
In this blog, I will demonstrate a solution to support higher bandwidth requirements when consuming a service over AWS PrivateLink.
Solution overview:
This solution is based on horizontally scaling interface endpoints by creating multiple endpoints for the same service. It uses Amazon Route 53 – a highly available and scalable cloud Domain Name System (DNS) web service – to distribute the traffic across these multiple endpoints.
High-level workflow:
In the workflow that follows (Figure 1), I am using Kinesis Data Streams as an example service.
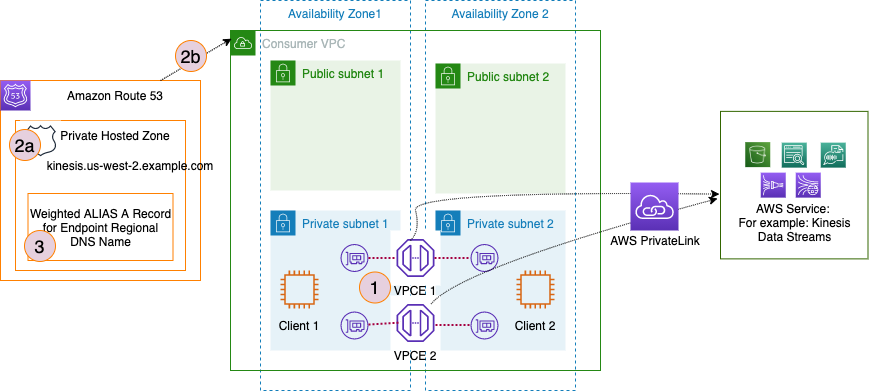
Figure 1: Horizontally Scale Interface VPC Endpoints. This figure depicts the high-level workflow.
- Step 1: For a given service, create two (or more) interface endpoints with their Private DNS attribute (PrivateDnsEnabled) set to false. This is shown in Figure 2.
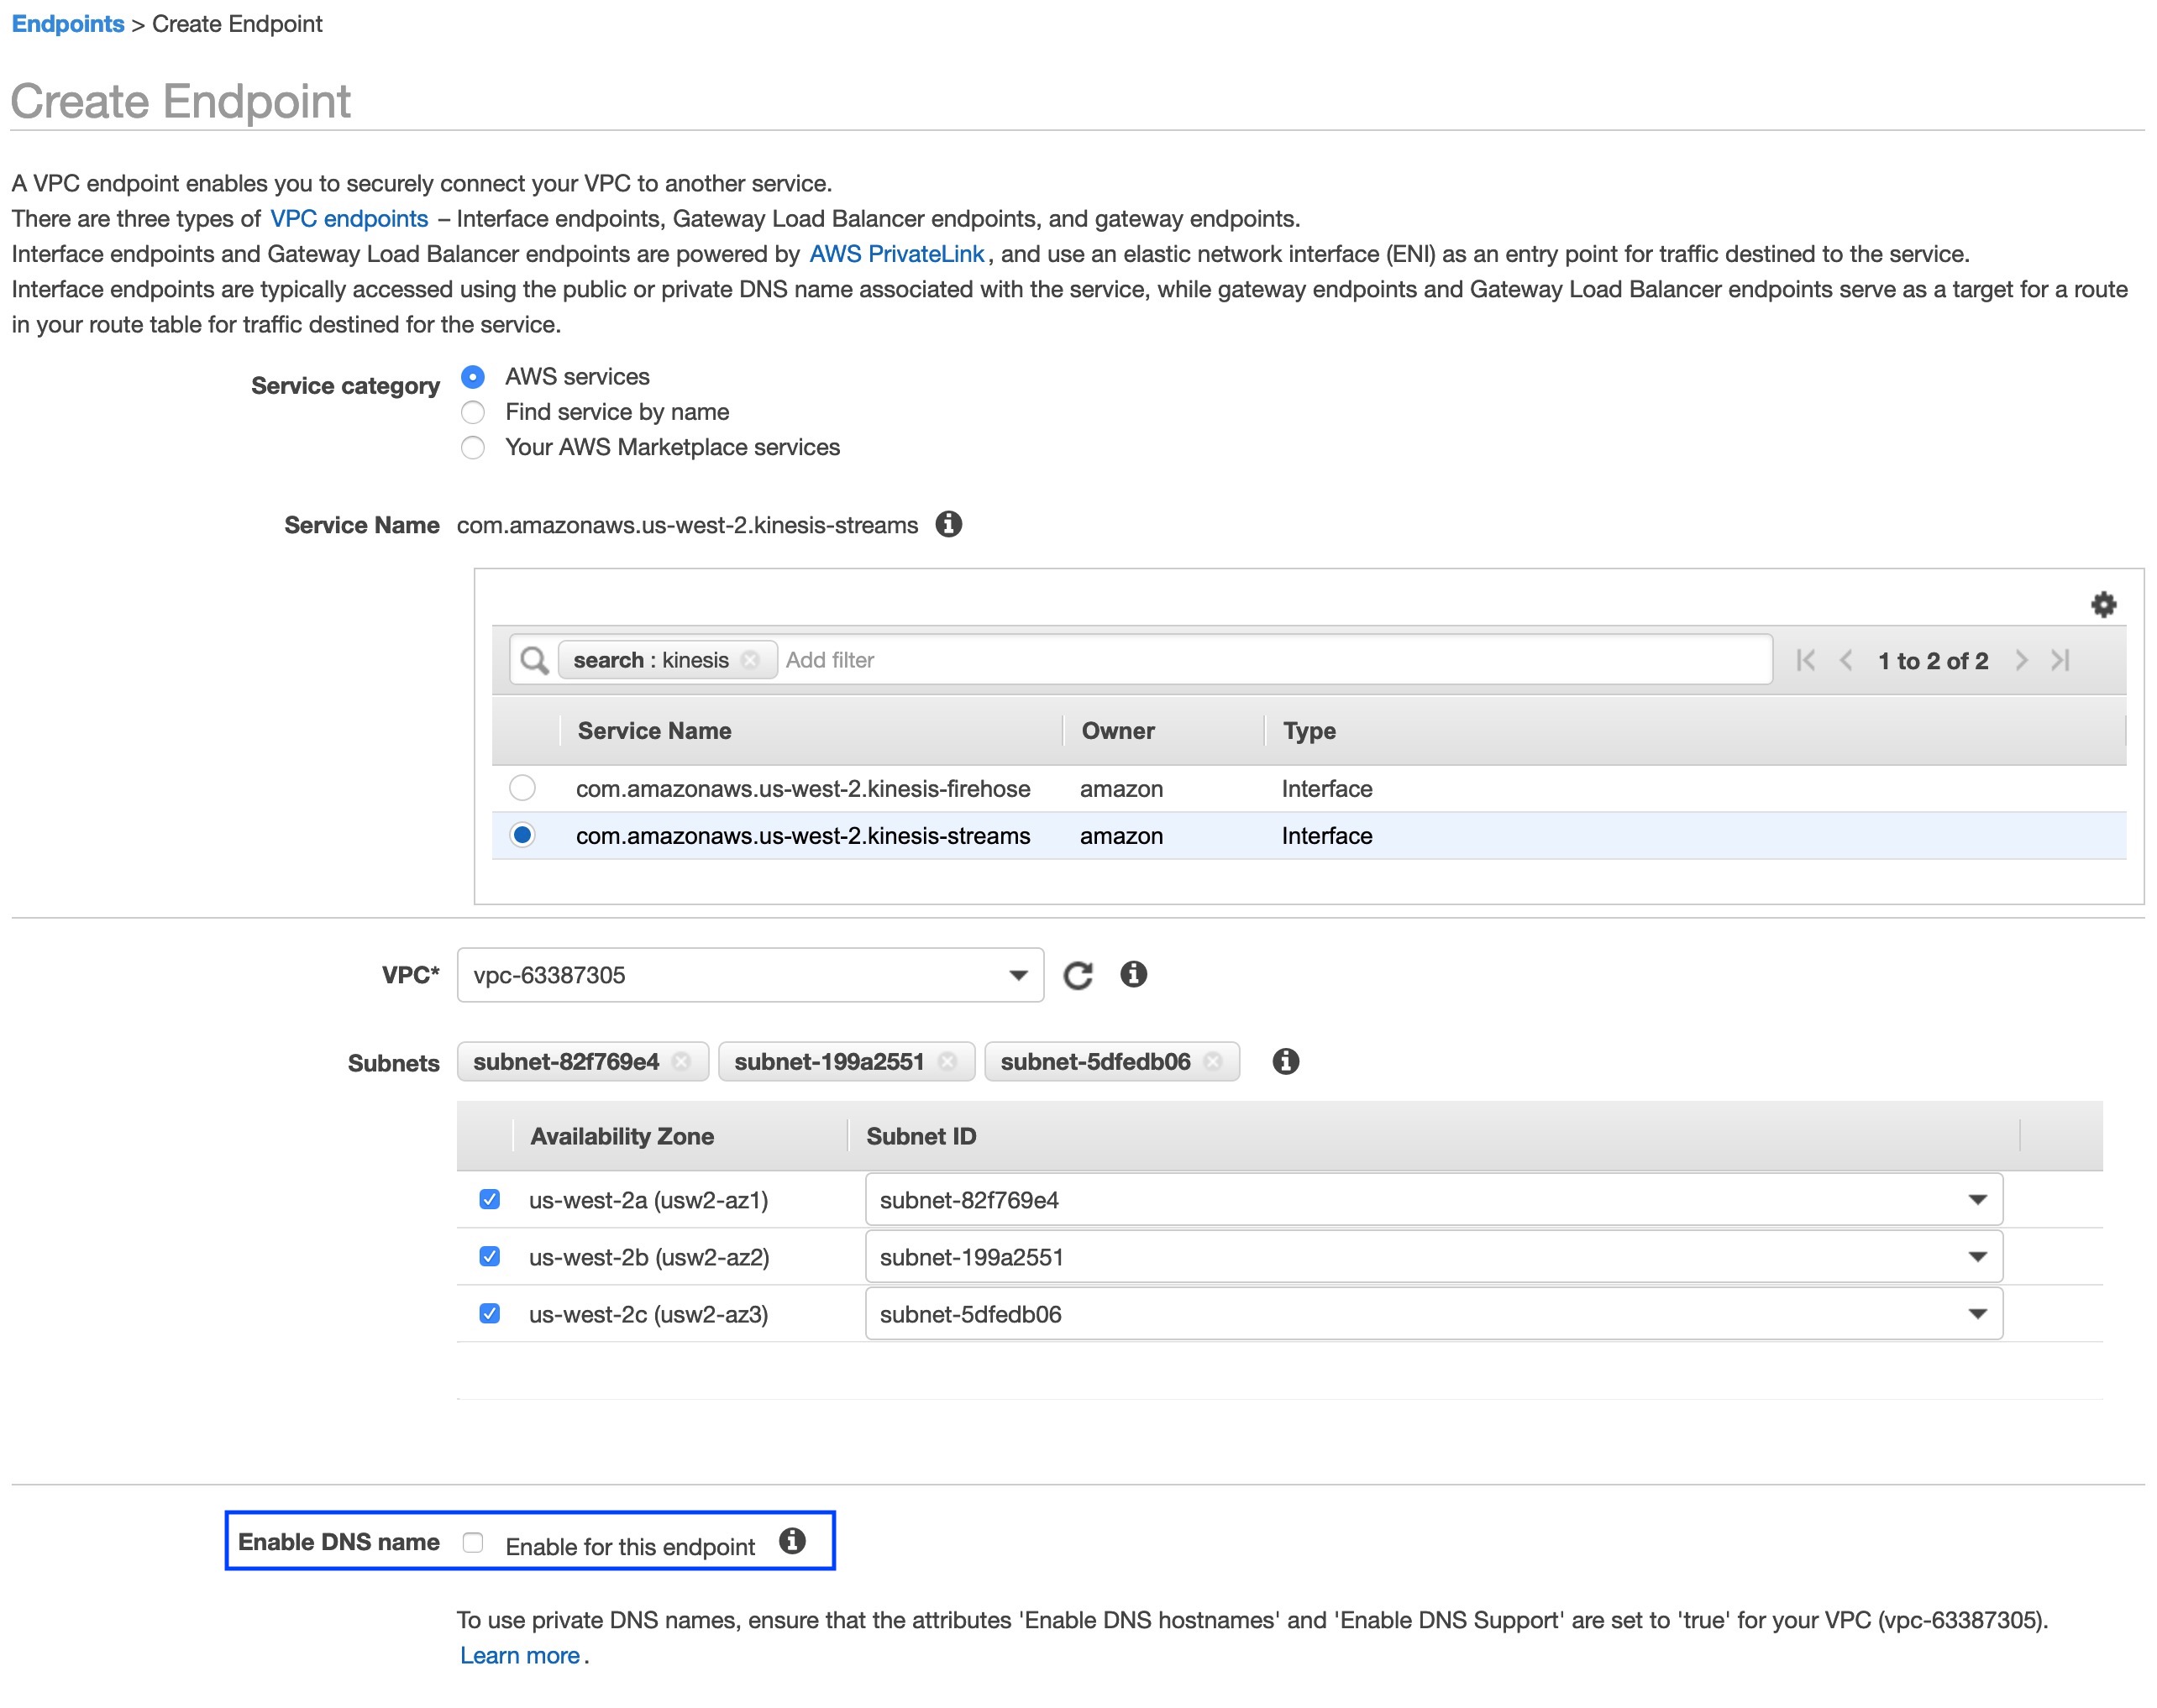
Figure 2: Create Endpoints. This figure shows how to create an interface endpoint
- Step 2: (2a) – Create a Private Hosted Zone (PHZ). For example: kinesis.us-west-2.amazonaws.com
- Step2: (2b) – associate PHZ with the Consumer VPC.
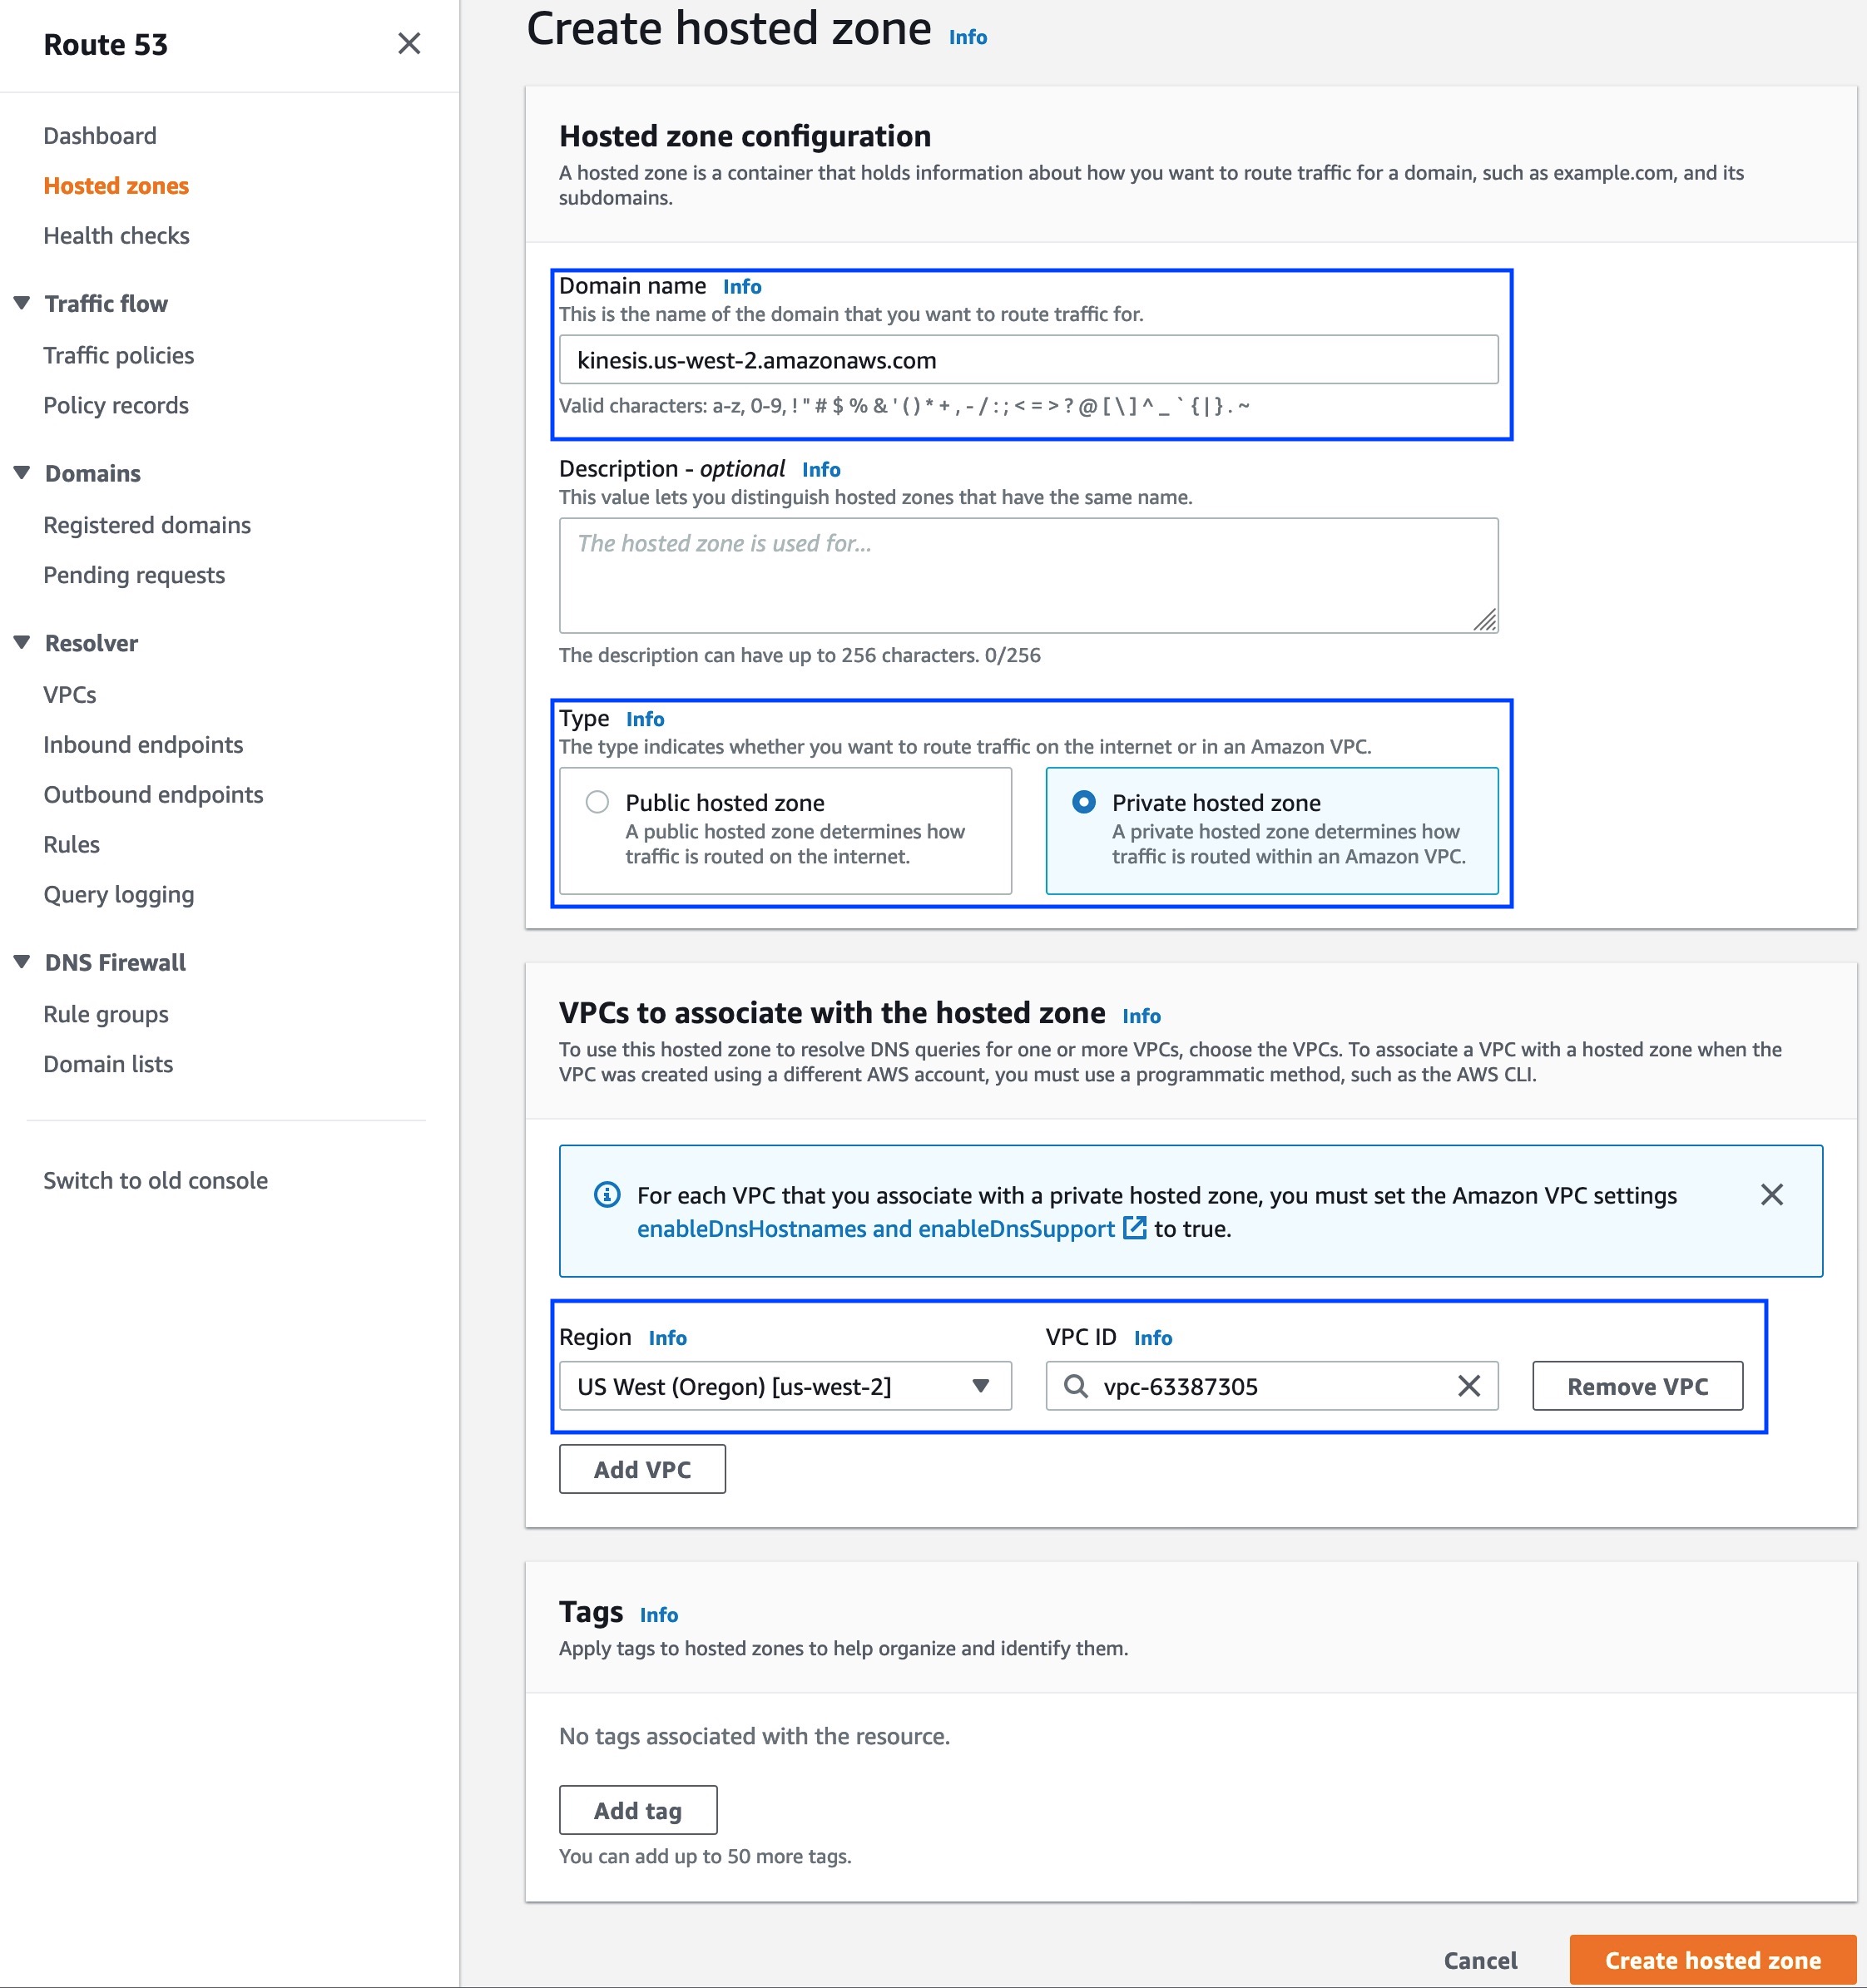
Figure 3: Create Private Hosted Zone. This figure shows how to create a Route 53 private hosted zone.
- Step 3: For the PHZ created in Step 2, create weighted ALIAS A records pointing to Regional DNS names of the interface endpoints created in Step 1.
An example, shown in Figure 4: Create Weighted ALIAS A Records, I created two ‘alias to VPC endpoint records’ such that traffic is distributed equally across these two records. This allows you to distribute traffic across two interface endpoints and in turn achieve desired sustained throughput.
Note: Make sure that Evaluate target health is enabled (toggled to Yes).
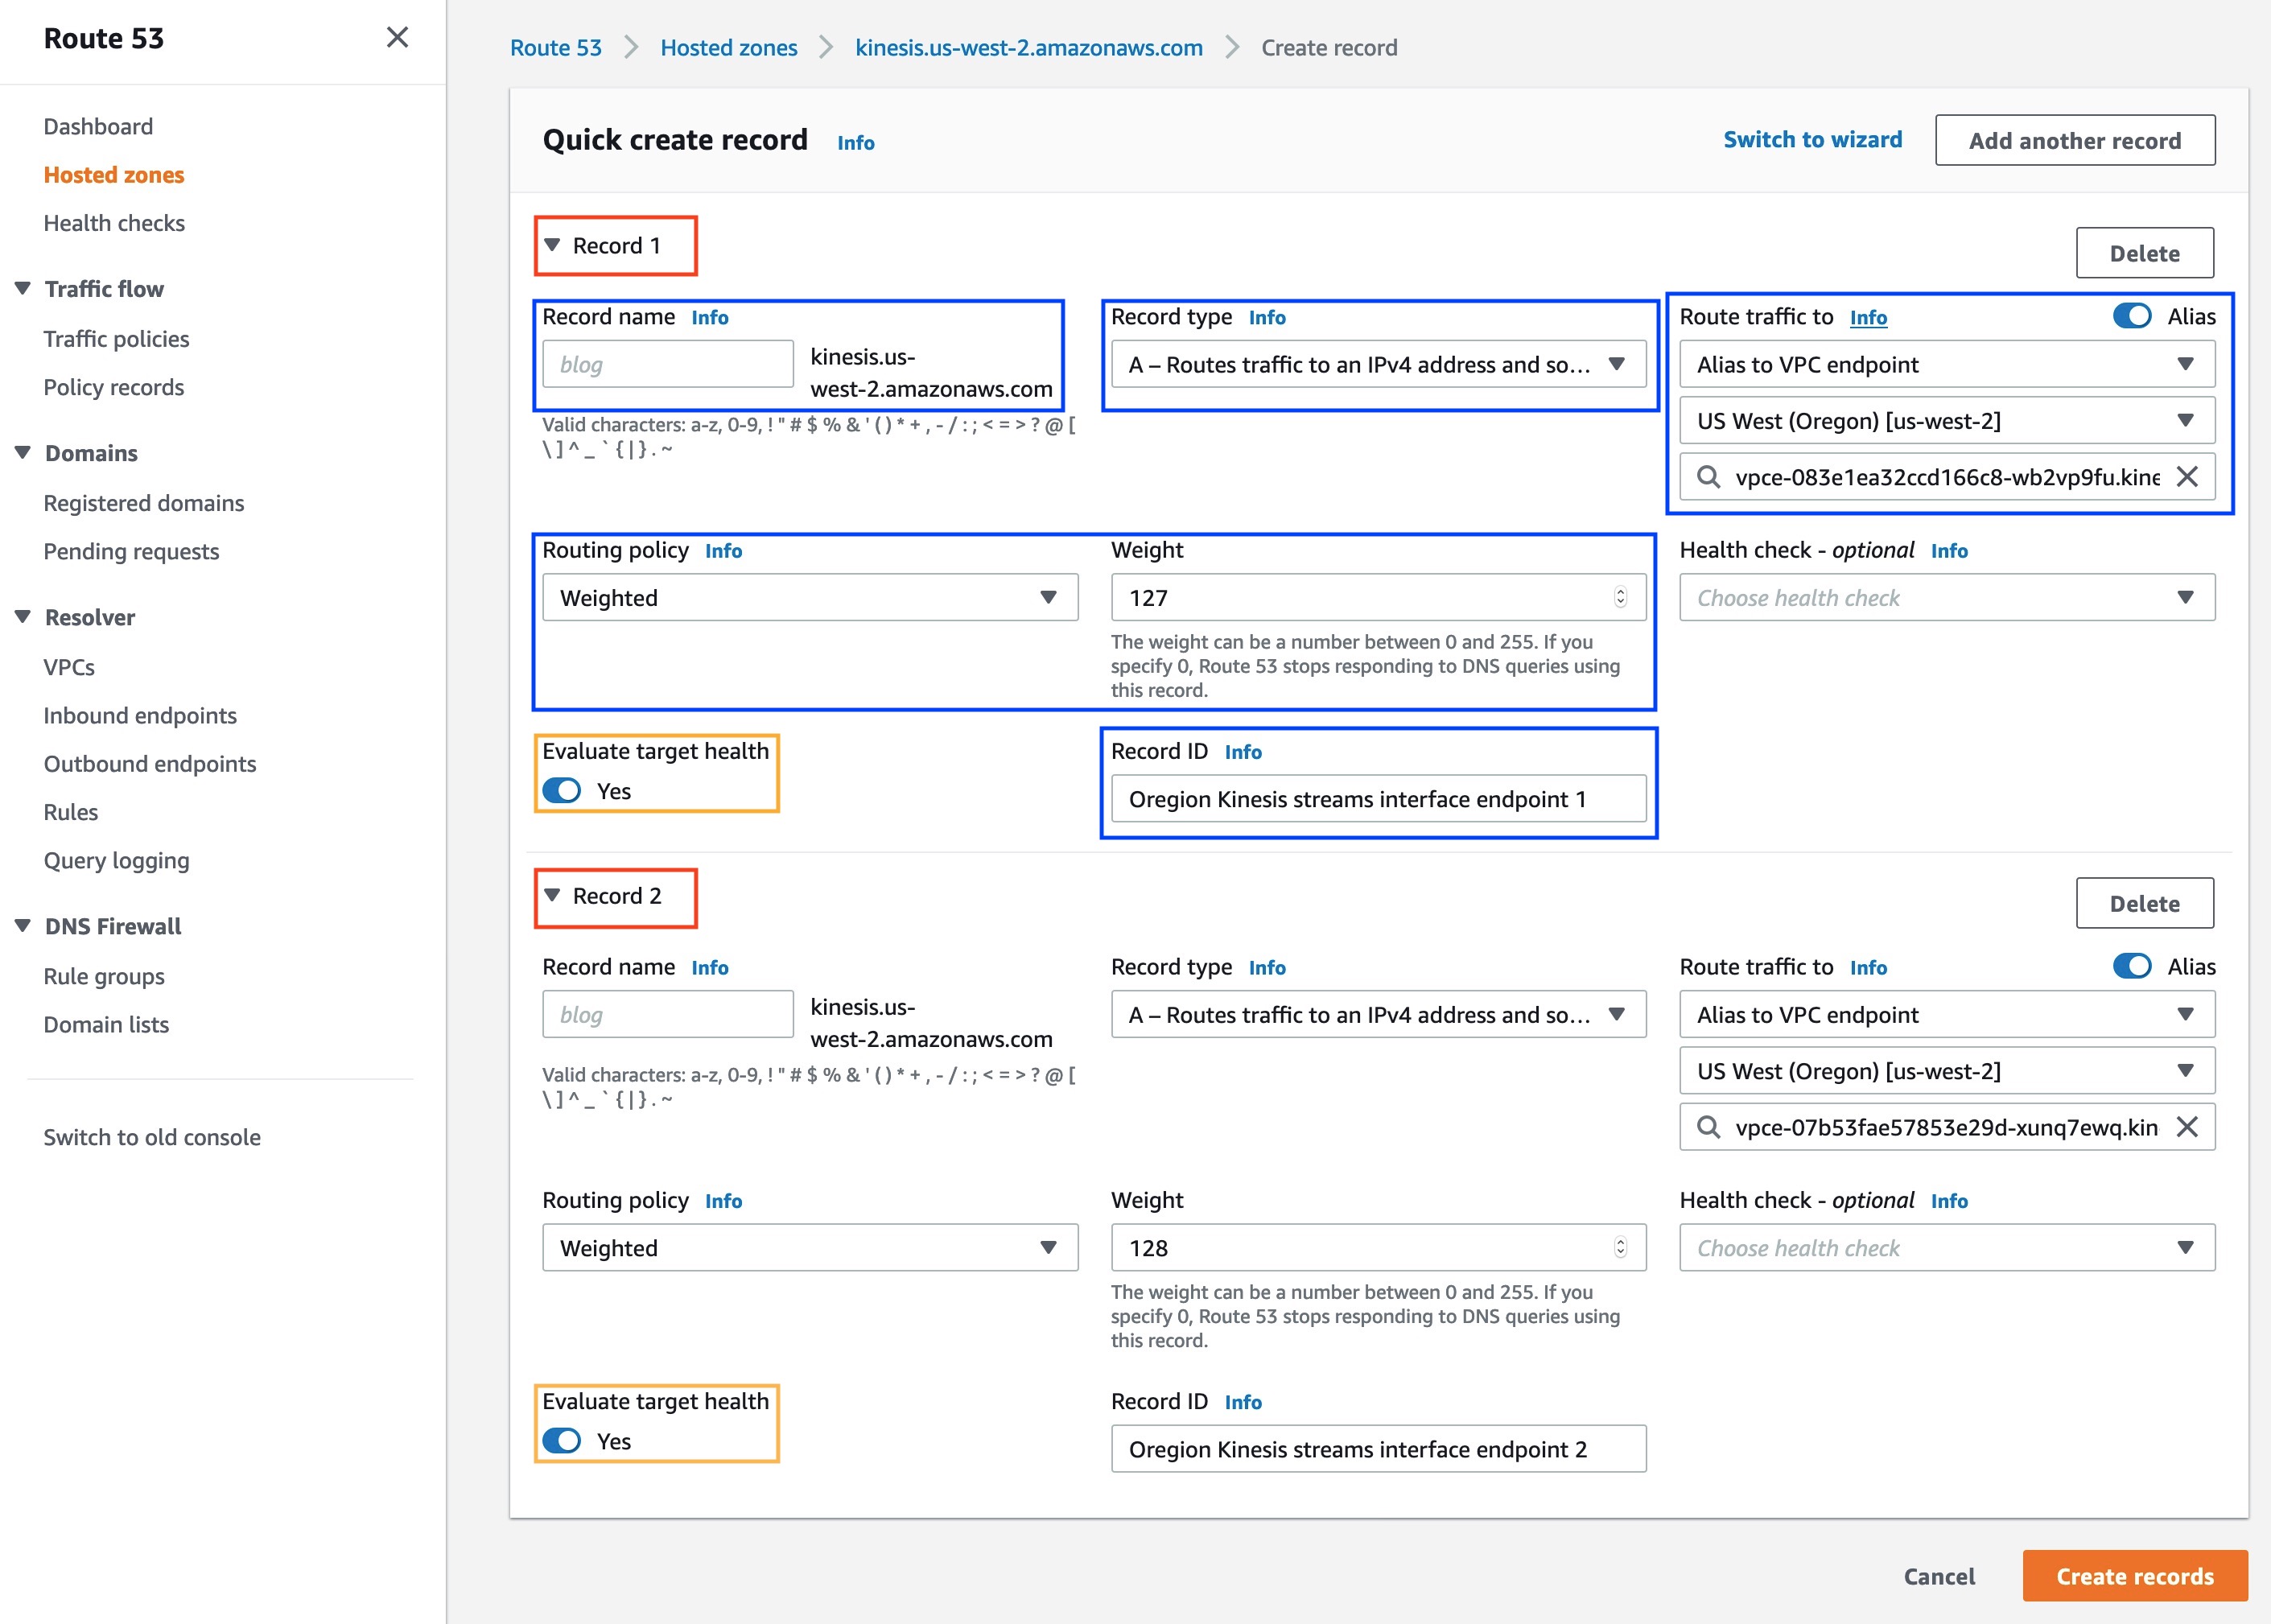
Figure 4: Create Weighted ALIAS A Records. This figure shows how to create weighted record
Considerations:
- To design scalable architecture, you should have good understanding of your traffic requirements – total required capacity, and how it is being dispersed/consumed.
- AWS PrivateLink managed Private DNS does not work with multiple endpoints. You must create your own Private Hosted Zone to use Private DNS with multiple endpoints, by following the steps mentioned in High-level workflow.
- As traffic scales on the consumer side, the VPC endpoint service on the service provider side also must scale.
- For AWS owned and operated services, AWS manages the service provider setup.
- For partner/independent software vendor (ISV) owned and operated services, partner/ISV manages the service provider setup.
- For shared services that you own and operate, you will be responsible for managing, and in turn, scaling service provider setup.
Monitoring:
Monitoring interface endpoints consumption allows you to either scale up or down to suit your business requirements. You can use VPC Flow Logs to monitor interface endpoint elastic network interface (ENI) utilization.
Here are the steps to setup interface endpoint monitoring:
- Step 1: Configure flow logs for each interface endpoint ENI that must be monitored. One-min aggregation interval is recommended for better granularity. Destination should be Amazon CloudWatch Logs, and choose the desired log group and IAM role. Custom format is required with at least the following fields (you can select more fields to view additional metadata if necessary):
- interface-id
- packets
- bytes
- tcp-flags.
Figures 5a and 5b show how to configure a VPC Flow Log for an ENI.
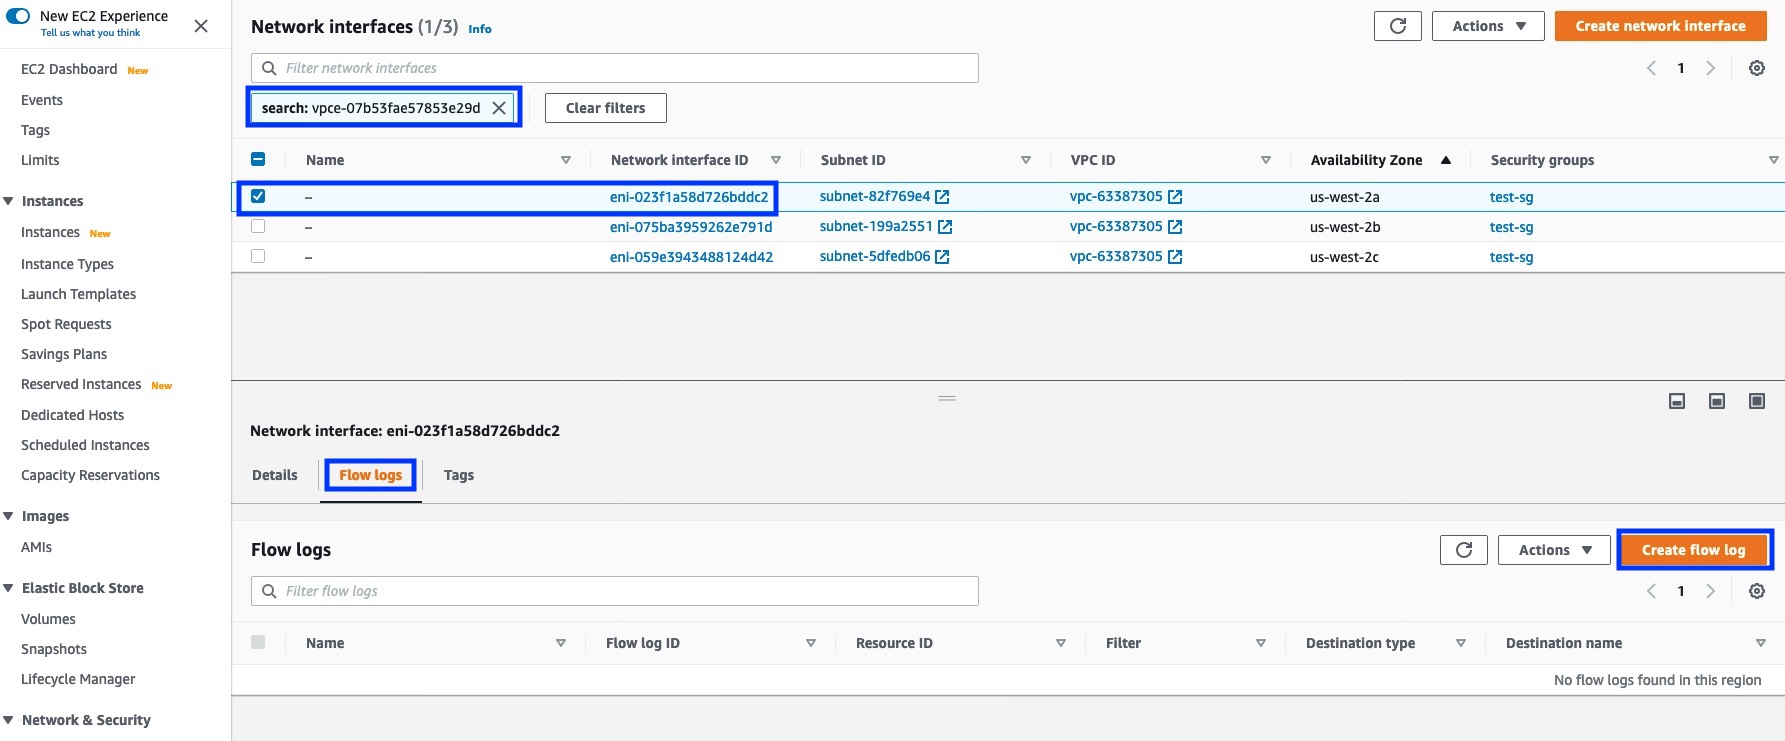
Figure 5a: Create VPC Flow Logs for VPC Endpoint ENI.
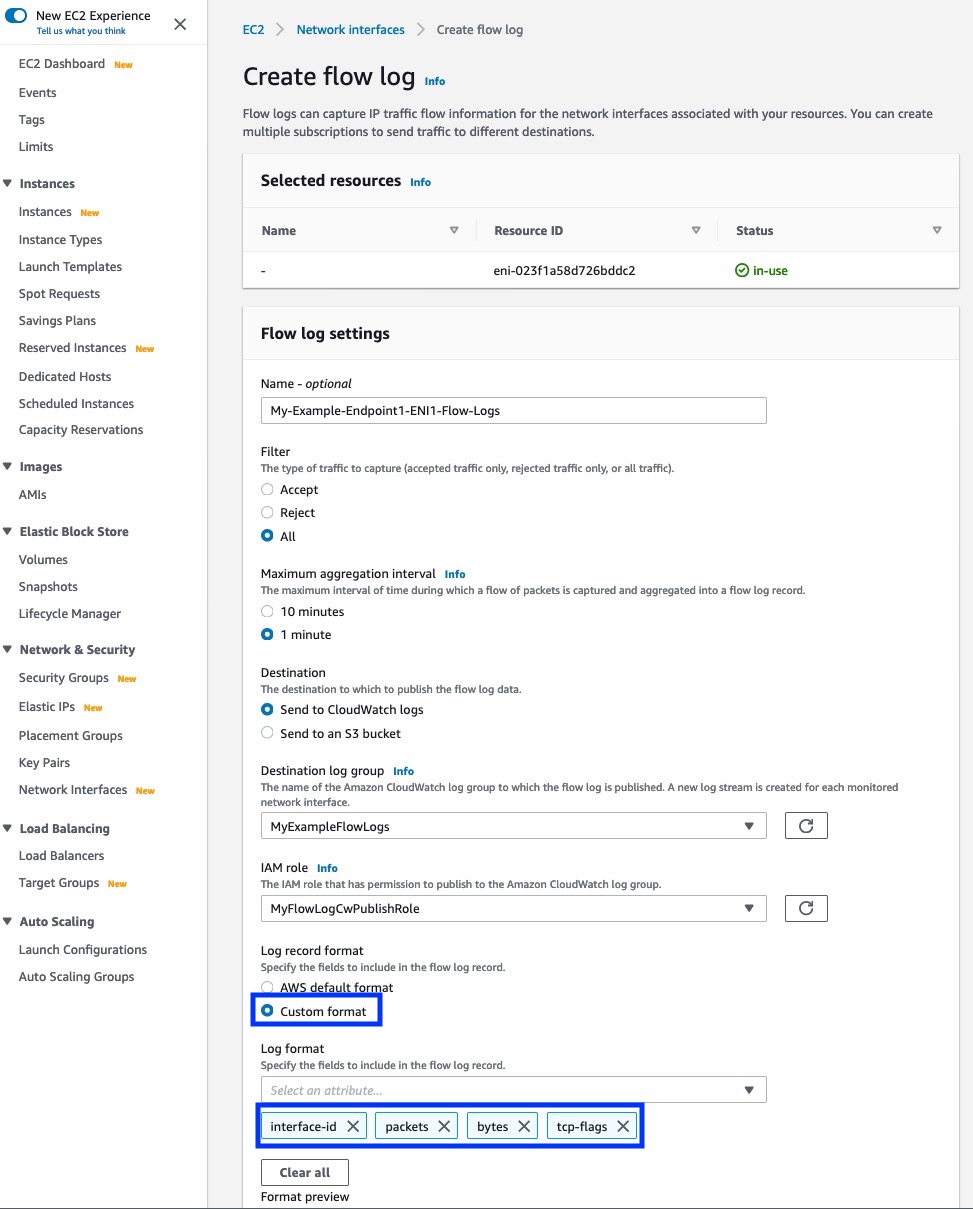
Figure 5b: Create VPC Flow Logs for VPC Endpoint ENI.
- Step 2: Using CloudWatch insights for each ENI, create the following queries. Make sure to use the correct parse format in case extra fields were added into the flow logs.
The following screenshots (Figures 6, 7 and 8) show how this looks when the query text is added in the console.
Bits/s Query:
fields @ingestionTime, @message, @timestamp, @logStream
| parse @message "* * * *" as interface, packets, bytes, tcpflags
| filter interface="eni-0dfebe5f446e64a66" -- REPLACE WITH YOUR VPC ENDPOINT ENI ID
| stats sum(bytes)*8/60 as avg_bps by bin(1m) as time
| sort time desc
Figure 6: Create Bits/s Query. This figure shows how to create a custom bits/s query.
Packets/s Query:
fields @ingestionTime, @message, @timestamp, @logStream
| parse @message "* * * *" as bytes, interface, packets, tcpflags
| filter interface="eni-0dfebe5f446e64a66" -- REPLACE WITH YOUR VPC ENDPOINT ENI ID
| stats sum(packets)/60 as avg_pps by bin(1m) as time
| sort time desc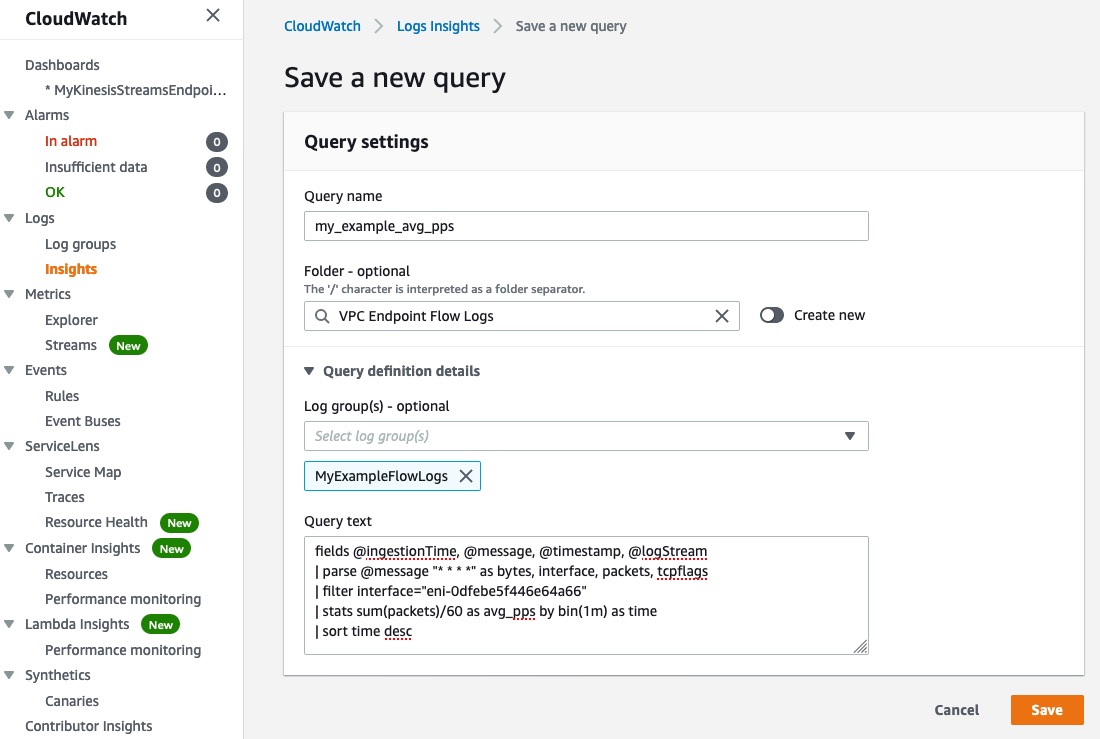
Figure 7: Create Packets/s Query.
New Connections/s Query:
fields @ingestionTime, @message, @timestamp, @logStream
| parse @message "* * * *" as interface, packets, bytes, tcpflags
| filter interface="eni-0dfebe5f446e64a66" and tcpflags=2  -- REPLACE WITH YOUR VPC ENDPOINT ENI ID
| stats sum(packets)/60 as cps by bin(1m) as time, interface
| sort time desc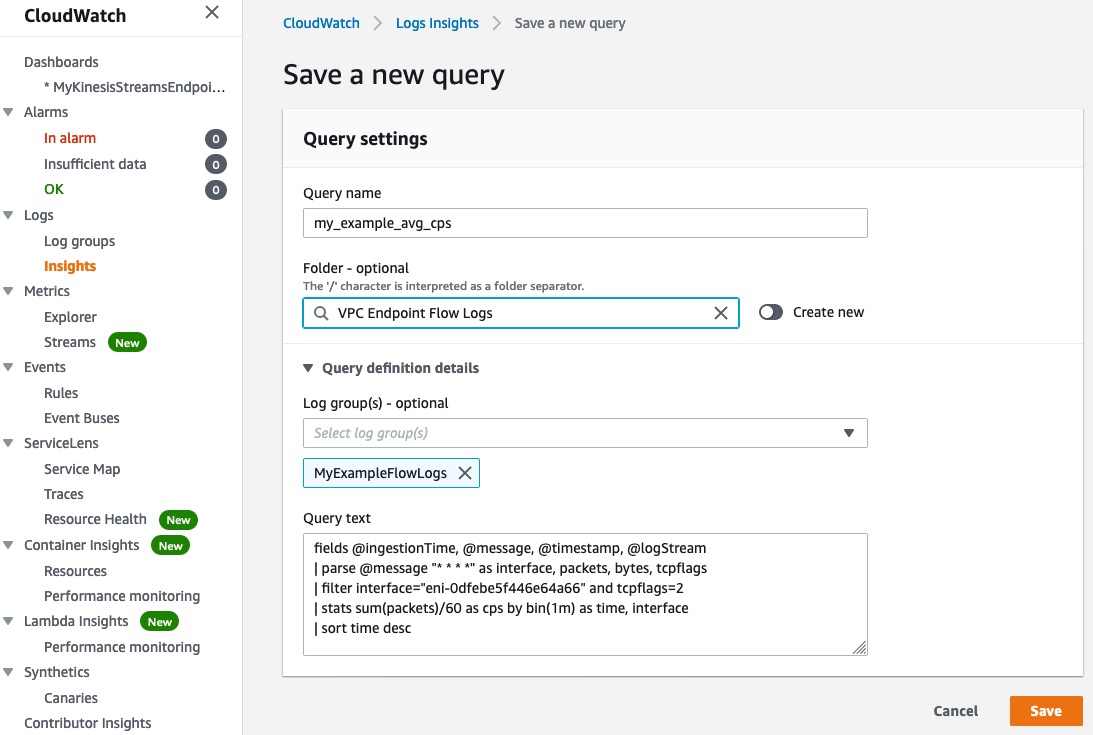
Figure 8: Create Connections/s Query.
- Step 3: Add the queries to the CloudWatch dashboard. This is shown in the following screenshots (Figures 9a and 9b).

Figure 9a: Add Bits/s Query to Dashboard.
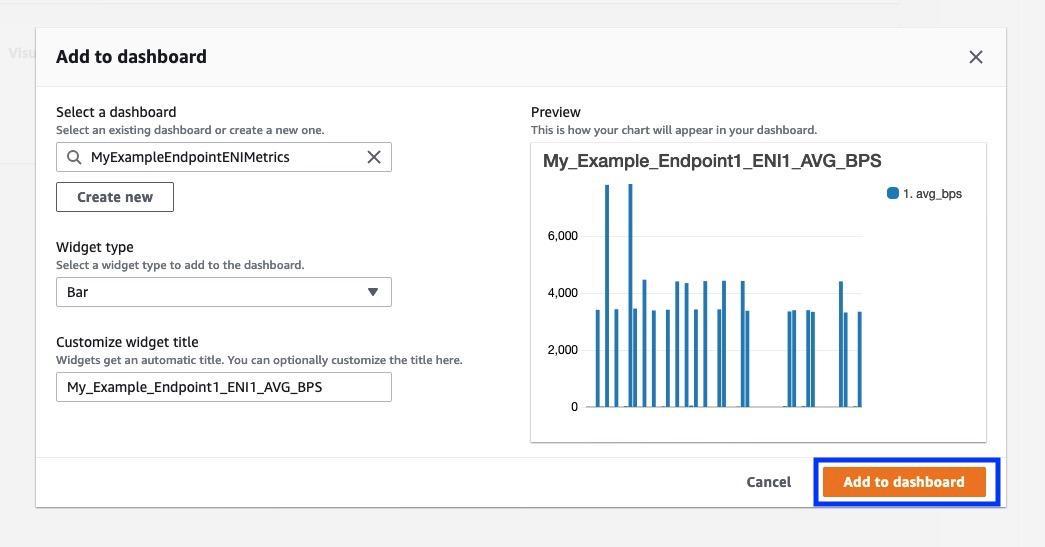
Figure 9b: Add Bits/s Query to Dashboard.
Repeat to add each query/insight to dashboard. The following screenshot (Figure 10) shows a completed CloudWatch Dashboard.
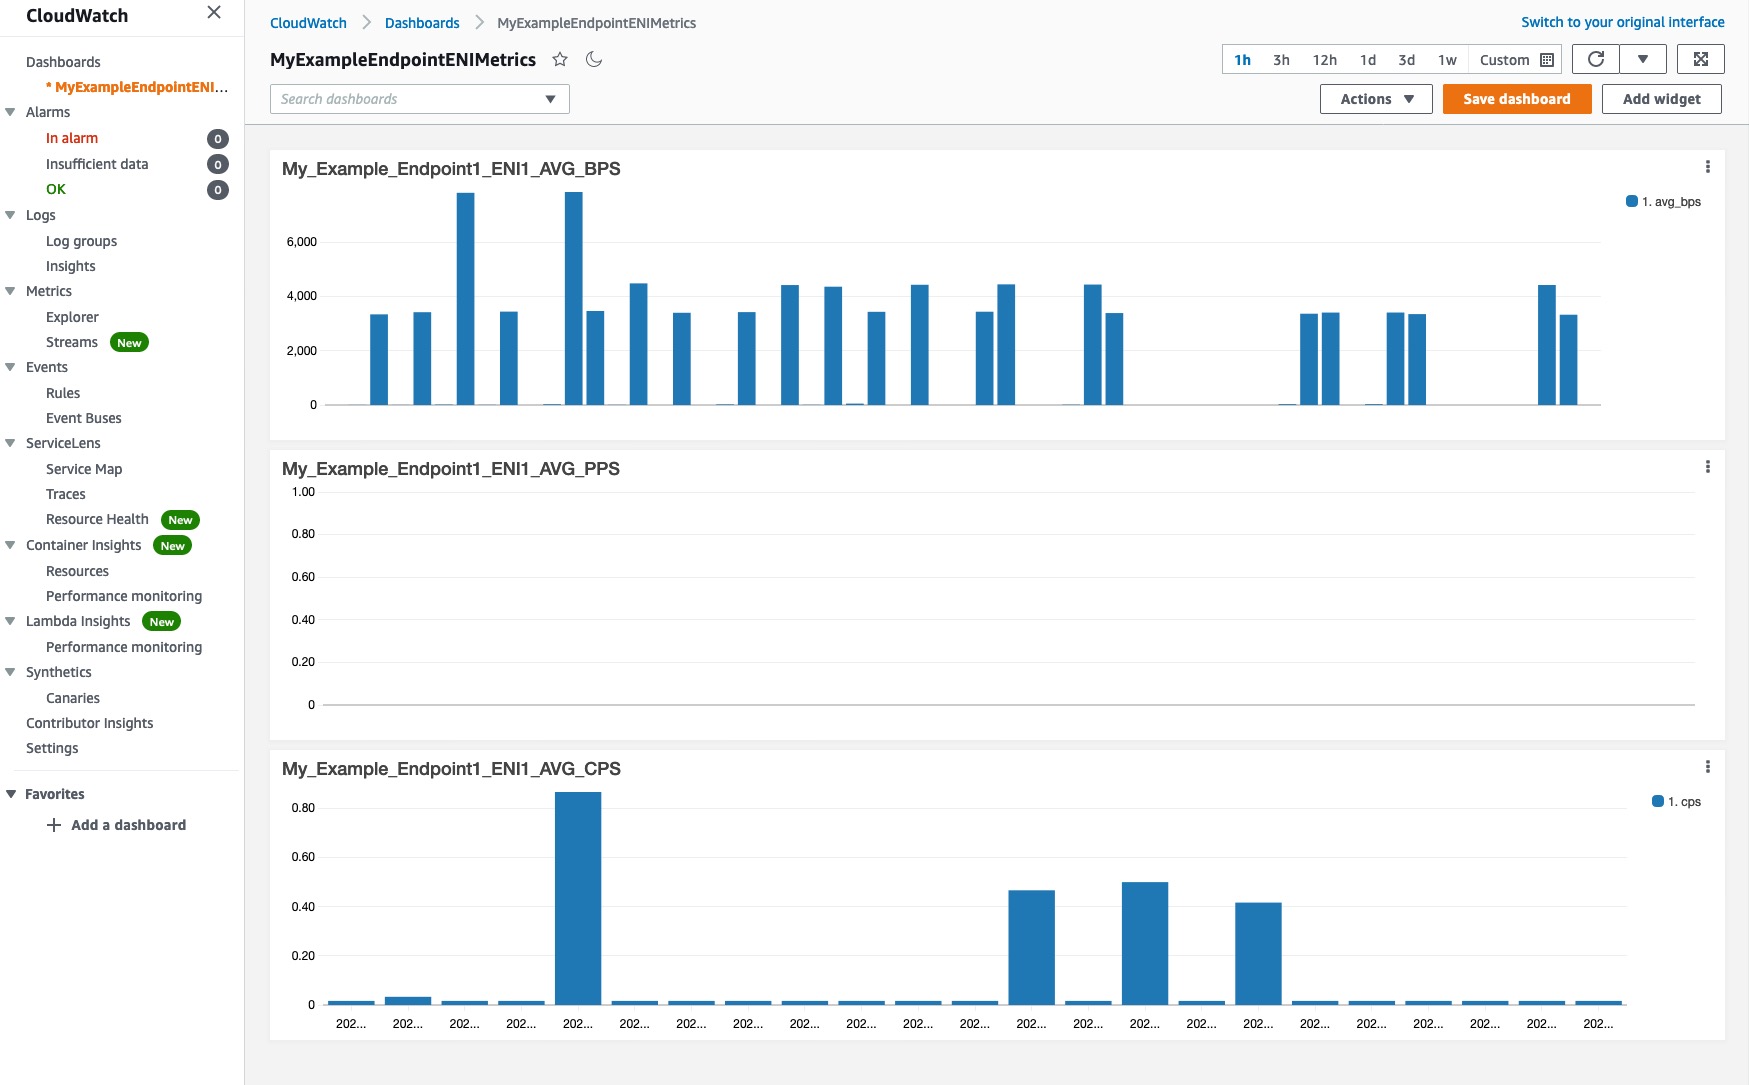
Figure 10: Sample VPC Endpoint ENI Metrics Dashboard.
- Step 4: Repeat steps for each ENI that must be monitored. Make sure to adjust the graph name and ENI ID in the queries.
Cleanup:
To cleanup your environment and ensure you don’t incur any unwanted charges, delete your interface endpoints, private hosted zone, and any other related resources that you might have created while going through this blog.
Conclusion:
AWS PrivateLink is a networking service that allows you to connect to AWS services, to shared services owned by customer in other VPCs, or to third-party SaaS services, privately and securely over the AWS network. In this blog, I showed you how you can achieve sustained bandwidth of greater than 10 Gbps/AZ by creating multiple interface endpoints and using Amazon Route 53 to distribute traffic across those endpoints. I also illustrated how to monitor interface endpoint ENI using VPC Flow Logs.
An update was made on February 6, 2024. The post has been updated to call out the availability of CloudWatch metrics for AWS PrivateLink, especially Endpoint metrics.
 Pratik R. Mankad