Container Orchestration platforms, such as Amazon Elastic Kubernetes Service (Amazon EKS), have simplified the process of building, securing, operating, and maintaining container-based applications. Therefore, they have helped organizations focus on building applications. Customers have started adopting event-driven deployment, allowing Kubernetes deployments to scale automatically in response to metrics from various sources dynamically.
By implementing event-driven deployment and autoscaling, customers can achieve cost savings by providing on-demand compute and autoscale efficiently that are based on custom needs. KEDA (Kubernetes-based Event Driven Autoscaler) lets you drive the autoscaling of Kubernetes workloads based on the number of events, such as a custom metric scraped breaching a specified threshold, or when there’s a message in a Amazon Managed Streaming for Apache Kafka queue.
Amazon CloudWatch is a monitoring and observability service built for DevOps engineers, developers, site reliability engineers (SREs), IT managers, and product owners. CloudWatch collects monitoring and operational data in the form of logs, metrics, and events. You get a unified view of operational health, and you gain complete visibility of your AWS resources, applications, and services running on AWS and on-premises.
This post will show you how to use KEDA to autoscale Amazon EKS pods by querying the metrics stored in CloudWatch.
Solution Overview
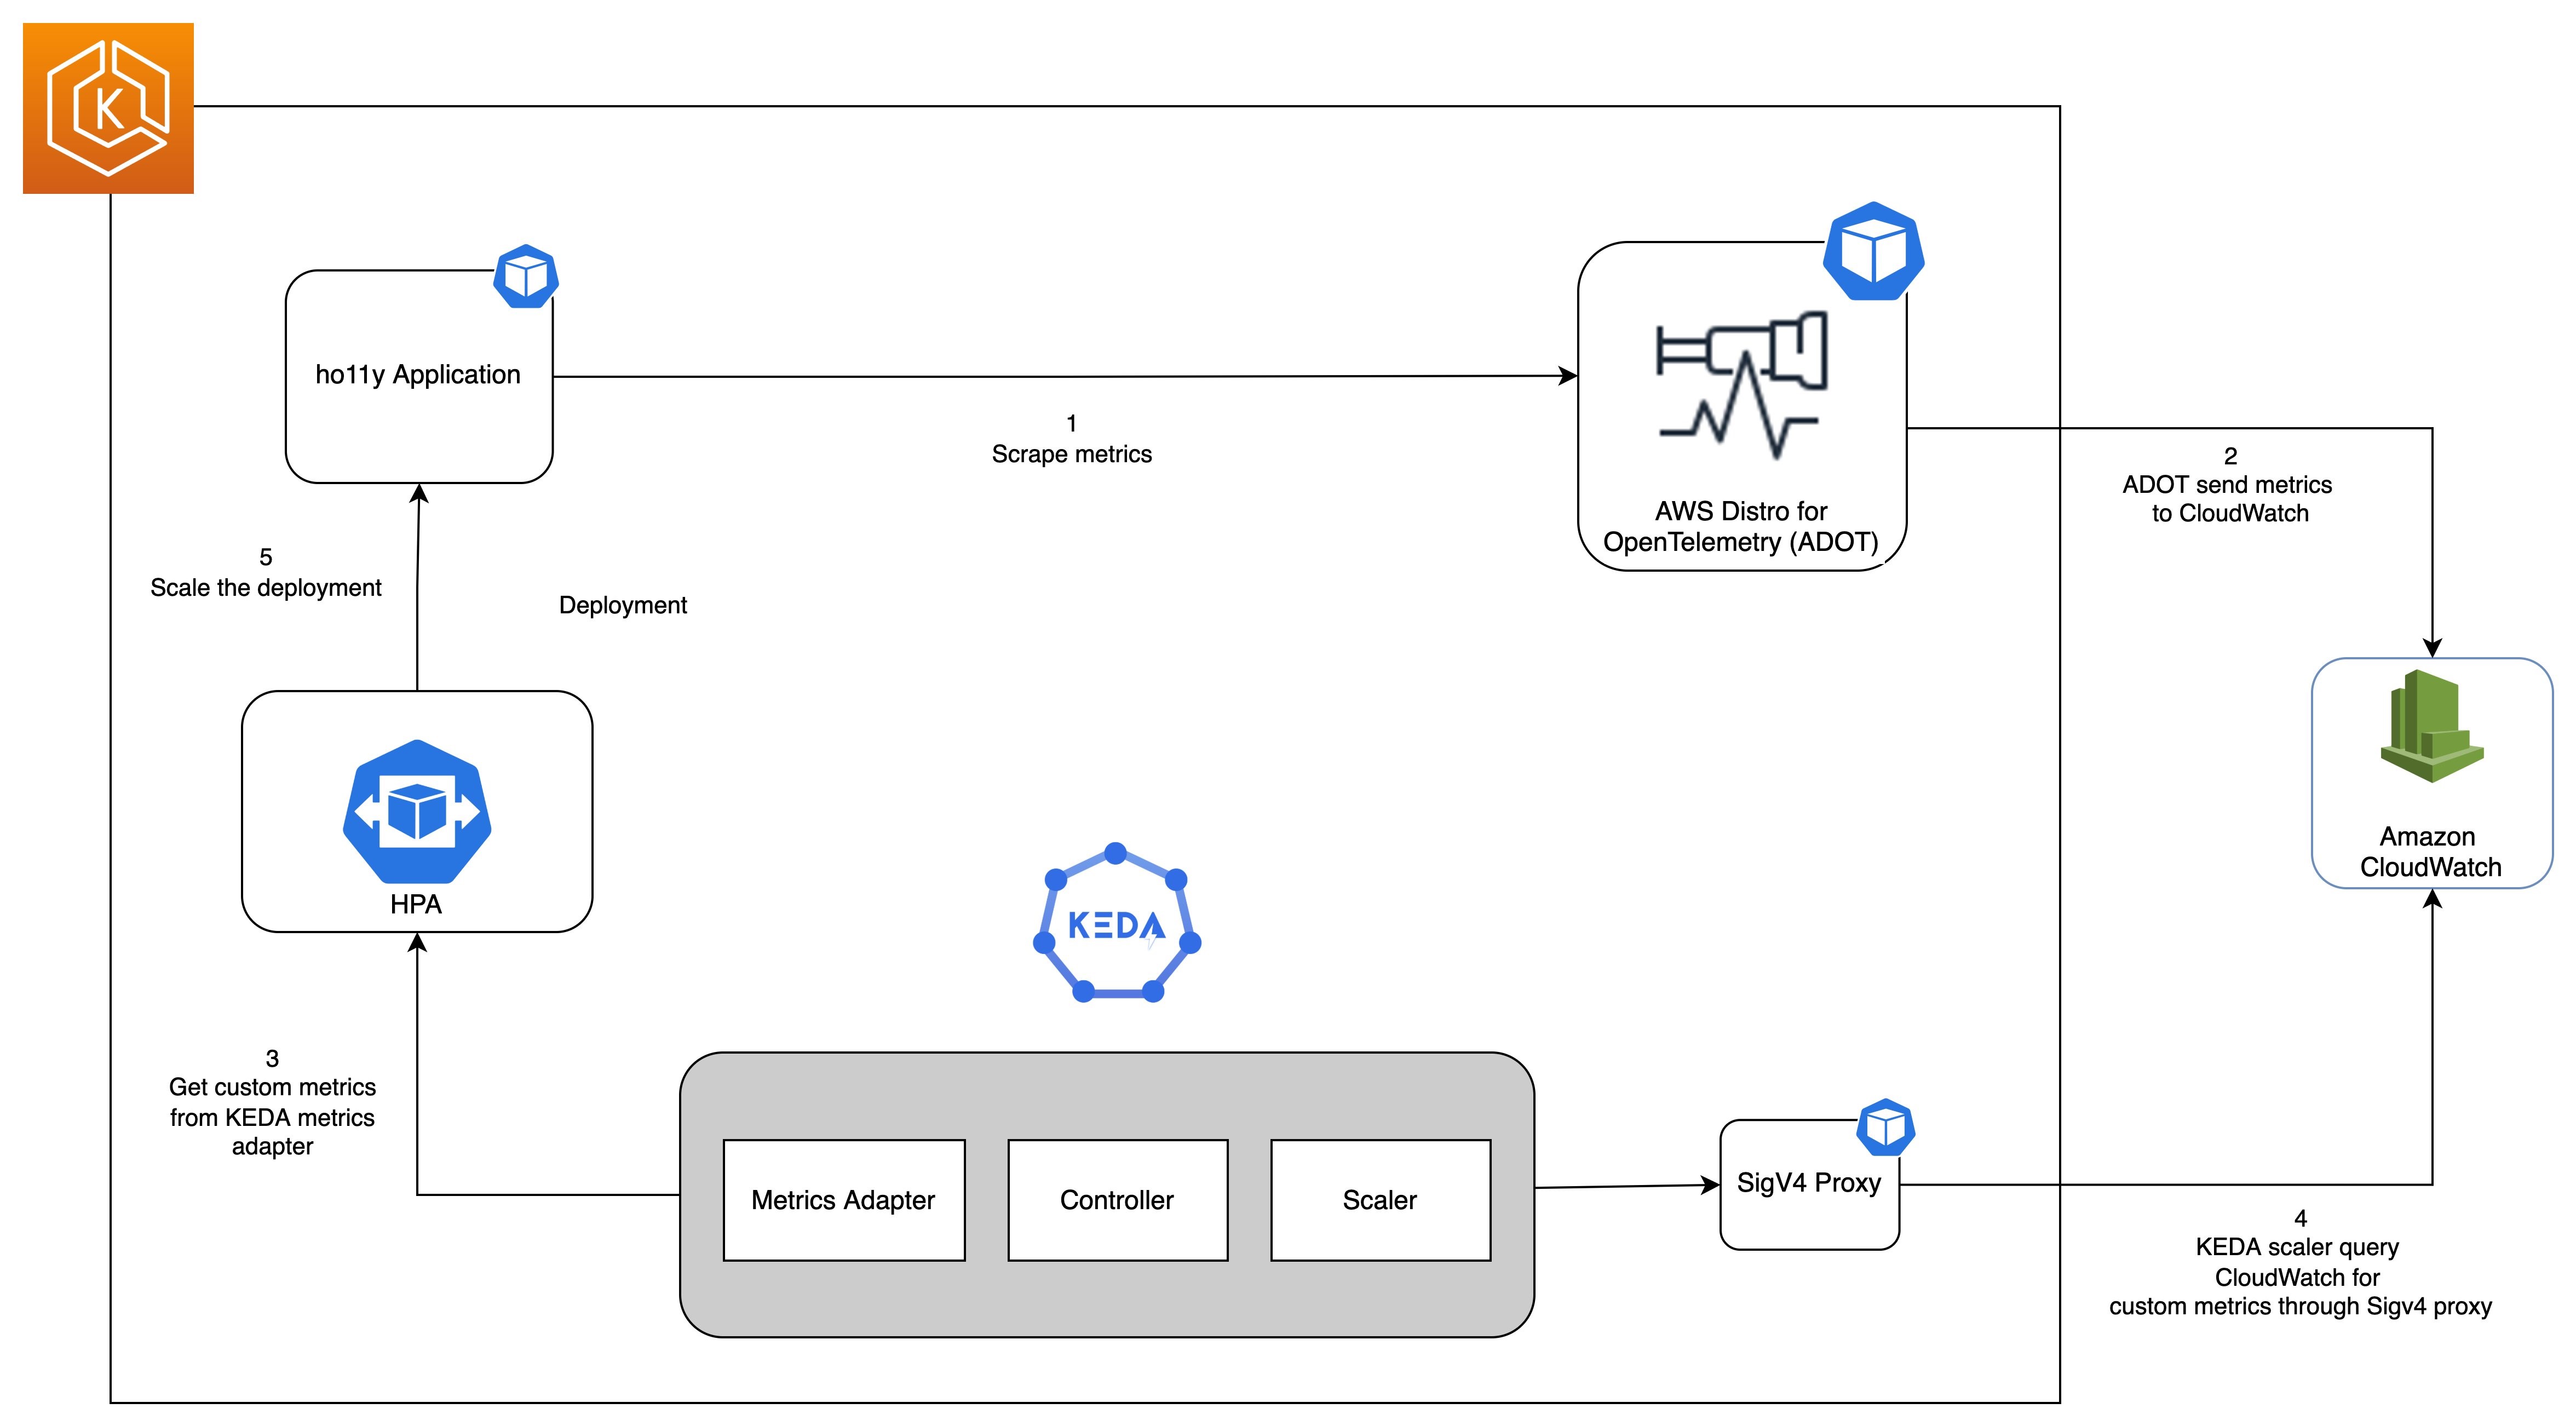
The following diagram shows the complete setup that we will walk through in this post.
Prerequisites
You will need the following to complete the steps in this post:
Create an Amazon EKS Cluster
You start by setting a few environment variables:
export CW_KEDA_CLUSTER=CW-KEDA-CLUSTER
export CW_ACCOUNT_ID=$(aws sts get-caller-identity --query 'Account' --output text)
export CW_AWS_REGION=us-west-2
export CW_HO11Y_ECR=$CW_ACCOUNT_ID.dkr.ecr.$CW_AWS_REGION.amazonaws.com
export CW_HO11Y_IMAGE=$CW_ACCOUNT_ID.dkr.ecr.$CW_AWS_REGION.amazonaws.com/ho11y:latest
Next, you prepare the required Kubernetes scripts with a shell script from this GitHub repository and create an Amazon EKS cluster using eksctl:
git clone https://github.com/aws-samples/containers-blog-maelstrom.git
cd ./containers-blog-maelstrom/scaling-with-KEDA
mkdir build
#Run a Shell script to prepare kubernetes scripts for this demo.
chmod +x build-k8s-scripts.sh
./build-k8s-scripts.sh

eksctl create cluster -f ./build/eks-cluster-config.yaml
Creating a cluster can take up to 10 minutes. When the creation completes, proceed to the next steps.
Deploying a KEDA Operator
Next, you install the keda operator in the keda namespace of our Amazon EKS cluster by using the following commands:
helm repo add kedacore https://kedacore.github.io/charts
# Helm install for Keda Operator
helm install keda kedacore/keda \
  --namespace keda \
  -f ./keda-values.yaml
Now you can check on the keda operator pods:
$ kubectl get pods -n keda

NAME                                              READY   STATUS    RESTARTS   AGE
keda-operator-68b7cbdc78-g9lqv                    1/1     Running   0          32s
keda-operator-metrics-apiserver-5d95f8799-dl8kp   1/1     Running   0          32s
Deploy sample application
You will use a sample application called ho11y, a synthetic signal generator that lets you test observability solutions for microservices. It emits logs, metrics, and traces in a configurable manner. For more information, see the AWS O11y Receipes respository.
#Run a Shell script to build and push a docker image for ho11y app to Amazon ECR.
chmod +x build-docker-image.sh
./build-docker-image.sh
kubectl apply -f ./build/ho11y-app.yaml
This command will create the Kubernetes deployments and services as shown in the following:
$ kubectl get all -n ho11y

NAME                               READY   STATUS    RESTARTS   AGE
pod/downstream0-c6859bf6d-sk656    1/1     Running   0          3m14s
pod/downstream1-56f74998d5-7w2hw   1/1     Running   0          3m14s
pod/frontend-8796bd84b-7kndl       1/1     Running   0          3m15s

NAME                  TYPE        CLUSTER-IP       EXTERNAL-IP   PORT(S)   AGE
service/downstream0   ClusterIP   10.100.163.218   <none>        80/TCP    3m14s
service/downstream1   ClusterIP   10.100.90.177    <none>        80/TCP    3m13s
service/frontend      ClusterIP   10.100.43.237    <none>        80/TCP    3m14s

NAME                          READY   UP-TO-DATE   AVAILABLE   AGE
deployment.apps/downstream0   1/1     1            1           3m16s
deployment.apps/downstream1   1/1     1            1           3m16s
deployment.apps/frontend      1/1     1            1           3m17s

NAME                                     DESIRED   CURRENT   READY   AGE
replicaset.apps/downstream0-c6859bf6d    1         1         1       3m16s
replicaset.apps/downstream1-56f74998d5   1         1         1       3m16s
replicaset.apps/frontend-8796bd84b       1         1         1       3m17skubectl get all -n ho11y
Scrape metrics using AWS Distro for OpenTelemetry (ADOT)
Next, you will deploy an OpenTelemetry (ADOT) collector to scrape Amazon Managed Service for Prometheus metrics emitted from the ho11y application
eksctl create iamserviceaccount \
  --name adot-collector \
  --namespace ho11y \
  --cluster $CW_KEDA_CLUSTER \
  --attach-policy-arn arn:aws:iam::aws:policy/CloudWatchAgentServerPolicy \
  --region $CW_AWS_REGION
  --approve

kubectl apply -f ./build/cw-eks-adot-prometheus-deployment.yaml
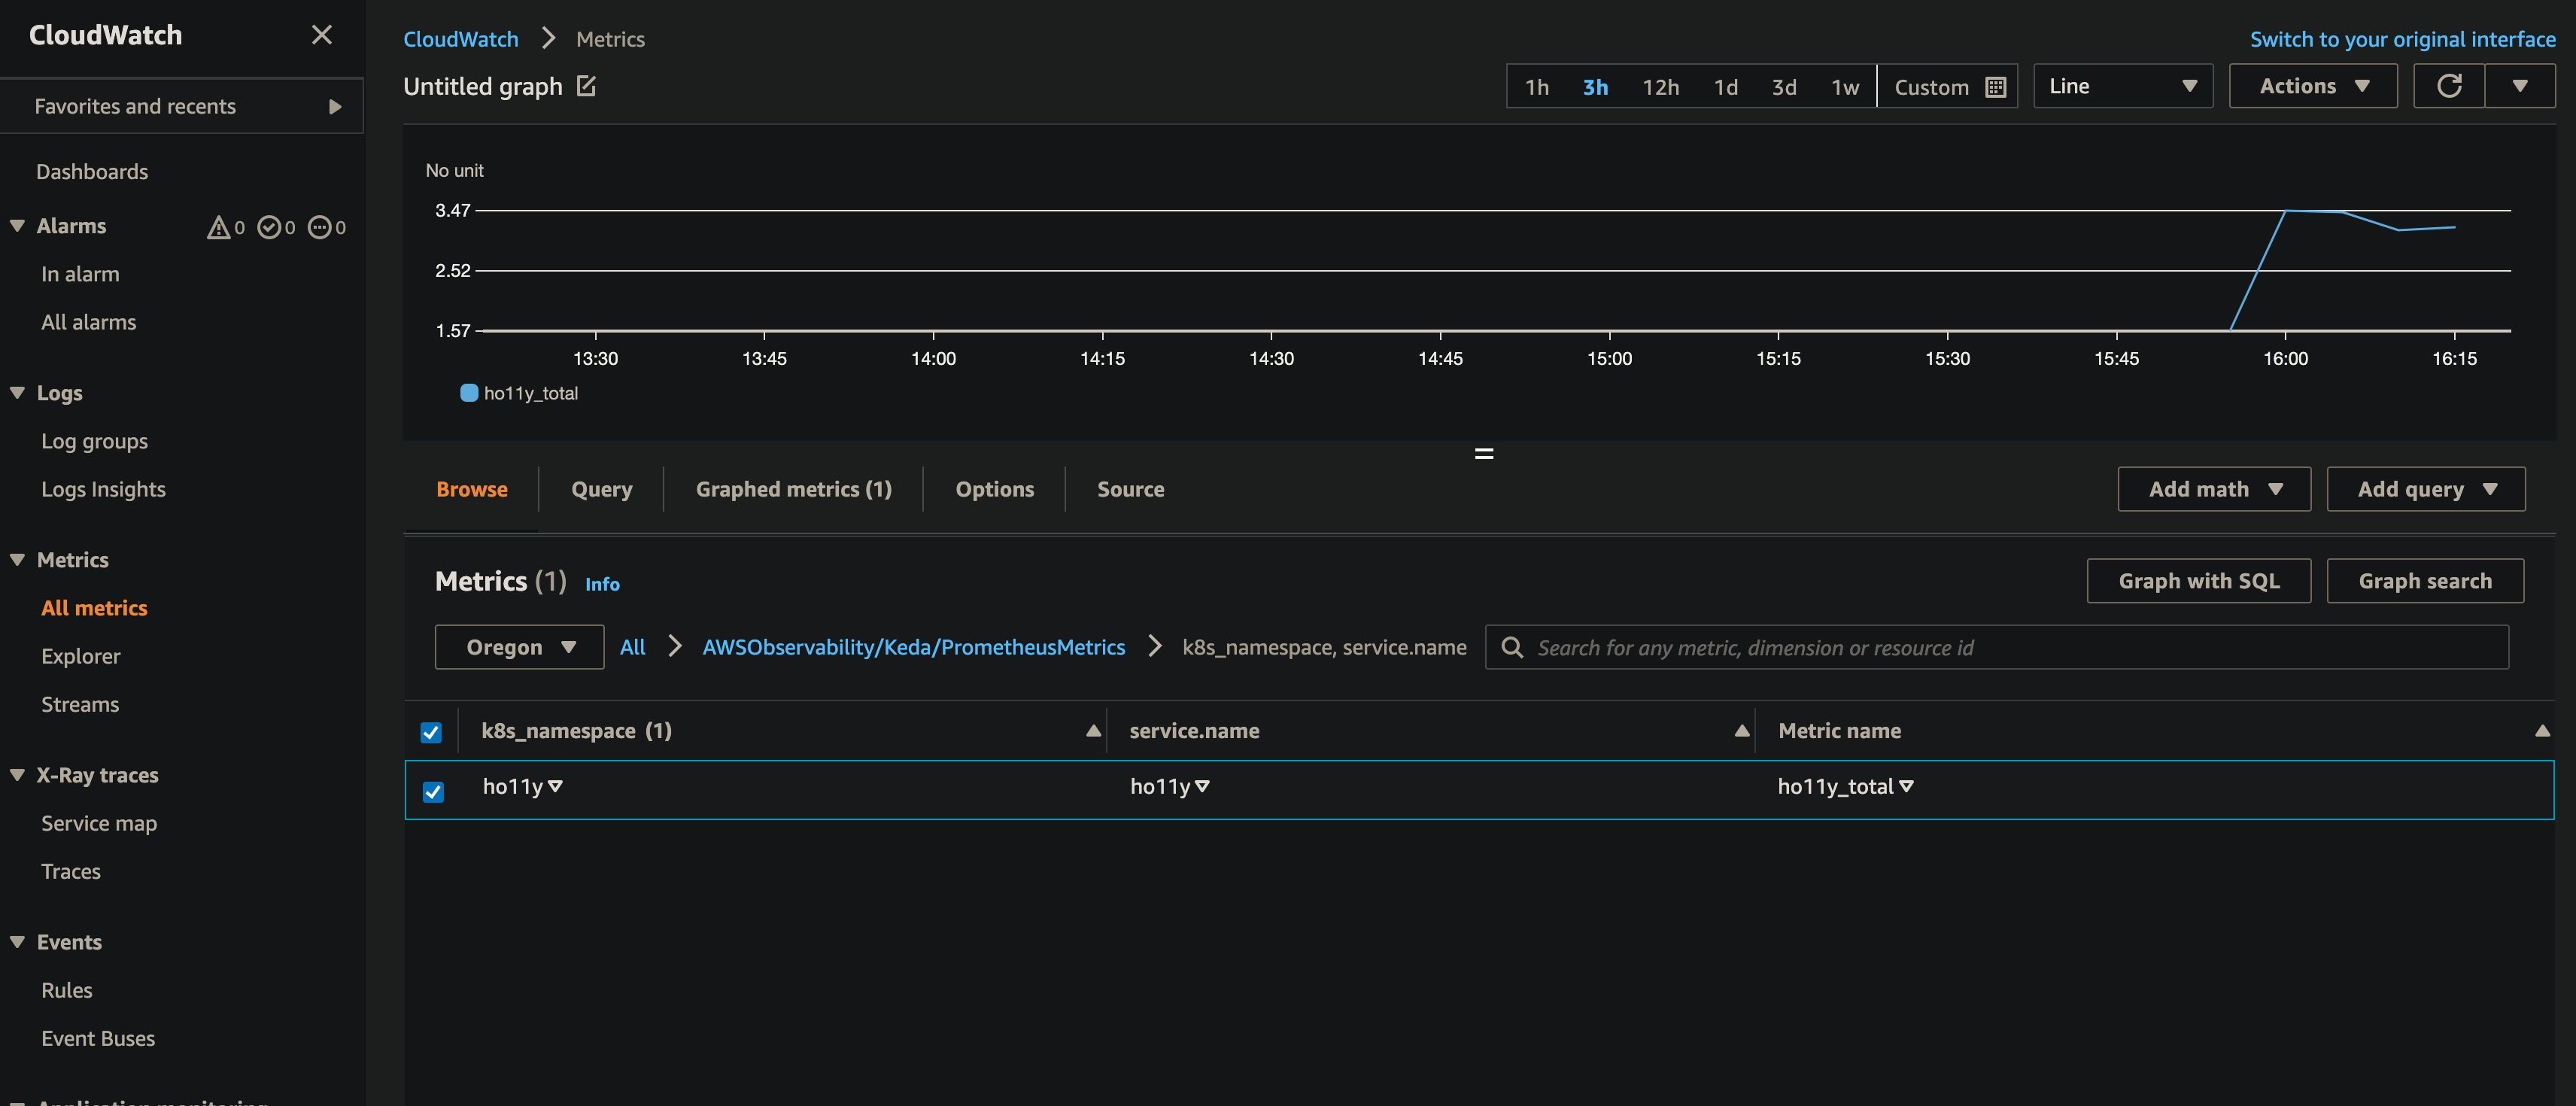
After the ADOT collector is deployed, it will collect the metrics and ingest them into the specified CloudWatch namespace. The scrape configuration is similar to that of a Prometheus server. We have added the necessary configuration for scraping metrics from the ho11y application.
Navigate to your CloudWatch console and look at the holly_total metric. The deep link opens in the Oregon (us-west-2) Region. You can specify a different Region in the top-right console corner.
Configure sigv4 authentication for querying custom metrics from CloudWatch
AWS Signature Version 4 is a process to add authentication information to requests made to AWS APIs using HTTP. The AWS Command Line Interface (AWS CLI) and AWS SDKs use this protocol to make calls to the AWS APIs. CloudWatch API calls require sigv4 authentication. Furthermore, since KEDA doesn’t support sigv4, we’ll deploy a sigv4 proxy as a K8s Service to act as a gateway for KEDA to access the query CloudWatch API endpoints.
Execute the following commands to deploy the sigv4 proxy:
kubectl apply -f ./build/keda-sigv4.yaml
Setup autoscaling using KEDA scaled object
Next, you will create the ScaledObject that will scale the deployment by querying the metrics stored in CloudWatch. A ScaledObject represents the desired mapping between an event source, such as a Prometheus metric and the Kubernetes Deployment, StatefulSet, or any Custom Resource that defines /scale sub-resource.
Behind the scenes, KEDA monitors for the event source, and then feeds that data to Kubernetes and the HPA (Horizontal Pod Autoscaler) to drive the scaling of the specified Kubernetes resource. Each replica of a resource is actively pulling items from the event source.
The following commands will deploy the ScaledObject named ho11y-hpa that will query the CloudWatch endpoint for a custom metric called ho11y_total. The ho11y_total metric represents the number of application invocations, and the threshold is specified as one. Depending on the value over a period of one minute, the scale in/out of downstream0 deployment happens between 1 and 10 pods.
apiVersion: keda.sh/v1alpha1
kind: ScaledObject
metadata:
  name: ho11y-hpa
  namespace: ho11y
spec:
  scaleTargetRef:
    apiVersion: apps/v1
    kind: Deployment
    name: downstream0       # Name of deployment you want to autoscale; Must be in same namespace as scaled object
  pollingInterval:  30      # Optional. Default: 30; the interval to check each trigger on
  cooldownPeriod:   300     # Optional. Default: 300; the period to wait after the last trigger reported active before scaling the deployment back to minReplicaCount
  fallback:
    failureThreshold: 3
    replicas: 2
  minReplicaCount: 1        # Optional. Default: 0; minimum number of replicas that KEDA will scale the deployment down to
  maxReplicaCount: 10       # Optional. Default: 100; the maximum number of replicas that KEDA will scale the deployment out to
  triggers:                 # Trigger activate the deployment
    - type: aws-cloudwatch
      metadata:
        namespace: AWSObservability/Keda/PrometheusMetrics
        dimensionName: k8s_namespace;service.name
        dimensionValue: ho11y;ho11y
        metricName: ho11y_total
        targetMetricValue: '1'
        minMetricValue: '0'
        awsRegion: "{{CW_AWS_REGION}}"
        identityOwner: operator
---
KEDA also supports the scaling behavior that we configure in the Horizontal Pod Autoscaler. To make your scaling even more powerful, you can configure the pollingInterval and cooldownPeriod configurations. Follow this link to get more details on the CloudWatch trigger and the scaled object. Moreover, KEDA supports various additional scalers, and a current list of scalers is available on the KEDA home page.
Once we deploy the scaledobject, the KEDA will also create an HPA object in the ho11y namespace with the configuration specified in the scaledobject.yaml:
kubectl apply -f ./build/scaledobject.yaml
kubectl get hpa -n ho11y

NAME                 REFERENCE                TARGETS     MINPODS   MAXPODS   REPLICAS   AGE
keda-hpa-ho11y-hpa   Deployment/downstream0   0/1 (avg)   1         10        1          2d10h
Then take a quick look at our deployment/pod for ho11y:
$ kubectl get deploy downstream0 -n ho11y
NAME  READY   UP-TO-DATE   AVAILABLE   AGE
downstream0   1/1     1            1           8d
Loading the ho11y application
You need to place some load on the application by running the following commands:
frontend_pod=`kubectl get pod -n ho11y --no-headers -l app=frontend -o jsonpath='{.items[*].metadata.name}'`
loop_counter=0
while [ $loop_counter -le 5000 ] ;
do
	kubectl exec -n ho11y -it $frontend_pod -- curl downstream0.ho11y.svc.cluster.local;
	echo ;
	loop_counter=$[$loop_counter+1];
done
Next, you will investigate the deployment to see if our deployment downstream0 is scaling in to spin more pods in response to the load on the application. Increased load on the application will cause the ho11y_total custom metric in CloudWatch to go to one or higher, and it will trigger the deployment/pod scaling.
Note that it can take a few minutes before observing the deployment scale-in.
$ kubectl get deploy downstream0 -n ho11y -w
NAME          READY   UP-TO-DATE   AVAILABLE   AGE
downstream0   1/1     1            1           8d
downstream0   1/4     1            1           8d
downstream0   1/4     1            1           8d
downstream0   1/4     1            1           8d
downstream0   1/4     4            1           8d
downstream0   2/4     4            2           8d
downstream0   3/4     4            3           8d
downstream0   4/4     4            4           8d
downstream0   4/7     4            4           8d
downstream0   4/7     4            4           8d
downstream0   4/7     4            4           8d
downstream0   4/7     7            4           8d
downstream0   5/7     7            5           8d
downstream0   6/7     7            6           8d
downstream0   7/7     7            7           8d
downstream0   6/7     7            6           8d
downstream0   7/7     7            7           8d
Describe the HPA using the following command, and you should see SuccessfulRescale happening from horizontal-pod-autoscaler
kubectl describe hpa -n ho11y
This concludes the usage of KEDA to successfully autoscale the application using the metrics ingested into CloudWatch.
Clean-up
You will continue to incur cost until deleting the infrastructure that you created for this post. Delete the cluster resources using the following commands:
kubectl delete -f ./build/scaledobject.yaml
kubectl delete -f ./build/keda-sigv4.yaml
kubectl delete -f ./build/cw-eks-adot-prometheus-daemonset.yaml
kubectl delete -f ho11y-app1.yaml
helm delete keda kedacore/keda --namespace keda
eksctl delete cluster $CW_KEDA_CLUSTER
Conclusion
This post demonstrates the detailed steps for utilizing the KEDA operator to autoscale deployments based on custom metrics emitted by the instrumented application that CloudWatch pushes. This capability helps customers scale compute capacity on-demand by provisioning the pods only when needed to serve bursts of traffic. Furthermore, CloudWatch lets you store the metrics reliably. KEDA can also monitor and efficiently scale the workloads out/in based on the events occurring.
Also checkout Proactive autoscaling of Kubernetes workloads with KEDA post if you are curious to learn about autoscaling your kubernetes workloads using metrics ingested into Amazon Managed Service for Prometheus.
Authors: