AWS Cloud Operations Blog
Improve monitoring efficiency using Amazon CloudWatch Composite Alarms
OVERVIEW
Amazon CloudWatch alarms help customers improve infrastructure monitoring efficiency by reducing the time to detect, triage, and diagnose issues that impact workload performance. CloudWatch alarms can be used extensively as a means to alert customers when application and infrastructure metrics exceed static or dynamically set thresholds.
On March 4, 2020 AWS released CloudWatch composite alarms to extend existing alarm capability. Composite alarms enhance existing alarm capability giving customers a way to logically combine multiple alarms together. A single infrastructure event may generate multiple alarms, and the volume of alarms can overwhelm operators or mislead the triage and diagnosis process. If this happens, operators can end up dealing with alarm fatigue or waste time reviewing a large number of alarms to identify the root cause. Composite alarms gives operators the ability to add logic and group alarms into a single high-level alarm, which is triggered when the underlying conditions are met. This gives operators the ability to make intelligent decisions and reduces the time to detect, diagnose, and triage performance issues when they happen.
CloudWatch alarm states can be one of three values, “OK”, “ALARM” and “INSUFFICIENT_DATA”. Composite alarms are created using the states of one or more alarms combined via Boolean operators “AND”, “OR”, “NOT” and constants “TRUE” and “FALSE”. A composite alarm is triggered when its expression evaluates to be TRUE.
Composite alarms can be created using the AWS Management Console, AWS Command Line Interface (AWS CLI), AWS SDKs, and AWS CloudFormation. This blog post describes the process of creating a composite alarm to monitor the CPU utilization of burstable performance instances. Burstable performance instances include T3, T3a, and T2 instances. They are designed to provide a baseline level of CPU performance with the ability to burst to a higher level when required by your workload. Burstable performance instances are the only instance types that use credits for CPU usage. Therefore, it’s valuable for operators to get insights into the corelation between workload and CPU credit utilization.
Our goal is to create a composite alarm to monitor the CPU utilization. The composite alarm monitors the utilization above the baseline CPU utilization for our T2.small instance and the number of CPU credits available for the instance. We use a composite alarm because high CPU may be acceptable for some workloads, but these workloads cannot be sustained when all CPU credits are consumed. DevOps operators and capacity planning teams can then use this information to make informed instance selection decisions in the future.
Prerequisites
1. A running T2.small instance with detailed monitoring enabled. Our alarms monitor performance on a T2.small instance. By default, the instance is configured with basic monitoring. Basic monitoring provides performance data at 5-minute intervals for free and detailed monitoring provides the same at 1-minute intervals at a small cost. Composite Alarms work the same with detailed and basic monitoring.
2. An Amazon Simple Notification Service (Amazon SNS) Topic (for example “CW_Alarms”) for notification delivery.
Step 1. Create a metric alarm for CPU above baseline utilization
T2.small instances have a baseline performance of 20%. CPU credits are earned for the instance at times when utilization is below 20%. Those credits are then used when the workload requires higher CPU. We start in the CloudWatch console, select “Alarms” in the left pane and then “Create alarm” for our instance.

The alarm is based on the “CPUUtilization” metric for our instance available in the “EC2” namespace, “Per-Instance Metrics”.
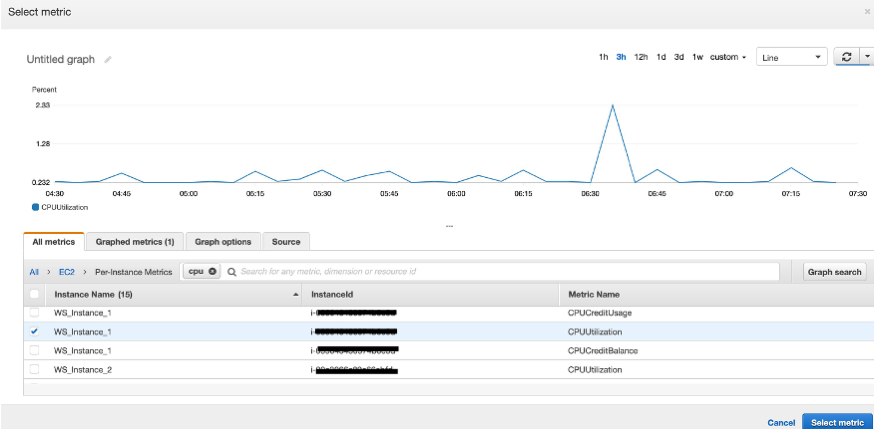
We then specify the conditions that trigger the alarm. The following screen gives us a confirmation of the metric selected, and options to change the statistics and time period. We can base our alarm on the Average, Sum, Max value, Min value, Sample Count, and pNN.NN values. But for our case, we base our alarm on the average value in an evaluation period. Let us change the evaluation period for our alarm to be one minute. Every one minute, CloudWatch averages the CPU utilization and give us a data point. Our alarm is based on value of the data point.

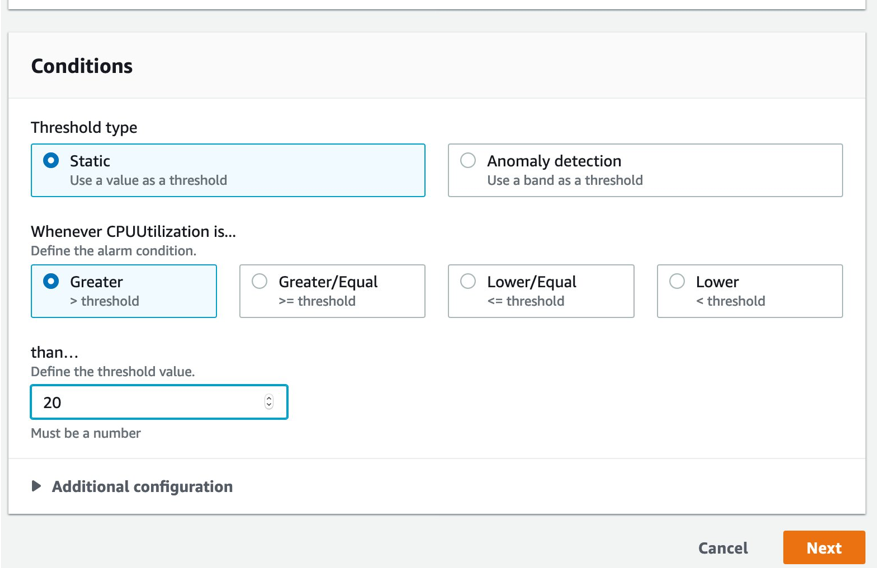
Next, we set the conditions that trigger our alarm, and choose to use a static threshold of 20%. 20% is the baseline performance for T2.small instance. Remember that when CPU utilization is above this value, our instance does not accumulate CPU burst credits.
CloudWatch alarms send notifications when an alarm changes state. In this case, we do not configure notifications because this alarm is used in a composite alarm. The composite alarm notification gives an operator all the information they need from this alarm. In this case, we choose to remove notification options.
We could set other configuration options like AWS Auto Scaling and EC2 actions for our alarm, but we skip that for this example.

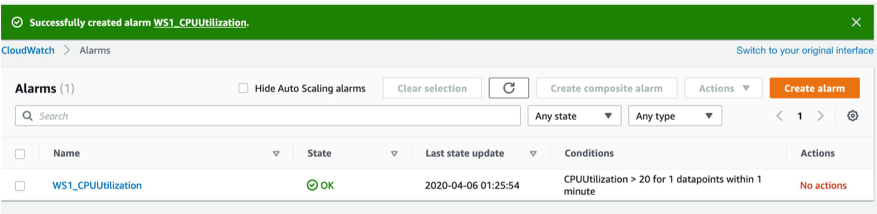
Once we name our alarm and set a description, we get to preview the settings and finally create the alarm.

Step 2. Create a second metric alarm for CPU credits
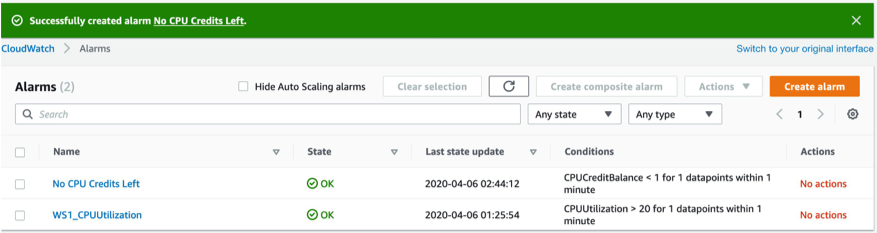
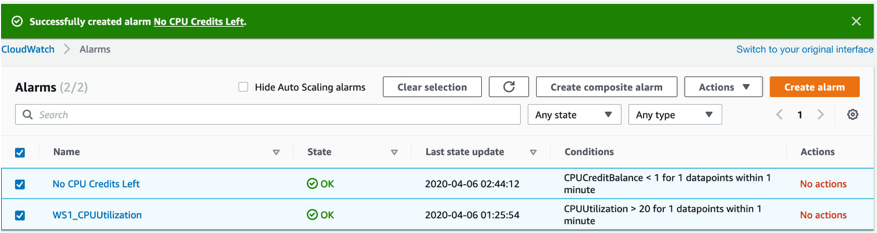
We follow the same steps to create our next alarm and name it “No CPU Credits Left”. This alarm is based on the “CPUCreditBalance” metric and triggers when the CPU Credit balance for our instance goes below one.
Step 3. Create a composite alarm
At this point, we have the two alarms required to create our composite alarm. When we select the two Metric alarms, the “Create composite alarm” button is enabled.
The creation process puts us in the alarm rule editor where we define the logic for our composite alarm. We configure the composite alarm to trigger when both metric alarms are triggered, or go into the “ALARM“ state. The drop down enables us to add more alarms into the expression. A composite alarm hierarchy can include other composite alarms. The default logical operator is “OR”. This can be changed based on the logic for our composite alarm.

Alarm notifications in AWS are delivered via Amazon SNS. For our notifications, I use the “CW_Alarms” topic created as part of the prerequisites of this exercise.

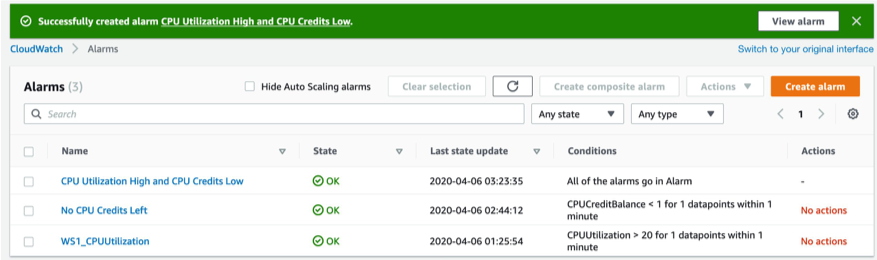
Once we add a name and optional description for our composite alarm, the final step is a preview of the alarm we just created. Finally, we see the list of our alarms, which includes the newly created composite Alarm “CPU Utilization High and CPU Credits Low”.

Step 4. Review the final state of the composite alarm
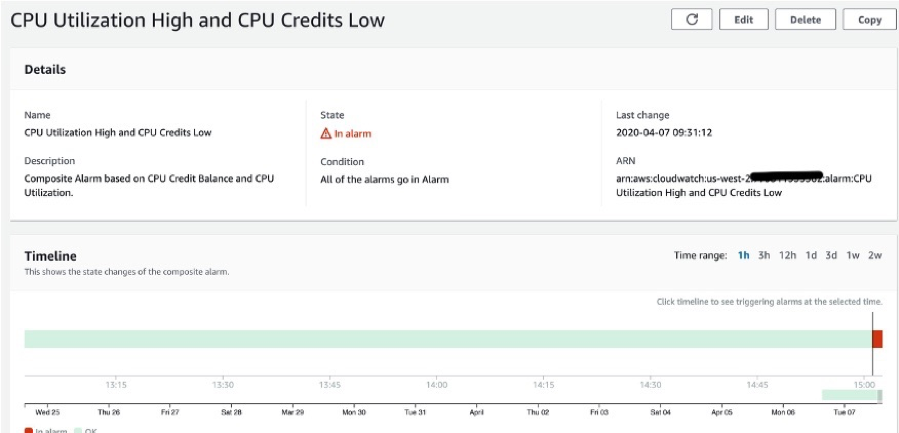
The final state of our alarms is as follows.
The CloudWatch console provides a details page of composite alarms, containing:
- An interactive timeline view that enables us to go back in time and reproduce the state of the underlaying alarms at that point. Zoom capability in the timeline helps narrow down and focus on specific times when alarms were triggered. Timeline helps with troubleshooting, correlating historical alarm state changes, and learning more about the composite alarm behavior.
- Names and states of the child alarms that our composite alarm is dependent on. A composite alarm can be based on other composite alarms, and these are also displayed in the child alarms list.
- Alarm rule used to codify the logic for our composite alarm.
- Actions configured for our composite alarm.
- Parent alarms that are dependent on our composite alarms.
Over time, when the instance conditions are met for the composite alarms to trigger, an email notification is delivered via SNS. We can increase the CPU utilization on the instance by running “cat /dev/zero > /dev/null” from the command line. Use EC2InstanceConnect to SSH to the EC2 instance and run ‘cat /dev/zero > /dev/null’ to increase CPU load to 100%. The CloudWatch console also displays the alarm and the metric conditions that resulted in the composite alarm being triggered. In our case, the CPU Utilization alarm goes into “ALARM” state for a while before the instance ran out of credits. This triggers the “ CPU Credits Low” alarm. Our composite alarm is triggered only when both alarms are in “ALARM” state.

CONCLUSION
In this post, I explained composite alarms in CloudWatch. I also walked you through a use case where you can reduce alarm fatigue by aggregating metric alarms into a composite alarm. Notifications from the composite alarm are informative, actionable, and flexible due to the custom logic you can define in the creation process. I also walked you through available configurations such as alarm actions, building composite alarm logic, and informative views available in the console.
To learn more about how composite alarms are priced visit the CloudWatch pricing documentation.
About the Authors
 Sanjay Bhatia is an Enterprise Support lead for Global Accounts at AWS. Based in the Bay Area, Sanjay works with a global team to help AWS customers operate their workloads efficiently and frugally on AWS. Sanjay has helped a diverse set of customers design and operate a broad variety of workloads using AWS Services. Sanjay has a keen interest in Performance Management solutions.
 Javier Martin is a Senior Product Manager for Amazon CloudWatch. Javier loves building products in AWS that help customers monitoring their systems and applications.