AWS Cloud Operations Blog
Automate CloudWatch Dashboard creation for your AWS Elemental Mediapackage and AWS Elemental Medialive
Introduction
Monitoring the health and performance of your media services is critical to ensuring a seamless viewing experience for your customers. Amazon CloudWatch provides powerful monitoring capabilities for Amazon Web Services (AWS) resources. Setting up comprehensive dashboards can be a time-consuming process, especially for organizations managing large number of resources across multiple regions. The Automatic CloudWatch Dashboard solution is designed to simplify this process by automatically creating customized CloudWatch dashboards based on your tagged resources.
You can use the Automatic CloudWatch Dashboard solution to add the metrics for up to 24 AWS services, including AWS Elemental MediaPackage and AWS Elemental MediaLive.
You can find the full list of the supported services in the “Other Supported Services” section of this blog post.
AWS Elemental MediaLive is a live video processing service that encodes video streams for delivery to broadcast TVs and internet-connected devices. AWS Elemental MediaPackage is a video origination and packaging service that securely and reliably delivers streaming content at scale.
In this blog post, we explore how you can leverage this solution to automatically build CloudWatch metrics for AWS Elemental MediaPackage and AWS Elemental MediaLive.
Prerequisites
- Clone the Automatic CloudWatch Dashboard solution in a local development environment:
- Download Python 3.
- Install Boto 3 Python module
- Download and install Node.js 16+ (18LTS recommended)
- Install AWS Cloud Development Kit version 2:
Before you deploy the Automatic CloudWatch Dashboard Solution, you have to tag the AWS resources you want to include in the Dashboard. To learn more on tagging AWS resources you can refer to the Best Practice for Tagging AWS Resources documentation.
In the next section, you learn how to tag AWS Elemental MediaPackage and AWS Elemental MediaLive resources.
AWS Elemental MediaPackage Tagging
AWS Elemental MediaPackage supports tagging using API and CLI. In the example we use the CLI capability:
aws mediapackage tag-resource --resource-arn <resource-arn> --tags <TagKey=TagValue>
AWS Elemental MediaLive Tagging
AWS Elemental MediaLive supports tagging using AWS Console, API and CLI. In the example we use the AWS Console capability:
1. Navigate to the AWS Elemental MediaLive console
2. Select the channel you want to monitor
3. Under the Tags tab, add the key-value pair. For example:
– Tag Key: ‘event’
– Tag Value: ‘sport_event_streaming’
Note: You can define your own tag key-value pair to be used by the Automatic CloudWatch Dashboard solution.
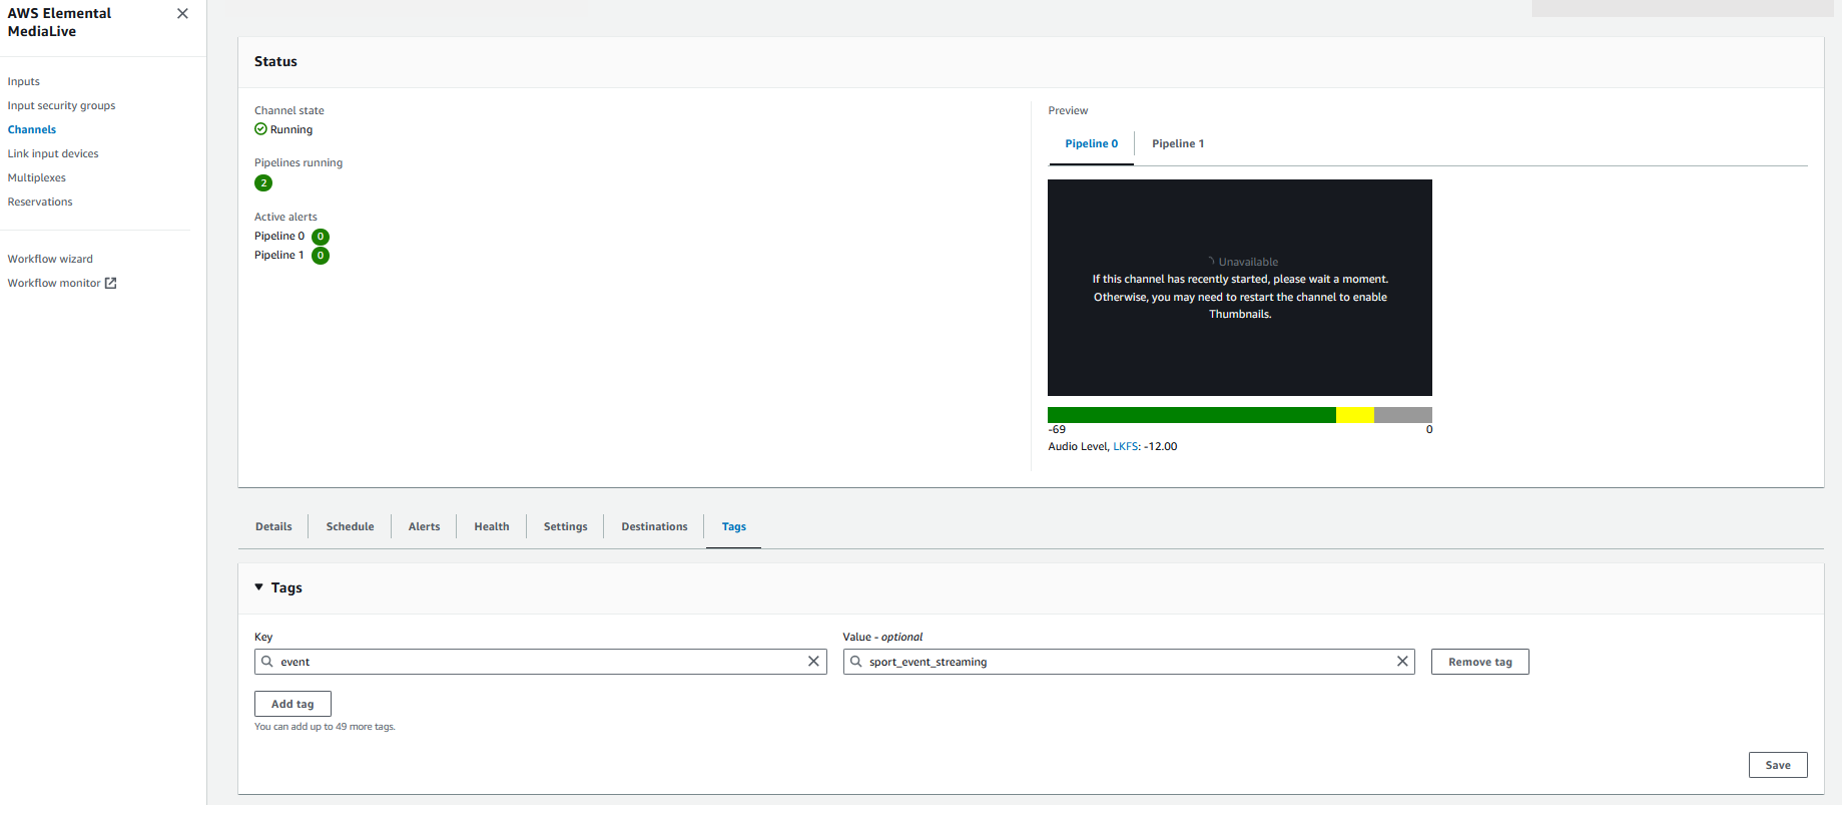
Figure 1: Tagging AWS Elemental MediaLive resources
Architecture Overview
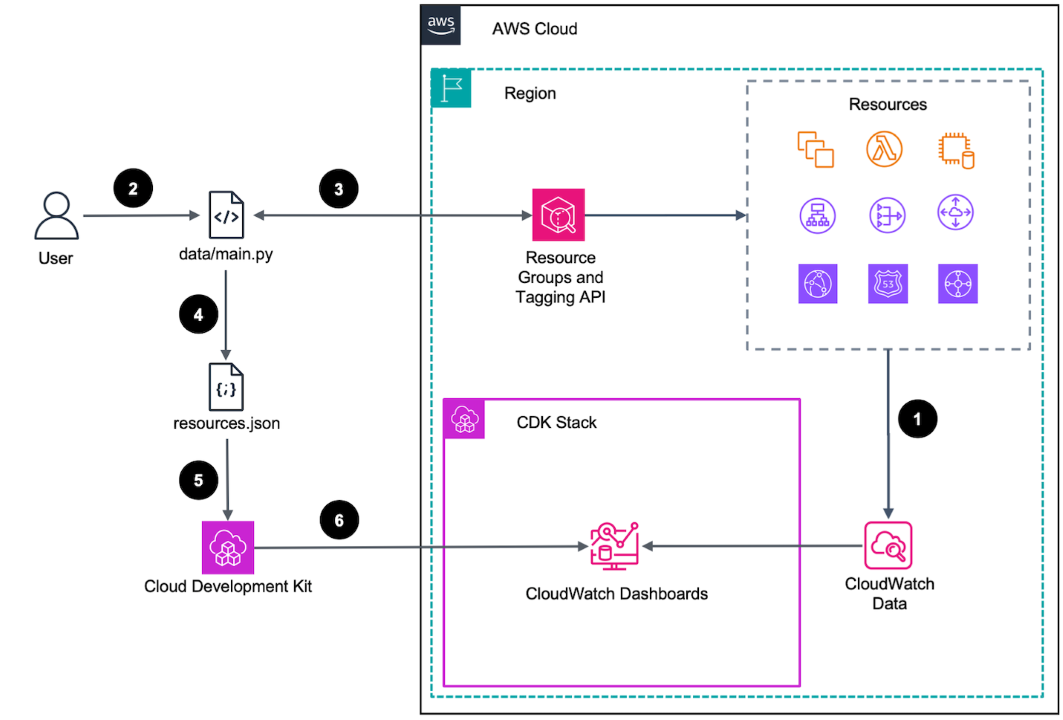
Figure 2: Automatic CloudWatch Dashboard architecture
The workflow works following those steps:
1. A group of AWS resources continuously store metrics in Amazon CloudWatch data store.
2. User initiates ‘data/resource_collector.py’ script
3. The Resource Collector retrieves resource data from Resource Groups and Tagging API and respective AWS Service APIs.
4. The guidance deployment wizard saves resources data in a JSON file.
5. The deployment wizard initiates AWS CDK to synthesize and AWS CloudFormation template. CloudFormation template is based on the discovered resources and AWS monitoring best practices
6. After user confirms, the AWS CDK deploys the synthesized template to CloudWatch
Deploy Automatic CloudWatch Dashboard solution
Follow the deployment instructions in Readme.md file. In this step, you can configure the Automatic CloudWatch Dashboard solution. Update the `lib/config.json` file with your own appropriate tag key, tag values, and regions. The solution will automatically generate and deploy the dashboards, providing you with a centralized view of your media service metrics.
Key Metrics for AWS Media Services
The Automatic CloudWatch Dashboard solution includes the following key metrics for your AWS Elemental MediaPackage and MediaLive services:
AWS Elemental MediaPackage:
- ingressBytes
- ingressResponseTime
- egressResponseTime
- egressBytes
- egressRequestCount
AWS Elemental MediaLive:
- activeAlerts
- networkIn
- networkOut
- inputVideoFrameRate
- inputLossSeconds
- droppedFrames
- output4xxErros
- output5xxErros
- fillMill
For the FilMill, the current length of time (the fill period) during which MediaLive has filled the video output with fill frames. The fill period starts when the pipeline doesn’t receive content from the input within the expected time.
Result
After successfully installing the Automatic CloudWatch Dashboard for Metrics, you see a new dashboard appears in the AWS CloudWatch Dashboards section. The dashboard is named whatever you specified as the BaseName in the lib/config.json configuration file.
AWS Elemental MediaLive and MediaPackage metrics provide insights into your media processing and delivery workflows, enabling you to promptly address any potential issues and maintain a consistent viewing experience for your audience.
AWS Elemental MediaPackage Dashboard
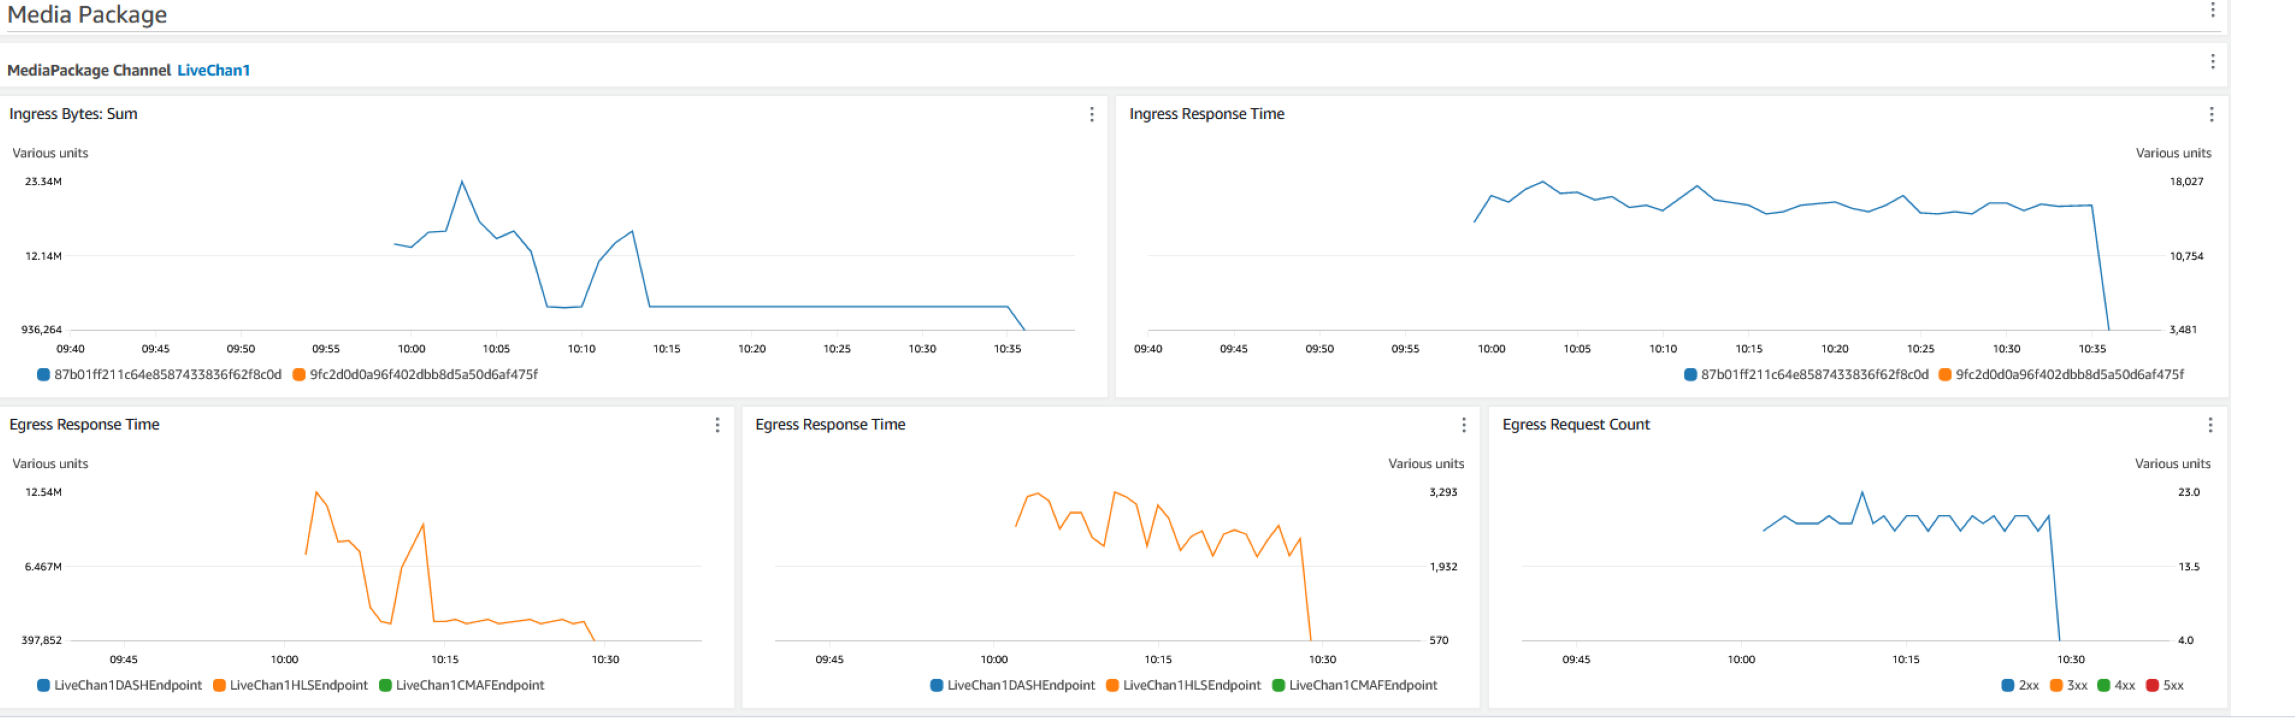
Figure 3: AWS Elemental MediaPackage tagged resources metrics
AWS Elemental MediaLive Dashboard
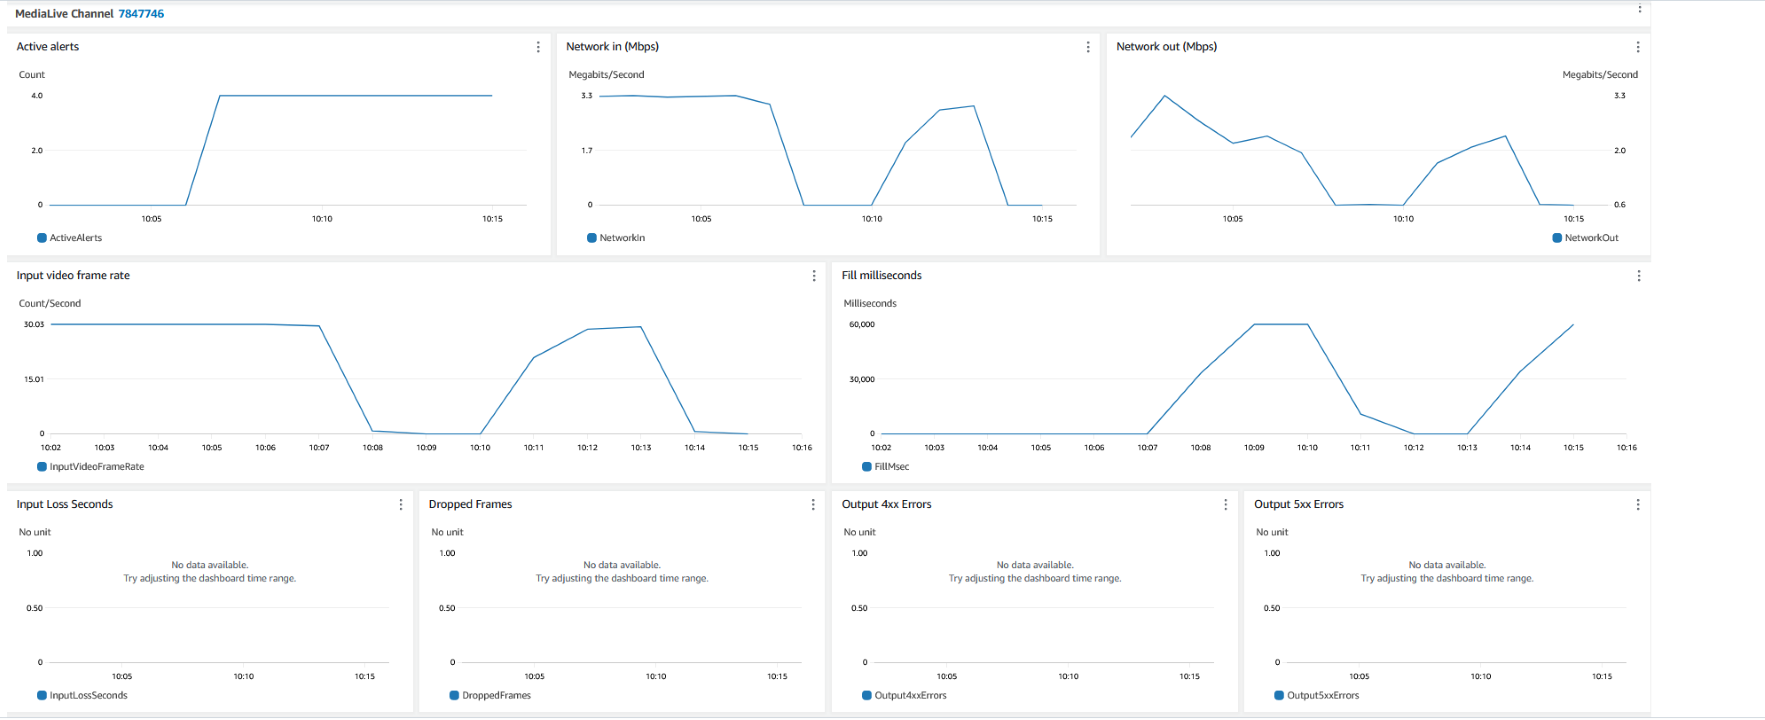
Figure 4: AWS Elemental MediaLive tagged resources metrics
Other Supported Services
The Automatic CloudWatch Dashboard supports up to 24 services and others will be added in the future. The supported services are:
- Amazon API Gateway v1 (REST)
- Amazon API Gateway v2 (HTTP, WebSockets)
- AWS AppSync
- Amazon Aurora
- Auto Scaling groups
- On-Demand Capacity Reservations
- Amazon CloudFront
- Amazon DynamoDB
- Amazon EBS (as part of EC2)
- Amazon EC2 (support for t* burstable instances, support for CloudWatch Agent)
- ELB v1 (ELB Classic)
- ELB v2 (ALB, NLB)
- Amazon ECS (EC2 and Fargate)
- Amazon EFS
- AWS Lambda
- AWS Elemental MediaLive
- AWS Elemental MediaPackage
- NAT Gateway
- Amazon RDS
- Amazon S3
- Amazon SNS
- Amazon SQS
- AWS Transit Gateway
- AWS WAFv2
Costs
Amazon CloudWatch Automatic dashboards are free and you pay only for custom dashboards. You incur dashboard costs from the first hour in which your custom dashboard exists.
3 Custom Dashboards referencing up to 50 metrics each per month are free. When you use Automatic CloudWatch Dashboard solution, you will be charged for the custom Cloudwatch dashboard if you already have 3 custom Dashboards. You can find more details on CloudWatch princing in CloudWatch pricing page.
Cleanup
You can follow the steps to clean up the Automatic CloudWatch Dashboard that you created as part of this blog post. On your terminal,
- Navigate to the project root:
cd tag-based-cloudwatch-dashboard - Run command
cdk destroy [Replace with the Name of the Stack]. Then enter y to confirm.
Conclusion
In this blog, we demonstrated how you can use the Automatic CloudWatch dashboards to automatically build CloudWatch metrics for AWS Elemental MediaPackage and AWS Elemental MediaLive from a central dashboard by leveraging tags. This can help you quickly identify and resolve issues that could impact your critical resources.