AWS Cloud Operations Blog
Monitoring AWS Elastic Beanstalk .NET applications with Amazon CloudWatch and Amazon Managed Grafana
AWS Elastic Beanstalk simplifies deployments by handling many of the architectural complexities involved with managing highly available applications. Elastic Beanstalk provides a monitoring console that displays your environment’s status and application health. However, in large deployments with complex application servers, this often requires supplemental, finer grained monitoring and dynamic dashboards in order to achieve the desired operational insights. Amazon CloudWatch can be utilized to supplement the Elastic Beanstalk enhanced health monitoring, while Amazon Managed Grafana can provide dynamic visualizations for metrics and logs. Amazon Managed Grafana lets you analyze your metrics, logs, and traces without having to provision servers, configure and update software, or do the heavy lifting involved in securing and scaling Grafana in production.
This post provides step-by-step instructions for monitoring your Elastic Beanstalk resources. The solution uses a combination of the Elastic Beanstalk health agent, for enhanced health metrics and common log files, and the CloudWatch agent, for system and process level metrics and custom log files. We also provide instructions for creating Grafana dashboards. For setting up your Amazon Managed Grafana environment in this blog post, check Amazon Managed Grafana – Getting Started.
Overview of solution
Elastic Beanstalk monitors environments by using a built-in health agent and autoscaling health checks. When an application is unhealthy, the instance can be shut down and autoscaling can create a new one. But some complex .NET application servers require lengthy startup times. In addition, many .NET application servers run with multiple application pools on a single instance and require additional monitoring. The CloudWatch agent lets you monitor instance level metrics, such as memory and active server page metrics, as well as process level metrics important for determining application pool health.
Applications may also be deployed across many Elastic Beanstalk environments in order to serve differing customer bases. This, coupled with the ephemeral nature of most Elastic Beanstalk components, means that dynamic dashboards are essential for providing views into the application and environment health. Integrating CloudWatch metrics into Amazon Managed Grafana lets you create custom dashboards that instantly reflect the quickly changing Elastic Beanstalk environments and their resources.
Walkthrough
To implement this solution, complete the following steps. We dive deep into each of these steps in the following sections.
- Configure Elastic Beanstalk enhanced health and log forwarding to CloudWatch.
- Define the system and application specific metrics and log files to collect.
- Create an AWS Identity and Access Management (IAM) policy and role to support the custom CloudWatch configuration. Some formatting is required.
- Update the environment with the new IAM role.
- Create the Application Load Balancer alarm.
- Update and deploy your application source code bundle.
- Review AWS resource tags.
- Update the Grafana dashboard configuration.
- Import the dashboard into Amazon Managed Grafana.
The code for this solution can be found in this GitHub repository. The repository contains Elastic Beanstalk extensions for enabling enhanced health and sending logs to CloudWatch, configuring collection of Elastic Beanstalk health metrics, configuring the CloudWatch agent for metric collection, and creating a CloudWatch alarm. The repository also contains the code for the CloudWatch IAM policy and the Amazon Managed Grafana dashboard.
Prerequisites
For this walkthrough, you should have the following prerequisites in place:
- An AWS account
- Existing Elastic Beanstalk v2 environment
- Existing Amazon Managed Grafana workspace
- Existing Amazon Managed Grafana CloudWatch data source
Configure Elastic Beanstalk enhanced health and log forwarding to CloudWatch
The Elastic Beanstalk enhanced health agent monitors logs and metrics that Elastic Beanstalk utilizes to provide the overall health of the environment and each instance. The settings in the eb_health.config file enable enhanced health and configure the logs to be sent to CloudWatch.
The eb_metrics.config file contains a list of metrics collected by the health agent for the environment and each instance that are commonly sent to CloudWatch. This file should be modified to collect the metrics important to you. A complete list of the available metrics can be found in Elastic Beanstalk CloudWatch custom metrics documentation.
Note the order of precedence that Elastic Beanstalk follows when applying configuration options. Furthermore, if the same configuration option is defined in more than one location, then the setting with the highest precedence is applied. For example, if your environment is already configured for enhanced health, then the metrics defined in the eb_metrics.config will be ignored and instead need to be defined via your existing process, such as AWS CloudFormation, the Elastic Beanstalk console, etc. More information can be found in the Elastic Beanstalk precedence documentation.
Define the system and application specific metrics and log files to collect
In this step, you will specify the operating system, application, and process level metrics as well as the custom log files that must be sent to CloudWatch. The cw_metrics_log.config file contains sample metrics and log files. Make sure to customize this to match your environment, specifically for:
- Namespace
- Metrics
- Application pools
- Windows logs
- Custom logs
In the log files section, a function populates the log group name. This function references one of the standard resource names provided by Elastic Beanstalk. A complete list of these resource names can be found in the Elastic Beanstalk resources documentation.
Note especially that the metrics_collection_interval is specified separately for each metric. In this environment, it can’t be set at the agent level because when Elastic Beanstalk log streaming to CloudWatch is enabled, a CloudWatch agent configuration file is automatically generated with this setting specified at the agent level with a value of 5. Having this setting with two different values at the agent level will result in an error. Therefore, your custom configuration file must be set for each individual metric.
Create an IAM policy and role
In this step, we will create an IAM policy and role to support the custom CloudWatch configuration.
- Navigate to the IAM console and choose Policies in the navigation pane.
- Choose Create policy.
- Choose the JSON tab and replace all of the code with the following JSON policy (cw_metric_policy.json).
- Choose Next: tags, add tags as desired, and choose Next: Review.
- Type a name for the policy and choose Create policy.
Now create a new IAM role and add the new custom policy:
- Navigate to the IAM console and choose Roles in the navigation pane.
- Choose Create role, select AWS service as the trusted entity type, and EC2 as the use case.
- Choose Next: Permissions.
- Type the name of the policy created in the previous step in the filter policies search box. When the policy appears in the list, select the check box next to the policy name.
- Type AWSElasticBeanstalkWebTier in the filter policies search field. When the policy appears in the list, select the check box next to the policy name.
- After selecting the two policies, choose Next: Tags, add tags as desired, and choose Next: Review.
- Enter a name for the IAM role, and choose Create role.
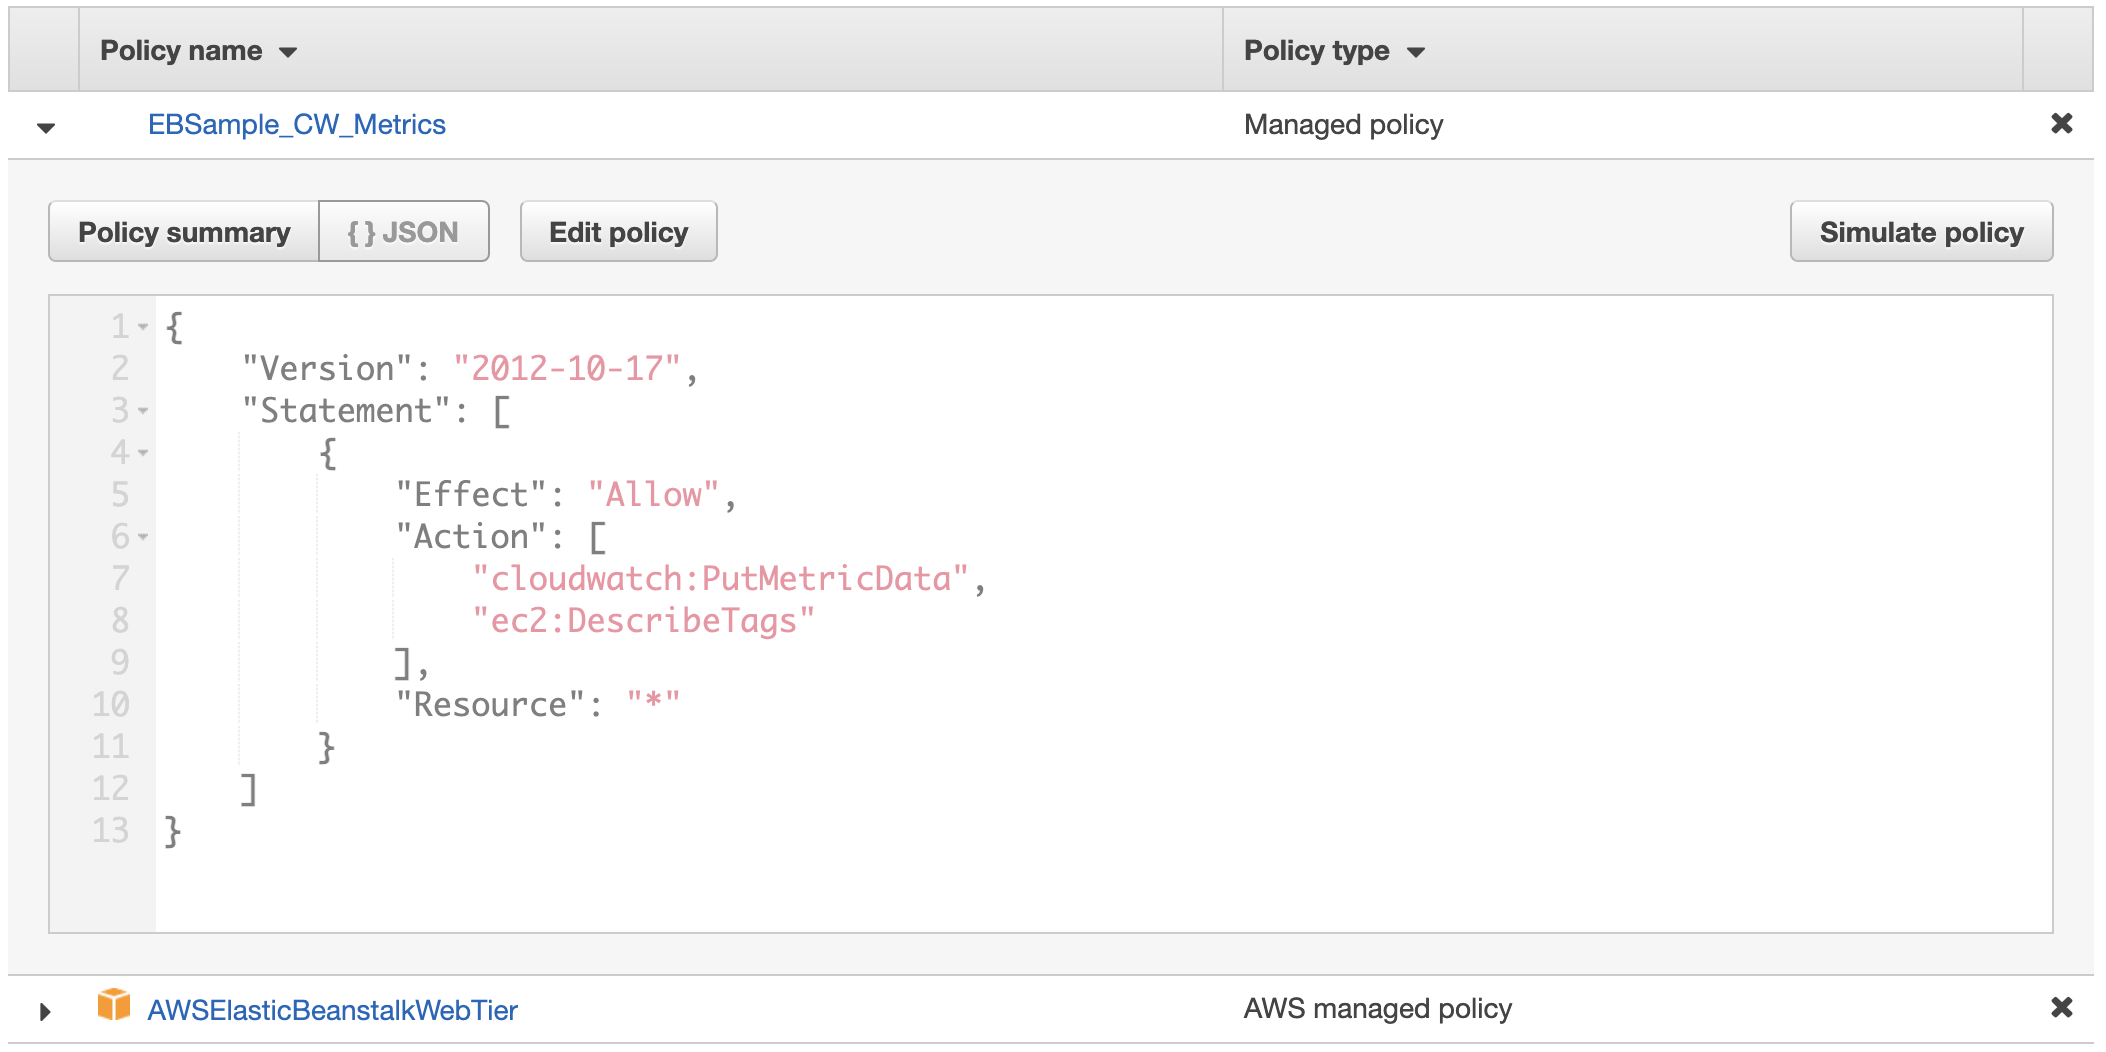
Figure 1: Custom role will contain two policies
Update the environment with the new IAM role
If your Elastic Beanstalk environment was deployed using CloudFormation, your CloudFormation template should be updated to utilize the new IAM role created, and the CloudFormation stack should then be updated. If your CloudFormation template also creates the role and policies, it can be updated to include the policies in the previous step. Alternatively, the Elastic Beanstalk environment can also be updated via the console by following these steps:
- Navigate to the Elastic Beanstalk console, choose Environments in the navigation pane, and then choose the environment name.
- Choose Configuration, and then choose Edit in the security section.
- Under the IAM instance profile, select the new IAM role that was created in the preceding section and choose Apply (Warning: instances will get replaced during deployment).
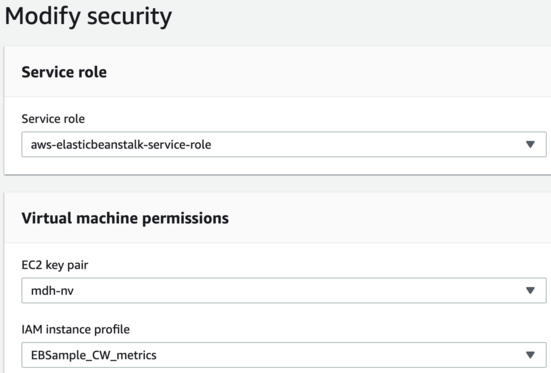
Figure 2: Select the new IAM instance profile, EBSample_CW_Metrics, in the modify security dialog box
- Choose Confirm on the warning message about replacing your instances.
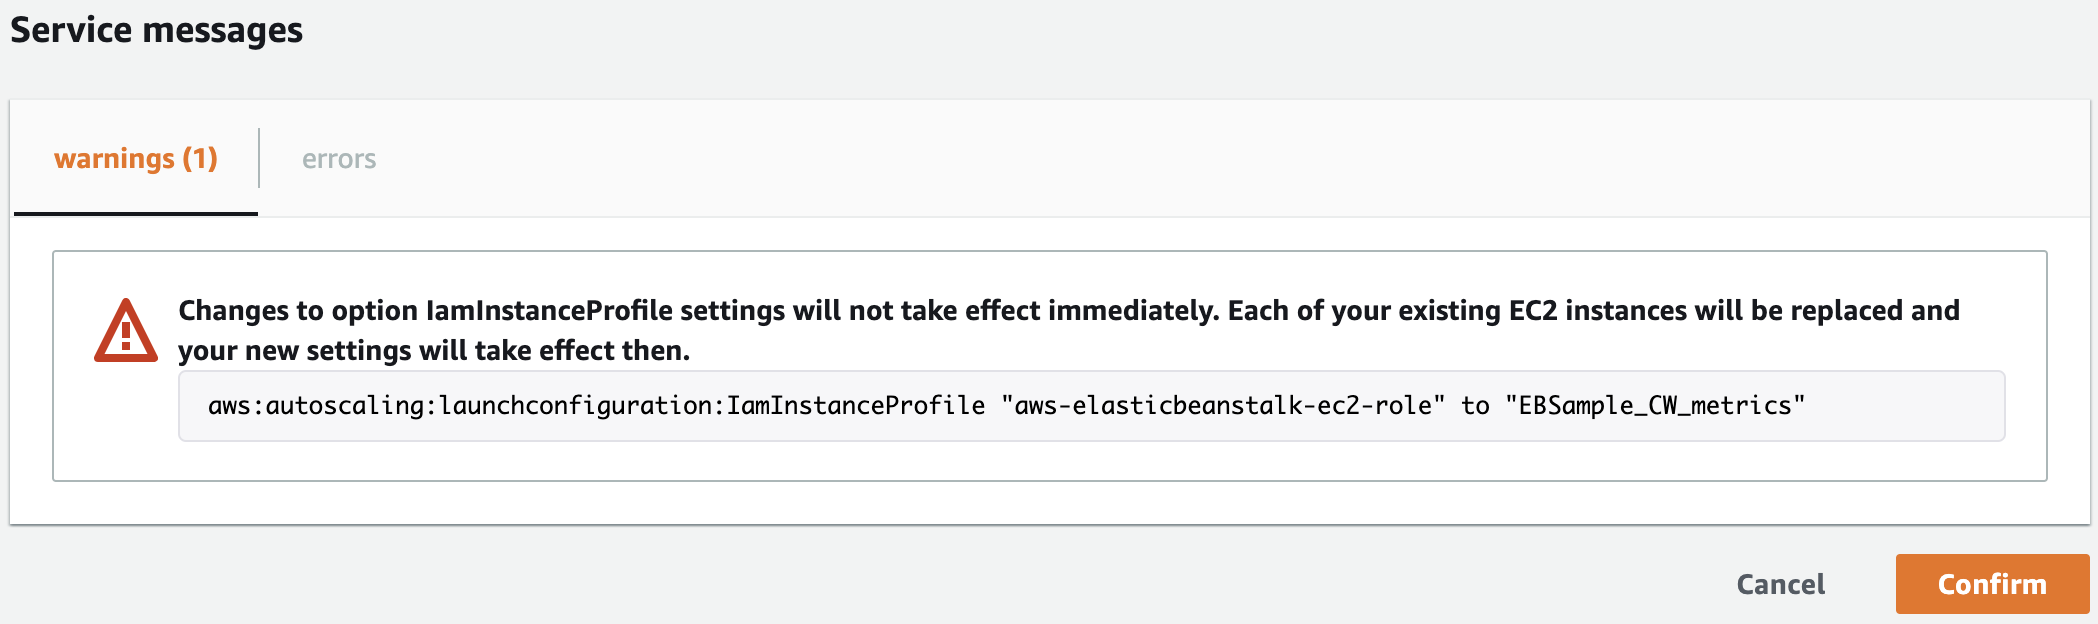
Figure 3: Confirm the change of roles and instance replacement
Create the Application Load Balancer alarm
As mentioned in the preceding section, Elastic Beanstalk resources can be referenced in order to obtain information about them or modify their properties. The cw_alb.config file creates a CloudWatch alarm based on a metric from the Application Load Balancer deployed by Elastic Beanstalk. The CloudFormation code utilizes one of the Elastic Beanstalk supported functions, Fn::GetAtt. Note that the YAML short form syntax is not supported.
Update and deploy your application source code bundle
Unzip your application source code and add a .ebextensions directory. The .ebextensions directory must be created at the top level of the directory structure and contains every previously discussed configuration file. For example:
aspnet.zip
webapi.zip
aws-windows-deployment-manifest.json
.ebextensionseb_logs.config
eb_metrics.config
cw_metrics_log.config
cw_alb.config
Create a new source code bundle by zipping up the directory structure in the preceding list. Then, upload and deploy the new version by following these steps:
- Navigate to the Elastic Beanstalk console, choose Environments in the navigation pane, and then choose the environment name.
- Choose Upload and deploy, choose Choose file, select the zip file you just created, and choose Open.
- Specify a Version label, choose your Deployment Preferences, and choose Deploy (warning: instances will get replaced during deployment).
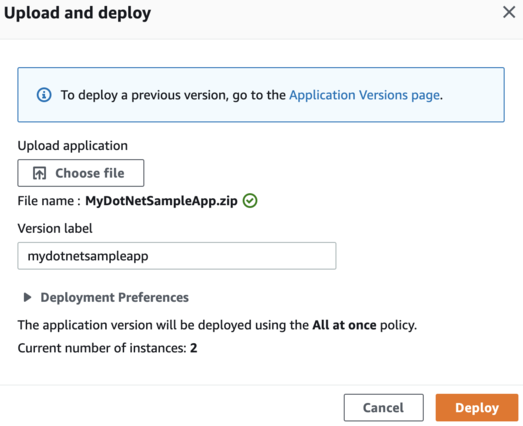
Figure 4: Upload and deploy the new source bundle
Review AWS resource tags
In this step, we will review AWS resource tags and how to utilize them to create dynamic Grafana dashboards. Grafana variables can provide drop-down selections and allow users to change dashboard displays easily. As selections are made, subsequent variables can automatically update their available values, a cascading effect that enables proper filtering. Each variable runs a CloudWatch query that filters values based on AWS resource tags.
For example, the customerid variable returns a list of values for the CustomerID tag from all Amazon Elastic Compute Cloud (Amazon EC2) instances in the Region. Moreover, the env variable returns a list of values for the Env tag from all EC2 instances in the Region with a CustomerID tag equal to the one that was previously selected.
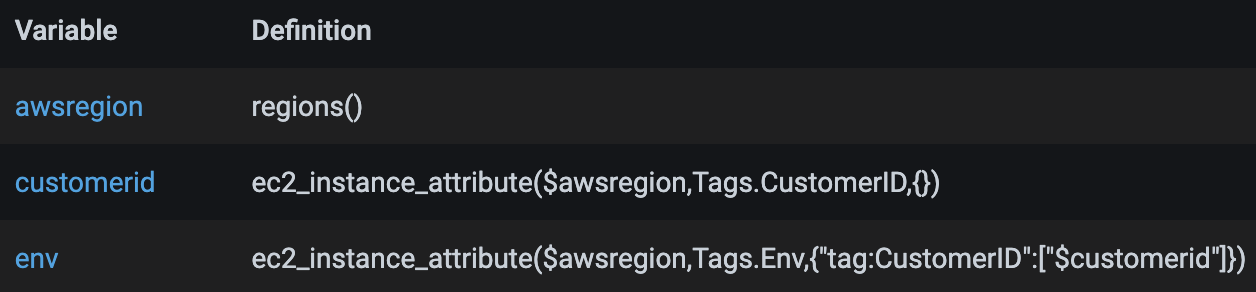
Figure 5: Sample of cascading variables
In order to enable the variables to return the intended data and ultimately render the desired data in the dashboard, a proper resource tagging strategy must be in place. In the sample dashboard, the following tags are used. Your tagging structure will be different, so the tags used within the variables should be modified before import.
- CustomerID
- Env
- AppName
- FSName
The tags enable the dashboard to be changed quickly to show only those resources for a specific customer, environment, and application name. These are useful if you deploy the same Elastic Beanstalk environment for multiple customers and run them across multiple environments. The application name, APPName, and file server name, FSName, are utilized to differentiate between Elastic Beanstalk deployed application servers, as well as servers deployed outside of Elastic Beanstalk but that are associated with the environment. In the sample dashboard, the servers deployed outside of Elastic Beanstalk are shown as file servers.
Update the Grafana dashboard configuration
The grafana_dashboard.json file contains a single dashboard with multiple panels displaying metrics collected by CloudWatch. In this step, the following parameters should be updated based on your environment:
- datasource – replace with your CloudWatch data source name as configured in Grafana
- namespace – update if you modified the namespace defined in the cw_metrics_log.config file
- awsregion – if you use Regions outside of the US, modify the regex accordingly
- variables – update the namespace and tags as necessary
Import the dashboard into Amazon Managed Grafana
In this step, you will create a new Grafana dashboard by importing the grafana_dashboard.json file. To import, conduct the following steps:
- Navigate to the Amazon Managed Grafana console.
- Choose All workspaces in the navigation pane, and then click on the Grafana workspace URL link.
- Once logged into the Grafana workspace, choose + in the navigation pane, then choose Import.
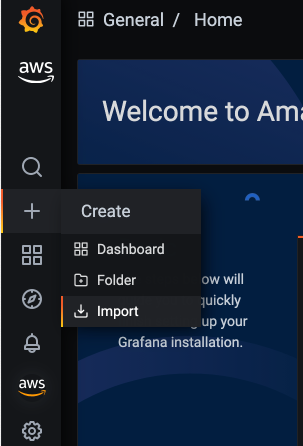
Figure 6: Click Import in the Create menu
- Choose Upload JSON file, select the grafana_dashboard.json file, and then choose Open.
- Specify the dashboard name, select the folder in which to import the dashboard, and choose Import.
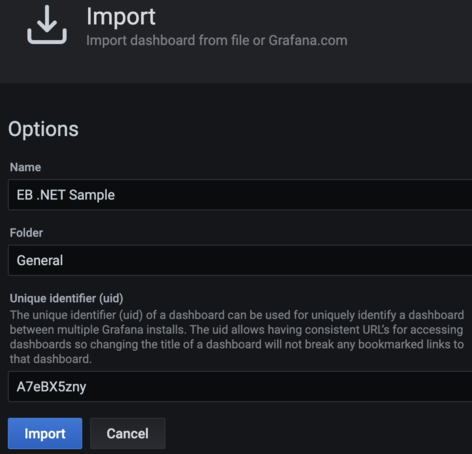
Figure 7: Import the sample dashboard
- Select the values for the five variables at the top of the dashboard in order to display data in the panels, as follows for the EC2 section:
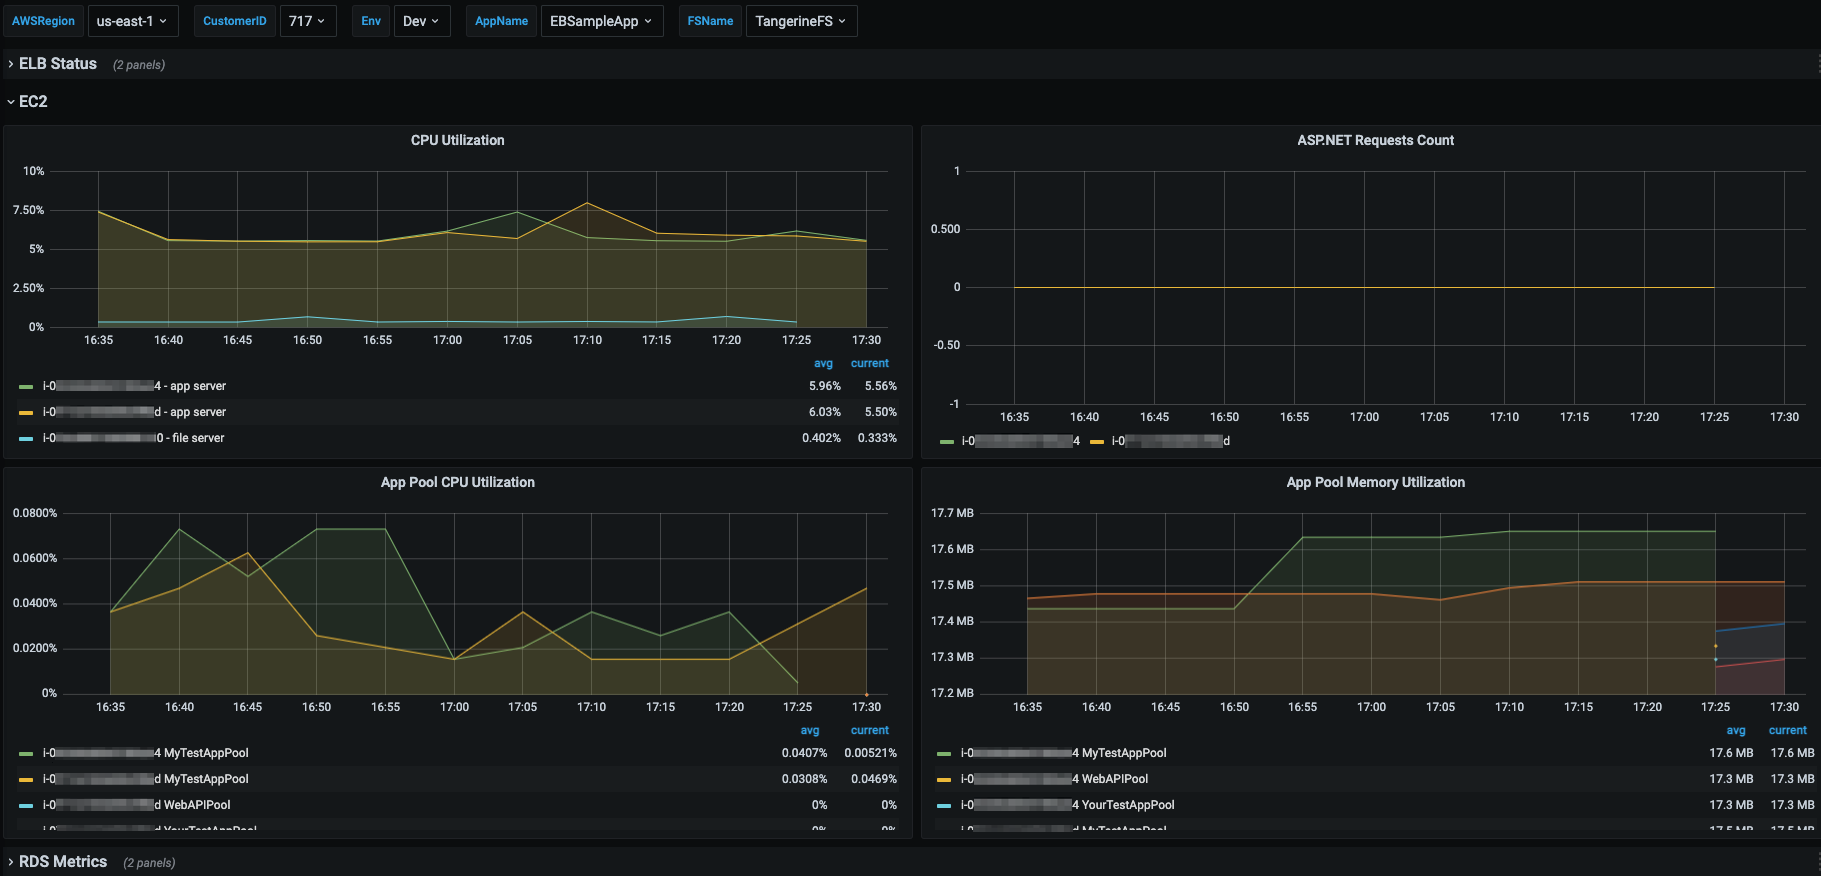
Figure 8: Sample screenshot shows the EC2 panels
Cleaning up
After testing this solution, remember to complete the following steps in order to avoid incurring charges to your AWS account.
Disable CloudWatch metrics and logs
You must disable the forwarding of Elastic Beanstalk enhanced metrics and logs to CloudWatch, remove the custom CloudWatch monitoring configuration, and delete the load balancer alarm. This can be accomplished by conducting the following steps:
- Navigate to the Elastic Beanstalk console, choose Environments, and then choose the environment name.
- Choose Upload and deploy, select Choose file, select your original source bundle zip file, and choose Open.
- Specify a Version label and choose Deploy (warning: instances will get replaced during deployment).
Delete the IAM policy and role
The custom IAM role and policy must be removed from the Elastic Beanstalk environment before they can be deleted. Update your CloudFormation template and update your stack or modify the role through the Elastic Beanstalk console as previously shown. Warning: instances will get replaced when the role is modified.
Next, delete the IAM role by following these steps:
- Navigate to the IAM console and select Roles in the left navigation pane.
- Type your custom role name in the filter roles search box. When the role appears in the list, select the check box next to the role name, and then choose Delete.
- Enter the role name to confirm deletion, and choose Delete.
- Select Policies in the left navigation pane.
- Type your custom policy name in the filter policies search box. When the policy appears in the list, select the check box next to the policy name, choose Actions, and then Delete.
- Enter the policy name to confirm deletion, and choose Delete.
Delete the Grafana dashboard
You also need to delete the imported Grafana dashboard. This is accomplished by conducting the following steps:
- Navigate to your Amazon Managed Grafana workspace, hover over the dashboards icon in the left navigation pane, and then choose Manage.
- Expand the folder in which you imported the Grafana dashboard, and check the box next to the dashboard to be deleted.
- Choose Delete, and then confirm by choosing Delete.
Conclusion
This post demonstrates how to monitor and visualize your Elastic Beanstalk deployed .NET applications by utilizing Elastic Beanstalk provided functionality and custom monitoring and visualization configurations. Within Elastic Beanstalk, we enabled enhanced monitoring and forwarded the enhanced metrics and logs to CloudWatch. Then, we added a custom CloudWatch configuration to the application server instances in order to obtain more granular operating system and process level metrics and custom application log files. Next, an Amazon Managed Grafana dashboard was created to provide dynamic visualization capabilities. Finally, we discussed the importance of a well-defined resource tagging strategy and how tags are utilized to support dynamic dashboards.
The monitoring and visualization capabilities provided in this blog can be further expanded by configuring the CloudWatch agent to collect additional logs and metrics and configuring additional Amazon Managed Grafana data sources to add related data to the dashboard, such as logs from Amazon OpenSearch Service. For more examples of these and other Amazon observability tools, please see the One Observability Workshop.