AWS Big Data Blog
Cost monitoring for Amazon EMR on Amazon EKS
Amazon EMR is the industry-leading cloud big data solution, providing a collection of open-source frameworks such as Spark, Hive, Hudi, and Presto, fully managed and with per-second billing. Amazon EMR on Amazon EKS is a deployment option allowing you to deploy Amazon EMR on the same Amazon Elastic Kubernetes Service (Amazon EKS) clusters that is multi-tenant and used by other applications, improving resource utilization, reducing cost, and simplifying infrastructure management. EMR on EKS provide you up to 5.37 times better performance than OSS Spark v3.3.1 with 76.8% cost savings. It also provides a wide variety of job submission methods, like an AWS API called StartJobRun, or through a declarative way with a Kubernetes controller through the AWS Controllers for Kubernetes for Amazon EMR on EKS.
This consolidation comes with a trade-off of increased difficulty measuring fine-grained costs for showback or chargeback by team or application. According to a CNCF and FinOps Foundation survey, 68% of Kubernetes users either rely on monthly estimates or don’t monitor Kubernetes costs at all. And for respondents reporting active Kubernetes cost monitoring, AWS Cost Explorer and Kubecost were ranked as the most popular tools being used.
Currently, you can distribute costs per tenant using a hard multi-tenancy with separate EKS clusters in dedicated AWS accounts or a soft multi-tenancy using separate node groups in a shared EKS cluster. To reduce costs and improve resource utilization, you can use namespace-based segregation, where nodes are shared across different namespaces. However, calculating and attributing costs to teams by workload or namespaces while taking into account compute optimization (like Saving Plans or Spot Instance cost) and the cost of AWS services like EMR on EKS is a challenging and non-trivial task.
In this post, we present a cost chargeback solution for EMR on EKS that combines the AWS-native capabilities of AWS Cost and Usage Reports (AWS CUR) alongside the in-depth Kubernetes cost visibility and insights using Kubecost on Amazon EKS.
Solution overview
A job in EMR on EKS incur costs mainly on two dimensions: compute resources and a marginal uplift charge for EMR on EKS usage. To track the cost associated with each of the dimensions, we use data from three sources:
- AWS CUR – We use this to get the EMR on EKS cost uplift per job and for Kubecost to reconcile the compute cost with any saving plans or reserved instance used. The supporting infrastructure for CUR is deployed as defined in Setting up Athena using AWS CloudFormation templates.
- Kubecost – We use this to get the compute cost incurred by the executor and driver pods.
The cost allocation process includes the following components:
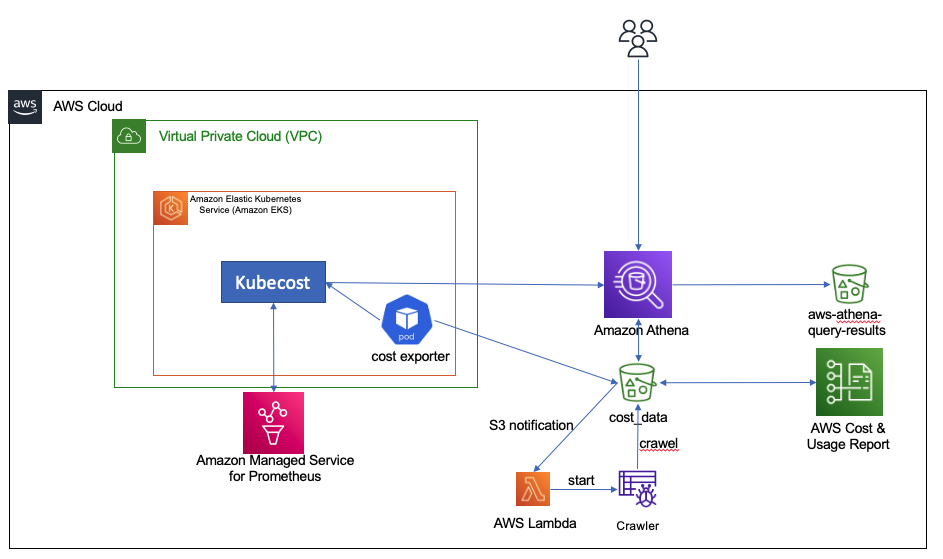
- The compute cost is provided by Kubecost. However, in order to do an in-depth analysis, we define an hourly Kubernetes CronJob on it that starts a pod to retrieve data from Kubecost and stores it in Amazon Simple Storage Service (Amazon S3).
- CUR files are stored in an S3 bucket.
- We use Amazon Athena to create a view and provide a consolidated view of the total cost to run an EMR on EKS job.
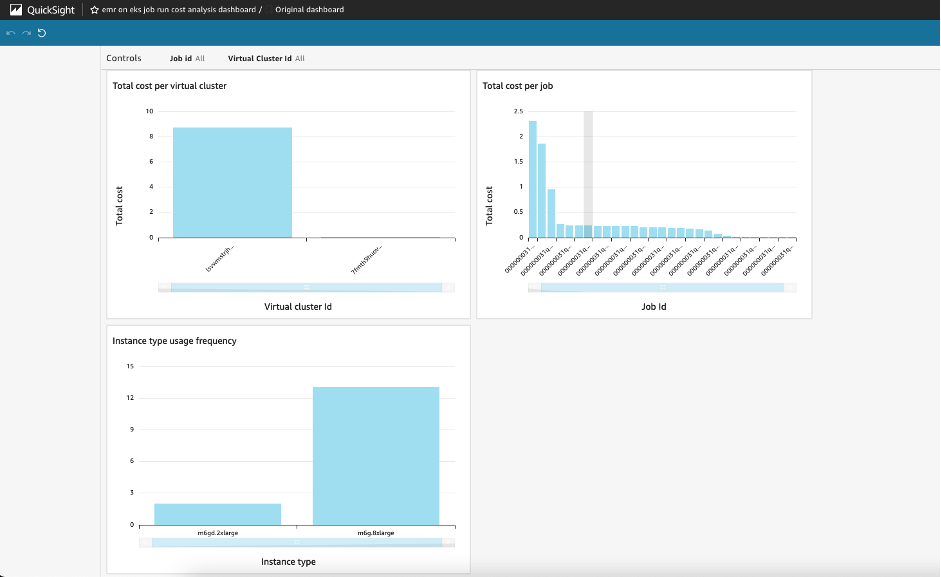
- Finally, you can connect your preferred business intelligence tools using the JDBC or ODBC connections to Athena. In this post, we use Amazon QuickSight native integration for visualization purposes.
The following diagram shows the overall architecture as well as how the different components interact with each other.

We provide a shell script to deploy our the tracking solution. The shell script configures the infrastructure using an AWS CloudFormation template, the AWS Command Line Interface (AWS CLI), and eksctl and kubectl commands. This script runs the following actions:
- Start the CloudFormation deployment.
- Create and configure an AWS Cost and Usage Report.
- Configure and deploy Kubecost backed by Amazon Managed Service for Prometheus.
- Deploy a Kubernetes CronJob.
Prerequisites
You need the following prerequisites:
- The following tools installed: Helm 3.9+, kubectl, and eksctl
- Docker
- An EKS cluster with the Amazon EBS CSI driver deployed
- Your EKS cluster enabled to use AWS Identity and Access Management (IAM) roles for service accounts
This post assumes you already have an EKS cluster and run EMR on EKS jobs. If you don’t have an EKS cluster ready to test the solution, we suggest starting with a standard EMR on EKS blueprint that configures a cluster to submit EMR on EKS jobs.
Set up the solution
To run the shell script, complete the following steps:
- Clone the following GitHub repository.
- Go to the folder
cost-trackingwith the following command:
cd cost-tracking
- Run the script with following command :
sh deploy-emr-eks-cost-tracking.sh REGION KUBECOST-VERSION EKS-CLUSTER-NAME ACCOUNT-ID
After you run the script, you’re ready to use Kubecost and the CUR data to understand the cost associated with your EMR on EKS jobs.
Tracking cost
In this section, we show you how to analyze the compute cost that is retrieved from Kubecost, how to query EMR on EKS uplift data, and how to combine them to have a single consolidated view for the cost.
Compute cost
Kubecost offers various ways to track cost per Kubernetes object. For example, you can track cost by pod, controller, job, label, or deployment. It also allows you to understand the cost of idle resources, like Amazon Elastic Compute Cloud (Amazon EC2) instances that aren’t fully utilized by pods. In this post, we assume that no nodes are provisioned if no EMR on EKS job is running, and we use the Karpenter Cluster Autoscaler to provision nodes when jobs are submitted. Karpenter also does bin packing, which optimizes the EC2 resource utilization and in turn reduces the cost of idle resources.
To track compute cost associated with EMR on EKS pods, we query the Kubecost allocation API by passing pod and labels in the aggregate parameter. We use the emr-containers.amazonaws.com/job.id and emr-containers.amazonaws.com/virtual-cluster-id labels that are always present in executor and driver pods. The labels are used to filter Kubecost data to get only the cost associated with EMR on EKS pods. You can review various levels of granularity at the pod, job, and virtual cluster level to understand the cost of a driver vs. executor, or of using Spot Instances in jobs. You can also use the virtual cluster cost to understand the overall cost of a EMR on EMR when it’s used in a namespace that is used by applications other than EMR on EKS.
We also provide the instance_id, instance size, and capacity type (On-Demand or Spot) that was used to run the pod. This is retrieved through querying the Kubecost assets API. This data can be useful to understand how you run your jobs and which capacity you use more often.
The data about the cost of running the pods as well as the assets is retrieved with a Kubernetes CronJob that submits the request to the Kubecost API, joins the two data sources (allocation and assets data) on the instance_id, cleans the data, and stores it in Amazon S3 in CSV format.
The compute cost data has multiple fields that are of interest, including cpucost, ramcost (cost of memory), pvcost (cost of Amazon EBS storage), efficiency of use of CPU and RAM, as well as total cost, which represents the aggregate cost of all the resources used, either at pod, job, or virtual cluster level.
To view this data, complete the following steps:
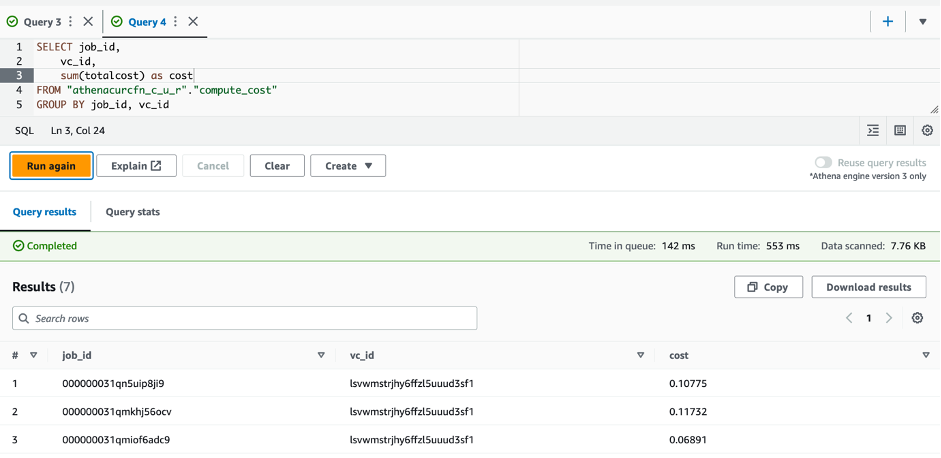
- On the Athena console, navigate to the query editor.
- Choose
athenacurcfn_c_u_rfor the database andcost_datafor the table. - Run the following query:
The following screenshot shows the query results.

To query the data about information at the pod level, you can run the following SQL statement:
EMR on EKS uplift
The cost associated with EMR on EKS uplift is available through AWS CUT and is stored in an S3 bucket. The script you ran in the setup step created an Athena table associated to the data in the S3 bucket. The following steps take you through how you can query the data:
- On the Athena console, navigate to the query editor.
- Choose
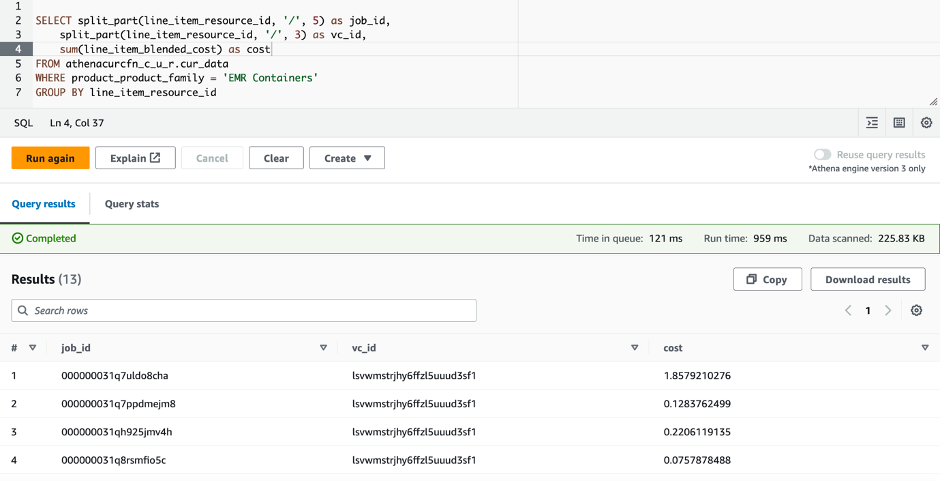
athenacurcfn_c_u_rfor the database andcur_datafor the table. - Run the following query:
This query provides you with the cost per job. The following screenshot shows the results.

You will have to wait up to 24 hours for the CUR data to be available. As such, you should only run the preceding query after the CUR data is available and you have run the EMR on EKS jobs.
Overall cost
To view the overall cost and perform analysis on it, create a view in Athena as follows:
Now that the view is created, you can query and analyze the cost of running your EMR on EKS jobs:
The following screenshot shows an example output of the query on the created view.

Lastly, you can use QuickSight for a graphical high-level view on your EMR on EKS spend. The following screenshot shows an example dashboard.

You can now adapt this solution to your specific needs and build your custom analysis.
Clean up
Throughout this post, you deployed and configured the required infrastructure components to track cost for your EMR on EKS workloads. To avoid incurring additional charges for this solution, delete all the resources you created:
- Empty the S3 buckets
cost-data-REGION-ACCOUNT_IDandaws-athena-query-results-cur-REGION-ACCOUNT_ID. - Delete the Athena workgroup
kubecost-cur-workgroup. - Empty and delete the ECR repository
emreks-compute-cost-exporter. - Run the script destroy-emr-eks-cost-tracking.sh, which will delete the AWS CloudFormation deployment, uninstall Kubecost, delete the CronJob, and delete the Cost and Usage Reports.
Conclusion
In this post, we showed how you can use Kubecost capabilities alongside Cost and Usage Reports to closely monitor the costs for Amazon EMR on EKS per virtual cluster or per job. This solution allows you to achieve more granular costs for chargebacks using Athena, Amazon Managed Service for Prometheus, and QuickSight.
The solution presented steps to set up Cost and Usage Reports and Kubecost, and configure a CronJob on an hourly basis to get the cost of running pods spun by EMR on EKS. You can modify the presented solution to run at longer intervals or to collect data on different EKS clusters. You can also modify the Python script run by the CronJob to further clean data or reduce the amount of data stored by eliminating fields you don’t need. You can use the insights provided to drive cost optimization efforts over time, detect any increase of costs, and measure the impact of new deployments or particular events on resource usage and cost performance. For more information about integrating EMR on EKS in your existing Amazon EKS deployment, refer to Design considerations for Amazon EMR on EKS in a multi-tenant Amazon EKS environment
About the Authors
 Lotfi Mouhib is a Senior Solutions Architect working for the Public Sector team with Amazon Web Services. He helps public sector customers across EMEA realize their ideas, build new services, and innovate for citizens. In his spare time, Lotfi enjoys cycling and running.
 Hamza Mimi Principal Solutions Architect in the French Public sector team at Amazon Web Services (AWS). With a long experience in the telecommunications industry. He is currently working as a customer advisor on topics ranging from digital transformation to architectural guidance.
