AWS Cloud Operations & Migrations Blog

Viewing Amazon CloudWatch metrics with Amazon Managed Service for Prometheus and Amazon Managed Grafana

Monitoring AWS services comprising of a customer workload with Amazon CloudWatch is important for resiliency of a workload. Customers can bring their CloudWatch data alongside their existing Prometheus data sources to improve their ability to join or query across for a holistic view of their systems. The Amazon Managed Service for Prometheus is a serverless monitoring service for metrics compatible with open-source Prometheus. Amazon Managed Grafana is a fully managed service with rich, interactive data visualizations to help customers analyze, monitor, and alarm on metrics, logs, and traces across multiple data sources.

Typically, an application deployment depends on external resources for provision infrastructure components, such as Elastic Load Balancing (ELB). The metrics from these components are collected in CloudWatch. For the overall visibility into the performance of an application, metrics for these external resources must be analysed. This post describes how customers and partners can ingest CloudWatch metrics for AWS Application Load Balancer (ALB) with Amazon Managed Service for Prometheus and visualize the same with Amazon Managed Grafana.

Using Amazon Managed Service for Prometheus helps ingest metrics with a single query language and options to rewrite, replace, or include only some of the metrics. Note that Amazon Managed Grafana supports CloudWatch as a data source. Therefore, when designing a monitoring solution, you must decide between using Amazon Managed Grafana only to save costs. Or, add Amazon Managed Service for Prometheus for metrics manipulation.

Time to read 6 minutes
Time to complete 15 minutes
Cost to complete (estimated) $30 (at publication time)
Learning level Intermediate (200)
Services used

Amazon Elastic Compute Cloud (Amazon EC2)

Elastic Load Balancing (ELB)

CloudWatch

Amazon Managed Service for Prometheus

Amazon Managed Grafana

Solution overview

As shown in the following figure, this post will use three Amazon Elastic Compute Cloud (Amazon EC2) instances in three different Availability Zones, where two instances will be behind an ALB with metrics getting published to CloudWatch. The third EC2 instance will run yet-another-cloudwatch-exporter (yace)  to make CloudWatch metrics available in the Prometheus format. These metrics are scraped using AWS Distro for OpenTelemetry (ADOT) collector and written remotely in to Amazon Managed Service for Prometheus. The ADOT collector will run on the third EC2 instance.

Note that yace is an open-source project that is not maintained by AWS. This post utilizes this open-source project as is. It’s highly recommended that you consider using this tooling and perform necessary security and performance validations before deploying to your environment.

Architecture diagram showing EC2 instances behind an ALB and another EC2 instance running ADOT Collector to scrape metrics from yace for Amazon CloudWatch metrics. These metrics are consumed in Amazon Managed Service for Prometheus and visualised in Amazon Managed Grafana.

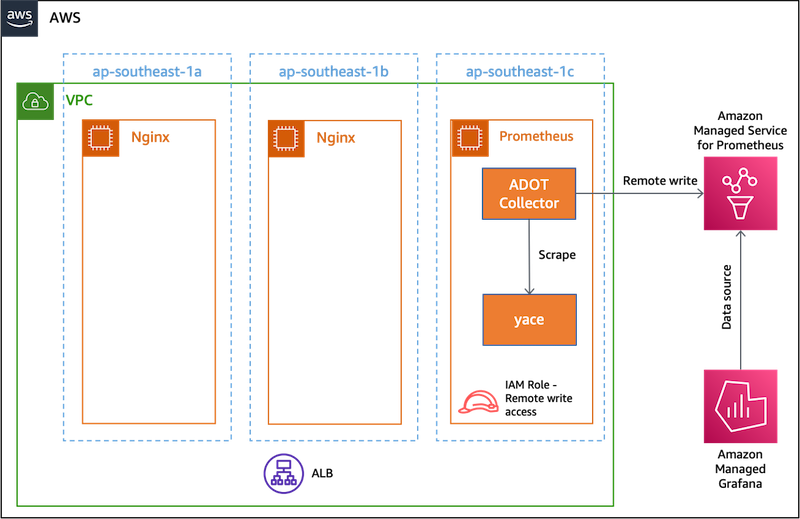
Figure 1 Flow for CloudWatch metrics into Amazon Managed Service for Prometheus and Amazon Managed Grafana

The EC2 instance that runs the ADOT Collector will be configured with an AWS Identity and Access Management (IAM) Role that has the AmazonPrometheusRemoteWriteAccess policy. This policy enables you to remotely write metrics to Amazon Managed Service for Prometheus workspace. The Amazon Managed Grafana workspace is configured to use the Amazon Managed Service for Prometheus as the data source. The Amazon Managed Grafana workspace will have dashboards to display the metrics.

Walkthrough

Following is the overview of the solution to be implemented in this demonstration:

  1. Install Nginxon EC2 instances.
  2. Create and configure ALB.
  3.  Install yace on the third EC2 instance.
  4. Create the  Amazon Managed Service for Prometheus workspace.
  5. Install ADOT Collector on the third EC2 instance.
  6. Configure ADOT collector to remote write metrics to Amazon Managed Service for Prometheus workspace.
  7. Launch the Amazon Managed Grafana workspace.
  8. Launch the dashboard in Amazon Managed Grafana by importing an existing dashboard as JSON to view metrics.

Prerequisites

You will need the following to complete the steps in this post:

  • An AWS account
  • Create EC2 instance with Ubuntu Linux distribution. You should create three such instances in three different availability zones of the default VPC. Name the first two of these EC2 instances with nginx-1 and nginx-2 respectively. The third one may be named prometheus.
  • AWS Command Line Interface (AWS CLI) installed on your local environment.
  •  hey tool installed on your local environment.

Install Nginx

Select the EC2 instances named nginx-1 and nginx-2 respectively. Follow these instructions to install Nginx:

  1. Connect to your Linux instance using Session Manager.
  2. Run the following commands:
sudo apt update
sudo apt install -y nginx
sudo ufw allow 'Nginx HTTP'

Create and configure ALB

On your local environment, run the following commands to create an ALB with a target group pointing to the Nginx instances:

# Get default VPC
DEFAULT_VPC_ID=`aws ec2 describe-vpcs --filters Name=is-default,Values=true --query "Vpcs[0].VpcId" --output text`
# Get subnets of AZ in default VPC – change availability zone accordingly
VPC_SUBNETS=(`aws ec2 describe-subnets --filter Name=vpc-id,Values=${DEFAULT_VPC_ID} Name=availability-zone,Values=ap-southeast-1a,ap-southeast-1b --query "Subnets[*].SubnetId" --output text`)
# Create security group for ALB
ALB_SEC_GRP=`aws ec2 create-security-group --description 'Security group for ALB' --group-name alb-nginx --vpc-id ${DEFAULT_VPC_ID} --query "GroupId" --output text`
# Add incoming rule for ALB
MY_IP=`curl -s http://checkip.amazonaws.com/`
aws ec2 authorize-security-group-ingress --group-name alb-nginx --protocol tcp --port 80 --cidr ${MY_IP}/32
# Create ALB
ALB_ARN=`aws elbv2 create-load-balancer --name nginx --subnets ${VPC_SUBNETS} --security-groups ${ALB_SEC_GRP} --query "LoadBalancers[0].LoadBalancerArn" --output text`
ALB_DNS=`aws elbv2 describe-load-balancers --name nginx --query "LoadBalancers[0].DNSName" --output text`
# Add target group to ALB
ALB_TARGET_GRP_ARN=`aws elbv2 create-target-group --name nginx --protocol HTTP --port 80 --vpc-id ${DEFAULT_VPC_ID} --query "TargetGroups[0].TargetGroupArn" --output text`
# Get EC2 instance IDs
EC2_ID_1=`aws ec2 describe-instances --filters Name=tag:Name,Values=nginx-1 --query "Reservations[0].Instances[0].InstanceId" --output text`
EC2_ID_2=`aws ec2 describe-instances --filters Name=tag:Name,Values=nginx-2 --query "Reservations[0].Instances[0].InstanceId" --output text`
# Configure security group for EC2 instances
aws elbv2 register-targets --target-group-arn ${ALB_TARGET_GRP_ARN} --targets Id=${EC2_ID_1} Id=${EC2_ID_2}
aws elbv2 create-listener --load-balancer-arn ${ALB_ARN} --protocol HTTP --port 80 --default-actions Type=forward,TargetGroupArn=${ALB_TARGET_GRP_ARN}

Configure Nginx instances to receive traffic from ALB

Run the following commands to configure Nginx on EC2 instances to receive traffic from ALB. These commands should be run from the same shell where you ran the the previous set of commands for creating ALB:

# Configure security group for EC2 instances
EC2_SEC_GRP=`aws ec2 create-security-group --description 'Security group for EC2' --group-name alb-ec2 --vpc-id ${DEFAULT_VPC_ID} --query "GroupId" --output text`
aws ec2 authorize-security-group-ingress --group-name alb-ec2 --protocol tcp --port 80 --source-group ${ALB_SEC_GRP}
aws ec2 modify-instance-attribute --groups ${EC2_SEC_GRP} --instance-id ${EC2_ID_1}
aws ec2 modify-instance-attribute --groups ${EC2_SEC_GRP} --instance-id ${EC2_ID_2}

Download yace

The GitHub project for yace has numerous binaries in its release page. Since this post uses Ubuntu as the operating system, the x86_64 binary will be used. Select the EC2 instance named prometheus and run the following commands:

  1. Connect to your Linux instance using Session Manager.
  2. Run the following commands:
YACE_VERSION= 0.35.0-alpha
wget https://github.com/nerdswords/yet-another-cloudwatch-exporter/releases/download/v${YACE_VERSION}/yet-another-cloudwatch-exporter_${YACE_VERSION}_Linux_x86_64.tar.gz
tar -xvzf yet-another-cloudwatch-exporter_${YACE_VERSION}_Linux_x86_64.tar.gz

Configure yace

  1. Copy the following configuration into yace-config.yaml
  2.  Change the following in the configuration file appropriately:
    1. regions: For this post, since only one ALB must be monitored, enter one value for the region where the ALB is being run. This file uses ap-southeast-1 as an example.
    2. dimensions.value: This is the last portion of the ALB ARN.
apiVersion: v1alpha1
static:
  - namespace: AWS/ApplicationELB
    name: nginx
    regions:
      - ap-southeast-1
    dimensions:
      - name: LoadBalancer
        value: app/nginx/c2a34d2be890f02f
    metrics:
      - name: RequestCount
        statistics:
          - Average
        period: 600
        length: 600
      - name: ActiveConnectionCount
        statistics:
          - Average
        period: 600
        length: 600
      - name: ConsumedLCUs
        statistics:
          - Average
        period: 600
        length: 600
      - name: NewConnectionCount
        statistics:
          - Average
        period: 600
        length: 600
      - name: TargetResponseTime
        statistics:
          - Average
        period: 600
        length: 600
      - name: UnHealthyHostCount
        statistics:
          - Average
        period: 600
        length: 600

For complete details on the configuration file, see the GitHub page.

Launch yace

  1. Launch yace with the following command to scrape Amazon CloudWatch metrics every 10 seconds and expose a Prometheus metrics end-point at port 9102.
./yace --config.file yace-config.yaml --scraping-interval 10 --listen-address :9102

Launch Amazon Managed Service for Prometheus workspace

  1. Create the Amazon Managed Service for Prometheus workspace.
  2. Copy the workspace ID of the created workspace to use in the section for configuring the Prometheus server.
  3. Copy the following into yace-cw-policy.json
{
  "Version": "2012-10-17",
  "Statement": [
    {
      "Sid": "VisualEditor0",
      "Effect": "Allow",
      "Action": [
          "cloudwatch:GetMetricData",
          "cloudwatch:GetMetricStatistics",
          "cloudwatch:ListMetrics"
      ],
      "Resource": "*"
    }
  ]
}
  1. Copy the following into ec2-instance-profile.json
{
  "Version": "2012-10-17",
  "Statement": [
    {
      "Effect": "Allow",
      "Action": [
          "sts:AssumeRole"
      ],
    "Principal": {
        "Service": [
            "ec2.amazonaws.com"
        ]
      }
    }
  ]
}
  1. Create an EC2 instance profile with AmazonPrometheusRemoteWriteAccess and a custom policy to read Amazon CloudWatch metrics using the following commands:
ACCOUNT_ID=`aws sts get-caller-identity --query 'Account' --output text`
PROMETHEUS_POLICY_ARN=arn:aws:iam::${ACCOUNT_ID}:policy/AWSManagedPrometheusWriteAccessPolicy
CW_POLICY_ARN=`aws iam create-policy --policy-name yace-cw-policy --policy-document file://yace-cw-policy.json --query 'Policy.Arn' --output text`
aws iam create-role --role-name cw-prometheus-role --assume-role-policy-document file://ec2-instance-profile.json --query 'Role.Arn' --output text
aws iam attach-role-policy --role-name cw-prometheus-role --policy-arn ${PROMETHEUS_POLICY_ARN}
aws iam attach-role-policy --role-name cw-prometheus-role --policy-arn ${CW_POLICY_ARN}
aws iam create-instance-profile --instance-profile-name cw-prometheus-ec2-instance-profile --query 'InstanceProfile.Arn' --output text
aws iam add-role-to-instance-profile --instance-profile-name cw-prometheus-ec2-instance-profile --role-name cw-prometheus-role

Install ADOT Collector

  1. Open a new terminal window and log in to the EC2 instance named prometheus via ssh.
  2. Run the following commands to install the ADOT Collector. This post assumes that the EC2 instance is running Ubuntu.  GitHub repository link has more installation details:
wget https://aws-otel-collector.s3.amazonaws.com/ubuntu/amd64/latest/aws-otel-collector.deb
sudo dpkg -i -E ./aws-otel-collector.deb 

Configure ADOT Collector

  1. On this EC2 instance, create a configuration file named adot-config.yaml using the following content. Change regionId as applicable. Change workspaceId with the workspace ID from the section on launching the Amazon Managed Service for Prometheus workspace.
receivers:
  prometheus:
    config:
      global:
        scrape_interval: 15s
        external_labels:
          monitor: 'cwp_exporter'

      scrape_configs:
        - job_name: 'cwp_exporter'
          static_configs:
            - targets: ['localhost:9102']

          metric_relabel_configs:
            - source_labels: ['__name__']
              regex: 'aws_applicationelb_.*'
              action: 'keep'

exporters:
  awsprometheusremotewrite:
    endpoint: https://aps-workspaces.<regionId>.amazonaws.com/workspaces/<workspaceId>/api/v1/remote_write
    aws_auth:
      service: "aps"
      region: "<regionId"

service:
  pipelines:
    metrics:
      receivers: [prometheus]
      exporters: [awsprometheusremotewrite]

The ADOT configuration file can be broken down into three sections: receiver, exporters, and service. Often another section named processor is used. However, we don’t need a processor for this post.

The receiver section instructs ADOT to use Prometheus as a receiver. The configuration of the Prometheus receiver supports the full set of Prometheus scraping and re-labelling configurations. This configuration file also uses the relabelling strategy in Prometheus so that only ALB-related metrics are written remotely to Amazon Managed Workspace for Prometheus. This approach will optimize cost by writing the metrics remotely and storing the same in Amazon Managed Service for Prometheus. For more details on relabelling with Prometheus, see here. The exporter section instructs ADOT to write the metrics remotely to Amazon Managed Service for Prometheus. The service section describes a pipeline to configure the ADOT collector to scrape metrics from a Prometheus instrumented application, and sending them to AWS Managed Service for Prometheus.

Launch ADOT Collector

  1. Return to the terminal where Prometheus was launched.
  2. Launch the ADOT Collector with the adot-config.yaml configuration file created previously using the following command:
sudo /opt/aws/aws-otel-collector/bin/aws-otel-collector-ctl -c adot-config.yaml -a start

The log file (/opt/aws/aws-otel-collector/logs/aws-otel-collector.log) should have content similar as the following text. This indicates that ADOT Collector has successfully connected to Amazon Managed Service for Prometheus.

2022/06/17 15:07:27 I! Change ownership to 997:998
2022/06/17 15:07:27 I! Set HOME: /home/aoc
{"level":"info","timestamp":"2022-06-17T15:07:27.581Z","caller":"builder/exporters_builder.go:255","message":"Exporter was built.","kind":"exporter","name":"awsprometheu
sremotewrite"}
{"level":"info","timestamp":"2022-06-17T15:07:27.581Z","caller":"builder/pipelines_builder.go:223","message":"Pipeline was built.","name":"pipeline","name":"metrics"}
{"level":"info","timestamp":"2022-06-17T15:07:27.581Z","caller":"builder/receivers_builder.go:226","message":"Receiver was built.","kind":"receiver","name":"prometheus",
"datatype":"metrics"}
{"level":"info","timestamp":"2022-06-17T15:07:27.581Z","caller":"service/service.go:82","message":"Starting extensions..."}
{"level":"info","timestamp":"2022-06-17T15:07:27.581Z","caller":"service/service.go:87","message":"Starting exporters..."}
{"level":"info","timestamp":"2022-06-17T15:07:27.581Z","caller":"builder/exporters_builder.go:40","message":"Exporter is starting...","kind":"exporter","name":"awspromet
heusremotewrite"}
{"level":"info","timestamp":"2022-06-17T15:07:27.582Z","caller":"builder/exporters_builder.go:48","message":"Exporter started.","kind":"exporter","name":"awsprometheusre
motewrite"}
{"level":"info","timestamp":"2022-06-17T15:07:27.582Z","caller":"service/service.go:92","message":"Starting processors..."}
{"level":"info","timestamp":"2022-06-17T15:07:27.582Z","caller":"builder/pipelines_builder.go:54","message":"Pipeline is starting...","name":"pipeline","name":"metrics"}
{"level":"info","timestamp":"2022-06-17T15:07:27.582Z","caller":"builder/pipelines_builder.go:65","message":"Pipeline is started.","name":"pipeline","name":"metrics"}
{"level":"info","timestamp":"2022-06-17T15:07:27.582Z","caller":"service/service.go:97","message":"Starting receivers..."}
{"level":"info","timestamp":"2022-06-17T15:07:27.582Z","caller":"builder/receivers_builder.go:68","message":"Receiver is starting...","kind":"receiver","name":"prometheu
s"}
{"level":"info","timestamp":"2022-06-17T15:07:27.585Z","caller":"builder/receivers_builder.go:73","message":"Receiver started.","kind":"receiver","name":"prometheus"}
{"level":"info","timestamp":"2022-06-17T15:07:27.585Z","caller":"service/telemetry.go:95","message":"Setting up own telemetry..."}
{"level":"info","timestamp":"2022-06-17T15:07:27.605Z","caller":"service/telemetry.go:115","message":"Serving Prometheus metrics","address":":8888","level":"basic","serv
ice.instance.id":"d707137f-1661-4937-b708-f1547b743bd5","service.version":"latest"}
{"level":"info","timestamp":"2022-06-17T15:07:27.605Z","caller":"service/collector.go:229","message":"Starting aws-otel-collector...","Version":"v0.16.1","NumCPU":2}
{"level":"info","timestamp":"2022-06-17T15:07:27.605Z","caller":"service/collector.go:124","message":"Everything is ready. Begin running and processing data."}

Launch Grafana workspace

  1. Create an Amazon Managed Grafana Workspace.
  2. Define user access to Amazon Managed Grafana.

Add Prometheus data source

  1. Add the Amazon Managed Service for Prometheus as a data source for Amazon Managed Grafana.

Create dashboard

  1. Next, we should create a new dashboard with the import option.
  2. Upload the following JSON document:
{"annotations":{"list":[{"builtIn":1,"datasource":"-- Grafana --","enable":true,"hide":true,"iconColor":"rgba(0, 211, 255, 1)","name":"Annotations & Alerts","target":{"limit":100,"matchAny":false,"tags":[],"type":"dashboard"},"type":"dashboard"}]},"editable":true,"fiscalYearStartMonth":0,"graphTooltip":0,"id":34,"links":[],"liveNow":true,"panels":[{"description":"Average request count (600s)","fieldConfig":{"defaults":{"color":{"mode":"palette-classic"},"custom":{"axisLabel":"","axisPlacement":"auto","barAlignment":0,"drawStyle":"line","fillOpacity":2,"gradientMode":"none","hideFrom":{"legend":false,"tooltip":false,"viz":false},"lineInterpolation":"linear","lineWidth":1,"pointSize":5,"scaleDistribution":{"type":"linear"},"showPoints":"auto","spanNulls":false,"stacking":{"group":"A","mode":"none"},"thresholdsStyle":{"mode":"off"}},"mappings":[],"thresholds":{"mode":"absolute","steps":[{"color":"green","value":null},{"color":"red","value":80}]}},"overrides":[]},"gridPos":{"h":8,"w":24,"x":0,"y":0},"id":2,"options":{"legend":{"calcs":[],"displayMode":"list","placement":"bottom"},"tooltip":{"mode":"single","sort":"none"}},"targets":[{"datasource":{"type":"prometheus","uid":"dTWjk5Ynk"},"exemplar":true,"expr":"aws_applicationelb_request_count_average{}","hide":false,"interval":"","legendFormat":"ALB-{{name}}","refId":"A"}],"title":"Request Count (Average)","type":"timeseries"},{"fieldConfig":{"defaults":{"color":{"mode":"palette-classic"},"custom":{"axisLabel":"","axisPlacement":"auto","barAlignment":0,"drawStyle":"line","fillOpacity":0,"gradientMode":"none","hideFrom":{"legend":false,"tooltip":false,"viz":false},"lineInterpolation":"linear","lineWidth":1,"pointSize":5,"scaleDistribution":{"type":"linear"},"showPoints":"auto","spanNulls":false,"stacking":{"group":"A","mode":"none"},"thresholdsStyle":{"mode":"off"}},"mappings":[],"thresholds":{"mode":"absolute","steps":[{"color":"green","value":null},{"color":"red","value":80}]}},"overrides":[]},"gridPos":{"h":9,"w":11,"x":0,"y":8},"id":4,"options":{"legend":{"calcs":[],"displayMode":"list","placement":"bottom"},"tooltip":{"mode":"single","sort":"none"}},"targets":[{"datasource":{"type":"prometheus","uid":"dTWjk5Ynk"},"exemplar":true,"expr":"aws_applicationelb_active_connection_count_average{name=\"nginx\"}","interval":"","legendFormat":"ALB-{{name}}-Connections","refId":"A"}],"title":"LCUs consumed (Average)","type":"timeseries"},{"fieldConfig":{"defaults":{"color":{"mode":"thresholds"},"mappings":[],"thresholds":{"mode":"absolute","steps":[{"color":"green","value":null},{"color":"red","value":80}]},"unit":"s"},"overrides":[]},"gridPos":{"h":9,"w":13,"x":11,"y":8},"id":8,"options":{"orientation":"auto","reduceOptions":{"calcs":["lastNotNull"],"fields":"","values":false},"showThresholdLabels":false,"showThresholdMarkers":true,"text":{}},"pluginVersion":"8.4.7","targets":[{"datasource":{"type":"prometheus","uid":"dTWjk5Ynk"},"exemplar":true,"expr":"aws_applicationelb_target_response_time_average{name=\"nginx\"}","interval":"","legendFormat":"ALB-{{name}}-response-time","refId":"A"}],"title":"Target Response Time (Average)","type":"gauge"}],"refresh":"","schemaVersion":35,"style":"dark","tags":[],"templating":{"list":[]},"time":{"from":"now-5m","to":"now"},"timepicker":{},"timezone":"browser","title":"CloudWatch - ALB","uid":"D6ScWuUnz","version":38,"weekStart":""}

Once the dashboard is imported, run the hey command for two minutes (-z 2m) to simulate load on the ALB. The hey command should be run from the same local environment where previous commands were run. This is because the security group for the ALB is configured to receive traffic from IP address of that local environment only.

hey -z 2m http://${ALB_DNS}/

The ALB metrics is shown in the following screenshot.

Amazon Managed Grafana dashboard showing Amazon CloudWatch metrics for Application Load Balancer (ALB).

Figure 2 Grafana dashboard for CloudWatch metrics of ALB

Next steps

Some of the next steps are to configure yace for ingesting metrics from different services that log their metrics in to CloudWatch. The deployment of yace and the ADOT collector could be in multiple instances to ingest the high volume of CloudWatch metrics. Depending on the requirements, you can evaluate the options to rewrite or omit labels in the ADOT collector configuration as well as define recording rules and alerts in Amazon Managed Service for Prometheus. Similarly, with Amazon Managed Grafana, you can use different widgets for creating more detailed dashboards with alert rules.

Cleaning up

You will continue to incur cost until deleting the infrastructure that you created for this post. Use the following commands to clean up the created AWS resources for this demonstration.

  1. Delete the Amazon Managed Grafana workspace
  2. Delete the Amazon Managed Service for Prometheus workspace
  3. Delete the Application Load Balancer
  4. Terminate the EC2 instances
  5. Remove the IAM policies
  6. Remove the IAM roles or instance profiles

Conclusion

This post demonstrated a mechanism to ingest, query, and visualize CloudWatch metrics using Amazon Managed Service for Prometheus and Amazon Managed Grafana. Furthermore, Amazon Managed Service for Prometheus and Amazon Managed Grafana can be configured to create alerts as required.

Author:

Nagesh Subrahmanyam

Nagesh Subrahmanyam is a Partner Management Solution Architect and has over 20 years of experience. He is currently specializing in Kubernetes, has extensive knowledge in IoT and dabbled with Blockchain (Ethereum). In his spare time, he loves to watch Marvel Comics Universe movies with his son.