The training and learning process of deep learning (DL) models can be expensive and time consuming. It’s important for data scientists to monitor the model metrics, such as the training accuracy, training loss, validation accuracy, and validation loss, and make informed decisions based on those metrics. In this blog post, I’ll show you how to expand the Amazon SageMaker integration with Amazon CloudWatch to keep a history of the model metrics for a specific amount of time, visualize model performance metrics, and create a CloudWatch dashboard. I use MXNet framework in this demo, but the same approach can be applied to any machine learning/deep learning (ML/DL) framework. Amazon SageMaker provides out-of-the-box integration with CloudWatch, which collects near-real-time utilization metrics for the training job instance, such as CPU, memory, and GPU utilization of the training job container. More details can be found in the documentation for Monitoring Amazon SageMaker with Amazon CloudWatch.
Solution overview
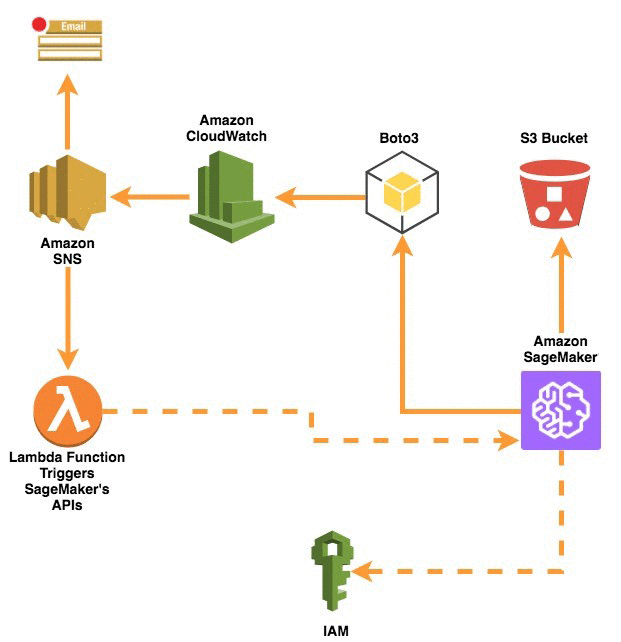
In this example, I create a notebook instance using Amazon SageMaker, then build and train an Apache MXNet handwritten-digit classifier model. I use Gluon, the MNIST dataset, and Convolution Neural Network (CNN) architecture for simplicity. I also use Amazon CloudWatch API operations to send the training metrics to CloudWatch, and create a dashboard of those metrics. Lastly, I use Amazon Simple Notification Service (Amazon SNS) and AWS Lambda to send a notification when the model is overfitting.
Architecture
Configuration
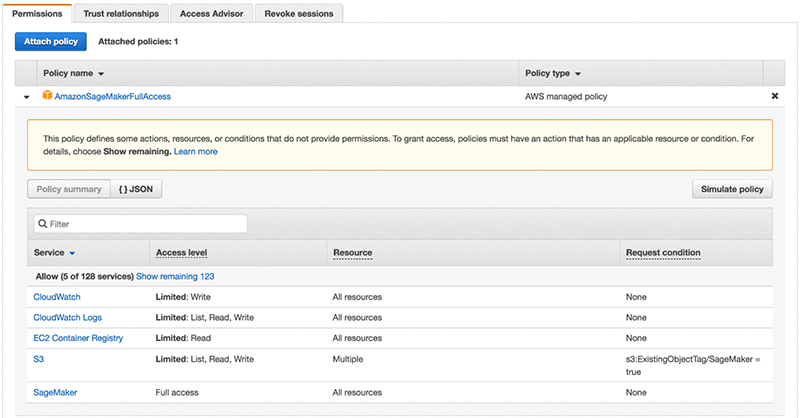
Amazon SageMaker needs permission to create CloudWatch metrics. This can be done by creating an IAM service role with the necessary CloudWatch permissions. The IAM managed policy AmazonSageMakerFullAccess already has permissions to create CloudWatch metrics. You can get to the following policy view by opening the AWS Management Console, choosing IAM, Policies, and then searching for “AmazonSageMakerFullAccess”. Note that creating a CloudWatch dashboard requires that the cloudwatch:PutMetricData permission be added to the policy. More information about creating and managing IAM permissions can be found in Controlling Access Using Policies.
Model training
Before I dive deeper into the code, I explain some of the important key concepts of the training process with Amazon SageMaker. The Amazon SageMaker Python SDK provides a high-level construct called estimators. Estimators are wrappers for the Amazon SageMaker built-in deep learning frameworks. Training MXNet models using estimators is a two-step process:
- Preparing the training script that must contain a function train() that includes the training logic. Amazon SageMaker will invoke this function in the training script to start training.
- Using MXNet estimator to run the training script while injecting information about the training environment into the training function such as: hyperparameters, num_gpus, channel_input_dir, etc.
When training and deploying the training script, Amazon SageMaker runs the Python scripts in a Docker container. The decision to use GPU or CPU for training is determined by the train_instance_type set on the MXNet constructor. If the train_instance_type parameter has a GPU type of instance, SageMaker will use a GPU version of MXNet. If the train_instance_type parameter has CPU type of instance, SageMaker will use a CPU version of MXNet. More information on SageMaker estimators can be found in AWS SageMaker Estimators.
The following code snippet from my SageMaker notebook shows how to start the training process:
import sagemaker
from sagemaker.mxnet import MXNet
from mxnet import gluon
from sagemaker import get_execution_role
# Creates a SageMaker session to upload the training data
sagemaker_session = sagemaker.Session()

# Returns the IAM role that SageMaker uses to access Amazon S3 and other services.
role = get_execution_role()

# Download the training and testing data
gluon.data.vision.MNIST('./data/train', train=True)
gluon.data.vision.MNIST('./data/test', train=False)

# Upload the downloaded data to an S3 location
input_data = sagemaker_session.upload_data(path='data', key_prefix='data/mnist')

# Creating an MXNet Estimator that wraps the training environment parameters. P2.xlarge is a GPU type instance and will use GPU verion of MXNet
mxnet_estimator = MXNet("training_function.py", role=role, train_instance_count=1, train_instance_type="ml.p2.xlarge",
          hyperparameters={'batch_size': 100, 'epochs': 20, 'learning_rate': 0.1,'momentum': 0.9,'log_interval': 100})

# start the training process.
mxnet_estimator.fit(input_data)
The following code snippet is from the training_function.py script that I pass as the first argument to the MXNet estimator. In this function, I use the MXNet metrics class to collect the model’s evaluation metrics (Training Accuracy, Training Loss, and Validation Accuracy). The training_function.py script will be placed in the same directory as the Jupyter notebook file.
def train(channel_input_dirs, model_dir, hyperparameters, hosts, num_gpus, **kwargs):
    # SageMaker passes num_cpus, num_gpus and other args we can use to tailor training to the current container environment.
    # The training will use GPU if the instance type is a GPU instance otherwise, it will use CPU.
    ctx = mx.gpu() if num_gpus > 0 else mx.cpu()

    num_examples = 70000
    best_accuracy = 0.0

    # retrieve the hyperparameters we set in notebook (with some defaults)
    batch_size = hyperparameters.get('batch_size', 100)
    epochs = hyperparameters.get('epochs', 20)
    learning_rate = hyperparameters.get('learning_rate', 0.1)
    momentum = hyperparameters.get('momentum', 0.9)
    log_interval = hyperparameters.get('log_interval', 100)

    # load training and validation data
    # we use the gluon.data.vision.MNIST class because of its built-in MNIST pre-processing logic,
    # but point it at the location where SageMaker placed the data files, so it doesn't download them again.
    training_dir = channel_input_dirs['training']
    train_data = get_train_data(training_dir + '/train', batch_size)
    val_data = get_val_data(training_dir + '/test', batch_size)

    # define the network
    net = nn.Sequential()
    with net.name_scope():
      net.add(nn.Dense(128, activation='relu'))
      net.add(nn.Dense(64, activation='relu'))
      net.add(nn.Dense(10))

    # Collect all parameters from net and its children, then initialize them.
    net.initialize(mx.init.Xavier(magnitude=2.24), ctx=ctx)

    if len(hosts) == 1:
        kvstore = 'device' if num_gpus > 0 else 'local'
    else:
        kvstore = 'dist_device_sync' if num_gpus > 0 else 'dist_sync'

    trainer = gluon.Trainer(net.collect_params(), 'sgd',
                            {'learning_rate': learning_rate, 'momentum': momentum},
                            kvstore=kvstore)

    # Instantiate the Accuracy and Cross Entropy Loss metric classes.
    # The later Computes the softmax cross entropy loss.
    metric = mx.metric.Accuracy()
    loss = gluon.loss.SoftmaxCrossEntropyLoss()

    # Instatiate the CloudWatch Class for Evaluation Metrics.
    CWMetrics = CWEvalMetrics(region=region, model_name=model_name)

    for epoch in range(epochs):
        # reset data iterator and metric at begining of epoch.
        metric.reset()
        cumulative_loss = 0
        btic = time.time()

        for i, (data, label) in enumerate(train_data):
            # Copy data to ctx if necessary
            data = data.as_in_context(ctx)
            label = label.as_in_context(ctx)

            # Start recording computation graph with record() section.
            # Recorded graphs can then be differentiated with backward.
            with autograd.record():
                output = net(data)
                L = loss(output, label)
                L.backward()
            # Get the sum of the Loss for each Iteration
            cumulative_loss += nd.sum(L).asscalar()
            trainer.step(data.shape[0])

            # update metric at last.
            metric.update([label], [output])

            if i % log_interval == 0 and i > 0:
                name, acc = metric.get()
                print('Training Loss: %f' % float(cumulative_loss / num_examples))
                print('[Epoch %d Batch %d] Training: %s=%f, %f samples/s' %
                      (epoch, i, name, acc, batch_size / (time.time() - btic)))

                # Send the collected training accuracy and loss to CloudWatch
                CWMetrics.CW_eval(model_name, is_training=True, Accuracy=acc * 100, Loss=float(cumulative_loss / num_examples * 100), hyperparameters=hyperparameters)

            btic = time.time()

        name, acc = metric.get()
        print('[Epoch %d] Training: %s=%f' % (epoch, name, acc))

        name, val_acc = test(ctx, net, val_data)
        print('[Epoch %d] Validation: %s=%f' % (epoch, name, val_acc))

        #Saving the model if this is the best validation accuracy in the train loop
        if val_acc > best_accuracy:
    			symbol = net(mx.sym.var('data'))
    			symbol.save('%s/model.json' % model_dir)
    			net.collect_params().save('{}/model-{:0>4}.params'.format(model_dir, epoch))
    			best_accuracy = val_ac

        # Send the collected training accuracy and loss to CloudWatch
        CWMetrics.CW_eval(model_name, is_training=False, Accuracy=val_acc * 100, hyperparameters=hyperparameters)

        # Create Cloudwatch Dashboard with the generated metrics.
       		if epoch == 1:
	   CWMetrics.create_dashboard('MNIST_Dashboard')
    return net
The earlier code uses a class called CWEvalMetrics. This class implements a function to send evaluation metrics to CloudWatch using Boto3. The class code follows:
class CWEvalMetrics():
    # initialize the region and the model name with the class instantiation
    def __init__(self, region='us-east-1', model_name='CW-example'):
        self.region = region
        self.model_name = model_name

    # A function to send the training evaluation metrics
    # the metric_type parameters will determine whether the data sent is for training or validation.

    def CW_eval(self, model_name, is_training,  **kwargs):
        # collecting the loss and accuracy values
        loss = kwargs.get('Loss', 0)
        accuracy = kwargs.get('Accuracy')

        # determine if the passed values are for training or validation
        if is_training:
            metric_type = 'Training'
        else:
            metric_type = 'Validation'

        # Collecting the hyperparameters to be used as the metrics dimensions
        hyperparameter = kwargs.get('hyperparameters')
        optimizer = str(hyperparameter.get('optimizer'))
        epochs = str(hyperparameter.get('epochs'))
        learning_rate = str(hyperparameter.get('learning_rate'))
        client = boto3.client('cloudwatch')
        response = client.put_metric_data(
            Namespace='/aws/sagemaker/' + model_name,
            MetricData=[
                {
                    'MetricName': metric_type + ' Accuracy',
                    'Dimensions': [
                  { 'Name': 'Model Name', 'Value': model_name },
                  { 'Name': 'Learning Rate', 'Value': learning_rate },
                  { 'Name': 'Optimizer', 'Value': optimizer },
                  { 'Name': 'Epochs', 'Value': epochs},
                    ],
                    'Value': accuracy,
                    'Unit': "Percent",
                    'StorageResolution': 1
                },
                {
                    'MetricName': metric_type + ' Loss',
                    'Dimensions': [
                  { 'Name': 'Model Name', 'Value': model_name },
                  { 'Name': 'Learning Rate', 'Value': learning_rate },
                  { 'Name': 'Optimizer', 'Value': optimizer },
                  { 'Name': 'Epochs', 'Value': epochs},
                    ],
                    'Value': loss,
                    'Unit': "Percent",
                    'StorageResolution': 1
                },
            ]
        )
        return response
The class can be initialized with the model name and the AWS Region that will host the CloudWatch metrics. The model name is part of the CloudWatch namespace. After initialization, I used the CW _eval() function to send the training or validation metrics based on the value of metric_type parameter. I also added the main training hyperparameters as the dimensions for each metric, to allow an easy way to compare the performance of each hyperparameter across multiple training jobs.
A short while after the training starts, statistics will start appearing in CloudWatch. I can also create a customized CloudWatch dashboard with the metrics created in the earlier step. This can be done in the CloudWatch console or by calling the put_dashboard() API operation from the Boto3 SDK. Some sample code would look like the following:
# A function to create a dashboard with the above training metrics.
def create_dashboard(self, db_name, **kwargs):
    hyperparameter = kwargs.get('hyperparameters')
    job_name = str(hyperparameter.get('sagemaker_job_name'))
    optimizer = str(hyperparameter.get('optimizer'))
    epochs = str(hyperparameter.get('epochs'))
    lr = str(hyperparameter.get('learning_rate'))

    # The dashboard body has the property of the dashboard in JSON format
    dashboard_body = '{"widgets":[{"type":"metric","x":0,"y":3,"width":18,"height":9,"properties":{"view":"timeSeries","stacked":false,"metrics":[["/aws/sagemaker/' + self.model_name + '","Training Loss","Model Name","' + self.model_name + '","Epochs","' + epochs + '","Optimizer","' + optimizer + '","Learning Rate","' + lr + '"],[".","Training Accuracy",".",".",".",".",".",".",".","."],[".","Validation Accuracy",".",".",".",".",".",".",".","."]],"region":"' + self.region + '","period":30}},{"type":"metric","x":0,"y":0,"width":18,"height":3,"properties":{"view":"singleValue","metrics":[["/aws/sagemaker/' + self.model_name + '","Training Loss","Model Name","' + self.model_name + '","Epochs","' + epochs + '","Optimizer","' + optimizer + '","Learning Rate","' + lr + '"],[".","Training Accuracy",".",".",".",".",".",".",".","."],[".","Validation Accuracy",".",".",".",".",".",".",".","."]],"region":"' + self.region + '","period":30}}]}'

    response = client.put_dashboard(DashboardName=db_name, DashboardBody=dashboard_body)
    return response
When I open the CloudWatch console, choose Dashboards, and then select the dashboard name I created earlier, I can see the two graphs that I created in that earlier step:
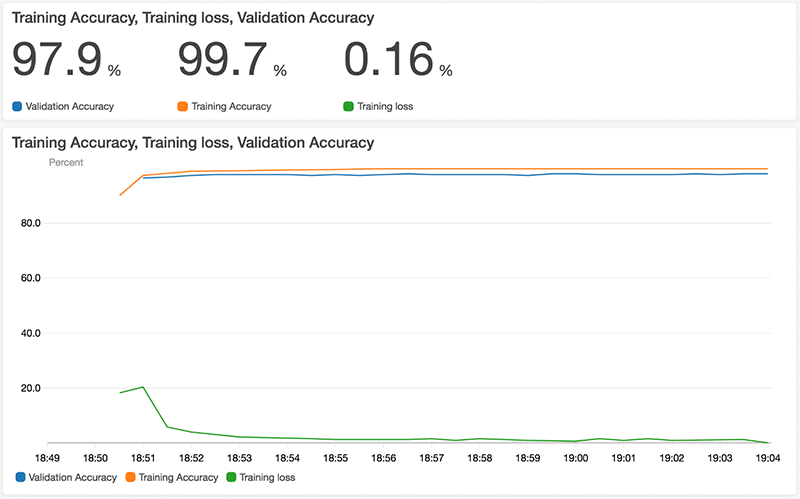
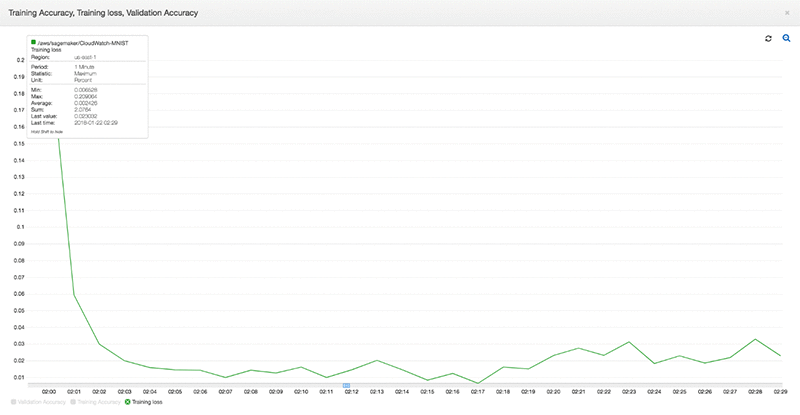
To get more insights into one of the 3 metrics in the graph, click on the metric name below the graph. It will show more details on that specific metric such as the minimum, maximum, and the last value at any point in time:
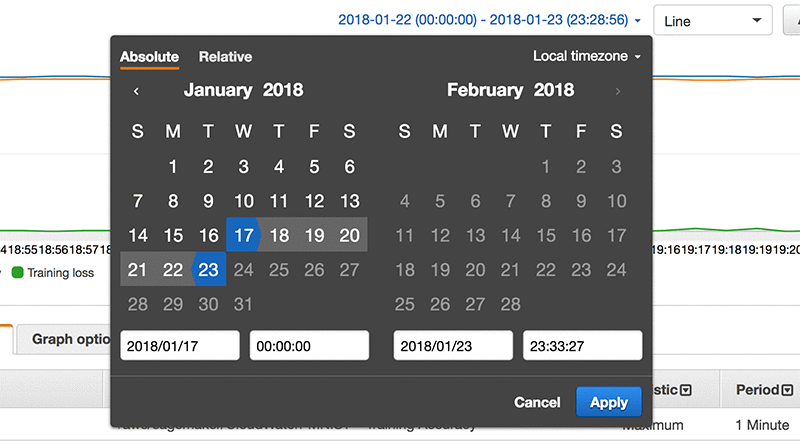
CloudWatch can retain 1-minute data points for 15 days and 5-minute data points for 63 days. This gives me access to historical high-resolution model training. You could also visualize old evaluation metrics graphs by switching to the Metrics view in the console. Then select the absolute option with the timeline you want by navigating to CloudWatch and choosing Metrics. In the custom Namespaces section, select the namespace that you created in the step earlier and select the desired metric. This shows all the data for the selected metrics in the selected timeframe:
This is very useful if you want to be notified of certain events during the training. An alarm can be created programmatically or by navigating to the CloudWatch console, choosing Metrics, selecting the custom namespace created earlier, and selecting the desired metrics. Then switch to the Graphed metrics tab and click the  icon:
icon:

In the following example, I create an alarm that sends an email notification and stops the training job if the model starts to overfit. For the purpose of this demo, I manipulated the MNIST validation dataset and the training code in order to simulate a Model Overfitting. The following graph from the dashboards console shows how the model is overfitting during the training process where the validation accuracy is very low.
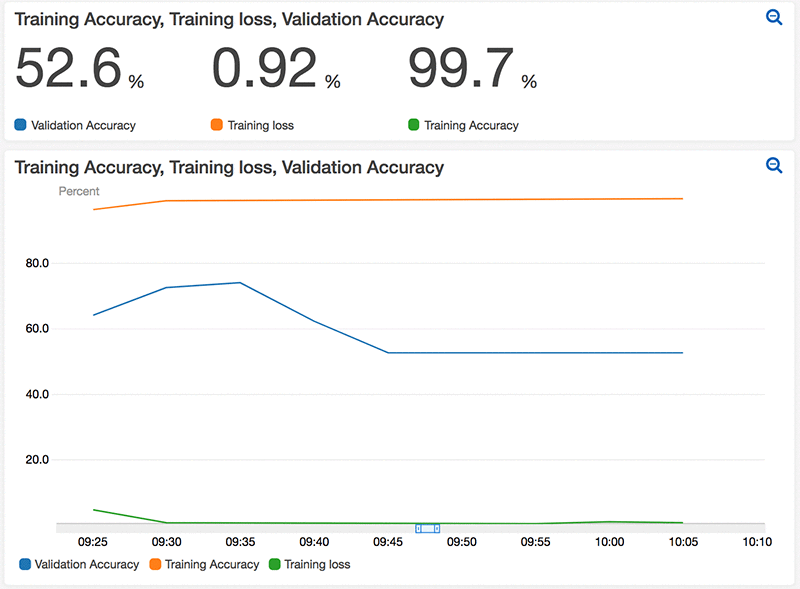
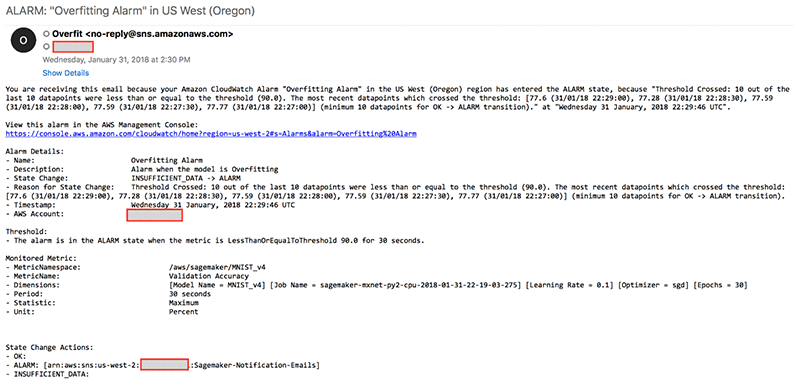
I used the following function in the training_function.py script to create an alarm that sends a notification to an SNS topic. The alarm will be triggered when the Validation Accuracy is less than or equal 90% for 10 data points within 5 minutes. The SNS topic will then send an email alerting me that my model is overfitting.
# when creating an alarm that includes the 'Job Name' as one of the dimensions, then the CloudWatch
# metric created also needs to have 'Job Name' as one of the dimensions
def create_alarm(self, model_name, **kwargs):
    hyperparameter = kwargs.get('hyperparameters')
    job_name = str(hyperparameter.get('sagemaker_job_name'))
    optimizer = str(hyperparameter.get('optimizer'))
    epochs = str(hyperparameter.get('epochs'))
    learning_rate = str(hyperparameter.get('learning_rate'))
    namespace = '/aws/sagemaker/' + model_name
    client.put_metric_alarm(
        AlarmName='Overfitting Alarm',
        ComparisonOperator='LessThanOrEqualToThreshold',
        EvaluationPeriods=10,
        DatapointsToAlarm=10,
        MetricName='Validation Accuracy',
        Namespace=namespace,
        Period=30,
        Statistic='Maximum',
        Threshold=90.0,
        ActionsEnabled=True,
        AlarmActions=[
            'arn:aws:sns:us-west-2:<account-id>:Sagemaker-Notification-Emails',
        ],
        AlarmDescription='Alarm when the model is Overfitting',
        Dimensions=[
            { 'Name': 'Model Name', 'Value': model_name },
            { 'Name': 'Job Name', 'Value': job_name },
            { 'Name': 'Learning Rate', 'Value': learning_rate },
            { 'Name': 'Optimizer', 'Value': optimizer },
            { 'Name': 'Epochs', 'Value': epochs},
        ],
        Unit='Percent'
    )
I also have a Lambda function triggered by the SNS topic’s publish event. The Lambda function then calls the SageMaker’s stop_training_job API operation to stop the training run. (More details on how to create Lambda functions can be found in the documentation for AWS Lambda – Create a Lambda Function.)
import json
import boto3


def lambda_handler(event, context):
    # Get the job name from the event
    Trigger = event["Records"][0]["Sns"]["Message"]
    Job = json.loads(Trigger)

    # The index of the job name element will be the same as the one listed in the create_alarm() function
    Job = Job["Trigger"]["Dimensions"][1]["value"]

    # stop the training job if overfitting is detected
    client = boto3.client('sagemaker')
    response = client.stop_training_job(TrainingJobName=Job)

    return response
It’s important to note that the Lambda function needs the right permissions to execute the SageMaker stop_training_job API operation, and that the SNS topic is set as the event trigger.
A few minutes after training, I receive the notification email that my model is overfitting:
Amazon SageMaker then stops the training job in response to the model overfitting alarm. This can be viewed by switching to the AWS Management Console, choosing Amazon SageMaker, and then choosing Jobs. Note that the training_function.py script will checkpoint the model at each epoch as long as the validation accuracy is the best accuracy throughout the training iteration. That way, I always have the latest model checkpoint before stopping the training job.

Monitoring the model training and taking immediate actions is vital when the training is not progressing. It is a proactive way to reduce the cost of the training, and actively notify the creator with any problems the model might encounter.
Summary
Getting started with Amazon SageMaker to train, monitor, and deploy deep learning models is easy. The benefit of using Amazon CloudWatch as a centralized service for evaluation metrics is huge. You can see near real-time visualization of the metrics, keep a historical record of the DL metrics, create alarms and automated actions in response to metric events, and build and customize a dashboard for all DL models.
About the Author
 Waleed (Will) Badr is a Senior Technical Account Manager in the Australia-New Zealand (ANZ) region and his area of depth is in AI and Machine/Deep Learning. He is passionate about using technology in innovative ways to positively impact the community. In his spare time, he likes to go diving, play soccer and explore the Pacific Islands.


![]() icon:
icon:


 Waleed (Will) Badr is a Senior Technical Account Manager in the Australia-New Zealand (ANZ) region and his area of depth is in AI and Machine/Deep Learning. He is passionate about using technology in innovative ways to positively impact the community. In his spare time, he likes to go diving, play soccer and explore the Pacific Islands.