AWS Cloud Financial Management
Understand and build driver-based forecasting
Over the past few weeks, we’ve been discussing the ways you can improve your cloud cost forecasting. In our first blog, we discussed how to improve your financial predictability, and in the second, how to establish a cost forecasting culture in your organization.
In this blog, we’re going to deep dive into forecasting strategy; specifically, understanding and building driver-based forecasts. Unlike trend-based forecasting, which predicts spend based on historical patterns, driver-based forecasting is ideal for a dynamic and variable spending environment. It can take into account factors that drive your business including product or feature launches, product promotions, or pilot programs.
Combining trend- and driver-based forecasting
Before we jump into some examples of how you can build these driver-based forecasts, let’s quickly run through how you can combine trend and driver-based forecasts to accurately predict your cloud spend.
The orange area in the graph below represents the “run” or trend-based projected spend for the year. The blue and green areas represent specific products and their corresponding driver-based demand forecast. Product teams now have a clear picture of their total forecast spend not only by month, but by product-aligned demand driver.

Figure 1: Combined trend and driver-based forecast
Driver-based forecasting
These are the four main demand drivers and examples of each:
- Internal drivers: new product launches, features, or service adoption; new environments demo, pre-production, load testing, and changes to existing products; re-architecture or modernization
- External drivers: new users, sales events, promotions, free trials, and seasonal use (i.e., Prime Day, holidays, Cyber Monday, etc.)
- Strategic drivers: regional or global market expansion, mergers and acquisitions, and divestiture.
- Reverse demand drivers: customer churn, optimization, retiring workloads, or retiring environments
Now, let’s take a closer look at a few of the most common driver-based forecasts.
Internal driver-based forecast
Once you identify your key business drivers, you need to collaborate with Finance, Procurement, and Product departments to create your forecast; an ideal time to build plans is during quarterly planning meetings.
You’ll want to list out any technical solutions, such as new products that will be released to market, product enhancements, and any new growth channels that are opening up. Next, you’ll want to identify the relevant AWS services and resources to use. When you’re building an estimate, consider the Savings Plans AWS offers, such as a pre-purchase and bulk option.
New product launch forecast
To create a new product launch forecast, you should begin by identifying reoccurring and one-time setup costs for each of the AWS services used for the product. If you are unsure, make assumptions, document those assumptions, and revisit these details when you have more clarifying information or data.
You can use the AWS Pricing Calculator to create estimates for your product launch, model your solutions before building them, explore the AWS service price points, and review the calculations behind your estimates. The results can be downloaded into a CSV or easily shared with team members. In the Pricing Calculator screenshot below, you can see an example detailed breakdown of costs by month for Amazon DynamoDB, and Amazon API Gateway services used in the new product.

Figure 2: AWS Pricing Calculator example for new product launch forecast
Combined upfront and ongoing costs for new product launches
It’s important to account for development costs throughout a product’s lifecycle. We recommend customers utilize AWS tags and cost categories to identify product owner, non-production environments, and cost accounts for financial reporting.
In the new product launch example below, the driver-based forecast includes the one-time cost from the original estimate. It also includes reoccurring costs throughout the product lifecycle: the non-production environment, the staging environment, and the production environment, running in multiple regions around the globe.
In the example below, note the timing of the planned spend, and the upfront cost and ongoing cost by quarter, which gives the product owner and Finance time to design the right purchase options (e.g., Savings Plans) to cover the demand needs at the right time.
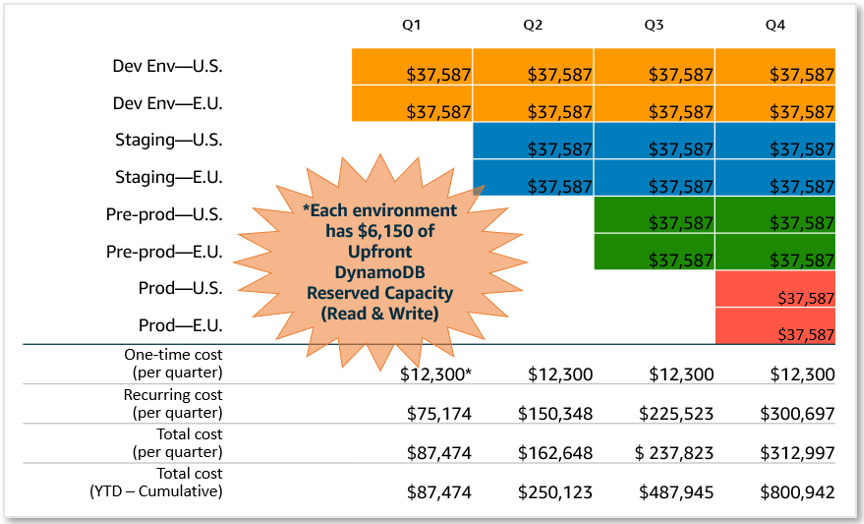
Figure 3: Combined new product launch plan and costs
External driver-based forecast using unit metrics
Another way to build a driver-based forecast is to use a unit metric process. A unit refers to any basic, quantifiable item that creates value for a business. Thus, unit economics demonstrates how much value each item—or unit—generates for the business. For an airline, a unit might be a single seat sold; whereas, for a rideshare app it might be one ride in a company vehicle. Units are then analyzed to determine how much profit or loss they individually produce.
There are numerous benefits to developing unit economics forecast models. The unit metrics model produces a simple, granular picture of your company’s profitability on a per-unit basis. This allows you to project how profitable your business is or when it is expected to achieve profitability.
Again, collaboration and transparency between departments will be crucial. During quarterly Finance, Procurement, and Product planning meetings, you will want to list out strategic aspects of business and demand drivers as mentioned above. This list must be reviewed by senior leadership against the organization’s strategic business goals, since funding generally only gets allocated to projects that deliver on these specific business outcomes. Note: Aligning these objectives and having visibility into potential Mergers and Acquisition (M&A) activity could impact your forecast.
Our recommendation is to start small. Take one slice of the organization and select one product to forecast using unit metrics such as number of queries, scans, users, shipments, etc.
In the example below, we share how a unit cost metric was developed by API calls: A SaaS product responds to 1.5 million API calls a month and costs $13,750 to operate. The cost per successful call is rounded to 4 decimal places ($0.0091). With collaboration between Product, Finance, and Sales, the business can more accurately and efficiently build a forecast, based on external and strategic drivers.
In this example, they can use the unit metric calculation to estimate what the impact to both operating cost and resource usage would be if they added a customer who is forecasted to make 2 million additional API calls a month.

Figure 4: Driver-based forecasting using unit metrics
This type of unit economics information enables your company to identify favorable strategies for product optimization, as well as determine whether certain cloud expenses or strategies are worth the cost. When evaluating product functional requirements and the architecture, reconsider design alternatives that balance cost and meeting the functional requirements. Example: AWS Fargate vs. self-managed Amazon Elastic Container Service (Amazon ECS), or storing data in a database like Amazon DynamoDB vs Amazon Simple Storage Service (Amazon S3).
Conclusion
Driver-based forecasting can help businesses make more accurate predictions about future spend by enabling you to better understand how driver changes may impact your overall forecast. By understanding demand drivers, you can increase your business agility, and make data-based changes in your operations and strategies to stay ahead of dynamic market conditions. Additionally, driver-based forecasting can help you identify potential risks and opportunities, and make better decisions about how to allocate cloud resources.
In our fourth and final blog of our forecast blog series, we’ll reveal some of the best tools you can use to start building and sharing your forecasts.