AWS News Blog
Application Performance Percentiles and Request Tracing for AWS Application Load Balancer
In today’s guest post, my colleague Colm MacCárthaigh discusses the new CloudWatch Percentile Statistics and the implications and benefits load balancing. He also introduces a new request tracing feature that will make it easier for you to track the progress of individual requests as they arrive at a load balancer and make their way to the application.
— Jeff;
Application Performance Percentile Metrics
AWS Elastic Load Balancers have long included Amazon CloudWatch metrics that provide visibility into the health and performance of the instances and software running behind the load balancer. For instance, ELBs measure the response time of every request sent to the application being load balanced. Many customers use the built-in average and maximum latency metrics to monitor the performance of their application. It’s also common to use these metrics to trigger Auto Scaling to add or remove instances or containers as load fluctuates.
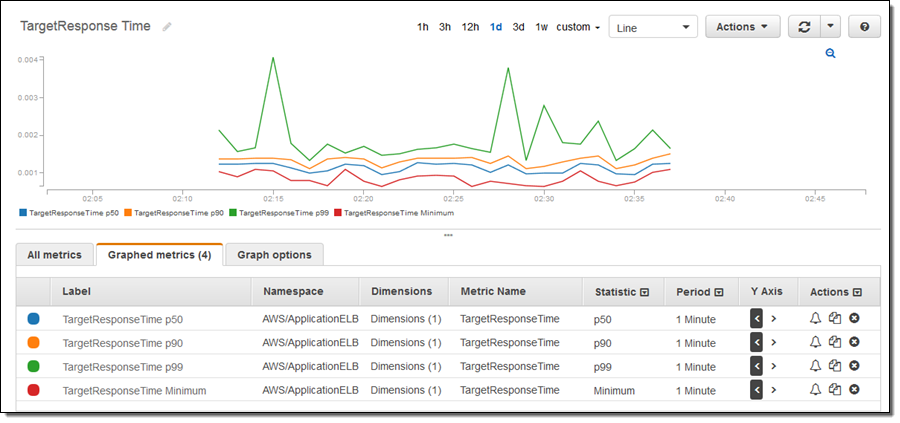
Based on the new CloudWatch Percentile support, newly created Application Load Balancers (ALBs) now provide more fine-grained data for application response time. These measurements allow you to get a better sense of performance across a range, for example if the 10th percentile value is 2 milliseconds, then 10% of requests took 2 milliseconds or less, if the 99.9th percentile value is 50 ms, that means that 99.9% of requests took 50 ms or less and so on.
For a real-world example of how useful percentiles are, suppose an application serves the majority of requests from a fast cache in one or two milliseconds, but when the cache is empty the requests are served much more slowly, perhaps in the 100 ms to 200 ms range. The traditional maximum metric will reflect only the slowest case, around 200 ms, and the average will reflect a blend of the fast and slow responses without giving much information about how many requests are fast, how many are slow, and what the spread within each group is. Percentile metrics illuminate the application’s performance across the range of requests and give a more comprehensive picture.
Percentile metrics can be used to set more meaningful and more aggressive performance targets for your application. For example, by using the 99th percentile as an Auto Scaling trigger or CloudWatch alarm, you can set a scaling target that will provide enough resources so that no more than 1% of the requests take 2 ms or longer to process.
Integrated Request Tracing
While percentiles provide greater visibility into your application with a “big picture” summary of performance across all requests, AWS Application Load Balancer’s new request tracing feature allows you to dive deep into application performance and health at the nitty-gritty level of individual requests.
ALBs now look for a new custom X-Amzn-Trace-ID HTTP header on all requests to an ALB. If this header is absent on an incoming request, then an ALB will generate one that looks like this:
X-Amzn-Trace-Id: Root=1-58211399-36d228ad5d99923122bbe354 and pass it on to the application. Because the header was absent on the incoming request, this request is considered a “root” request and the new header that ALB sends will include a randomly-generated Root attribute.
If the header is present on an incoming request, then its contents will be preserved, so the header can also be used to pass and preserve tracing and diagnostic state, such as ancestry and timing data, between requests. For example, a request that is generated like this:
$ curl -H \
  "X-Amzn-Trace-Id: Root=1-58211399-36d228ad5d99923122bbe354; TimeSoFar=112ms; CalledFrom=Foo" \
  request-tracing-demo-1290185324.elb.amazonaws.com
will cause ALB to generate a slightly different header:
X-Amzn-Trace-Id: Self=1-582113d1-1e48b74b3603af8479078ed6;\
  Root=1-58211399-36d228ad5d99923122bbe354;\
  TotalTimeSoFar=112ms;CalledFrom=Foo
If, as in this example, the incoming header included its own Root attribute, then ALB will preserve it and add a new randomly-generated “Self” attribute instead. The TotalTimeSoFar and CalledFrom attributes in this example are arbitrary and optional, and are actually meaningless to the Load Balancer itself, but are preserved as-is to allow applications and tracing frameworks to pass data between requests.
For applications that don’t set the header on incoming requests, ALB’s request tracing acts as a simple unique identifier for every request. For applications that pass the header between requests, tracing allows you to easily identify the entry point into the overall system, to find related requests with a Root attribute, and it enables applications to create a trail of “breadcrumbs” that spans requests.
The contents of the X-Amzn-Trace-ID header are logged to Application Load Balancer access logs, which contain error indicators and performance measurements for each request, so the unique identifiers can be used to pinpoint issues with individual requests.
http 2016-11-08T00:04:13.109451Z app/request-tracing-demo/f2c895fd3ea253c5 \
  72.21.217.129:20555 172.31.51.164:80 0.001 0.001 0.000 200 200 276 550 \
  "GET http://request-tracing-demo-1290185324.elb.amazonaws.com:80/ HTTP/1.1" \
  "curl/7.24.0 (x86_64-redhat-linux-gnu) libcurl/7.24.0 NSS/3.16.1 \
  Basic ECC zlib/1.2.3 libidn/1.18 libssh2/1.4.2" - - \
  arn:aws:elasticloadbalancing:us-east-1:99999999999:targetgroup/echoheader/21a6f1501d2df426 \
  "Root=1-5821167d-1d84f3d73c47ec4e58577259"
Percentile statistics are available today for all new Application Load Balancers and can be accessed from the CloudWatch Console, AWS SDKs, and API. Support for existing Application Load Balancers and all Classic Load Balancers will be available in the coming weeks. Both new features are included at no extra cost.
— Colm MacCárthaigh, AWS Elastic Load Balancer