AWS News Blog
Process Earth Science Data on AWS With NASA / NEX Public Data Sets

|
We have been working with the NASA Earth Exchange (NEX) team to make it easier and more efficient for researchers to access and process earth science data. The goal is to make a number of important data sets accessible to a wider audience of full-time researchers, students, and citizen scientists. This important new project is called OpenNEX.
Up until now, it has been logistically difficult for researchers to gain easy access to this data due to its dynamic nature and immense size (tens of terabytes). Limitations on download bandwidth, local storage, and on-premises processing power made in-house processing impractical.
Today we are publishing an initial collection of datasets available (over 20 TB), along with Amazon Machine Images (AMIs), and tutorials. NASA is also planning to host a series of virtual workshops for those interested in learning more about the datasets and how to process them on AWS.
The datasets are stored in Amazon S3 are can be found at s3://nasanex. Let’s take a look at each one…
Data for Climate Assessment
Formally known as the NASA Earth Exchange Downscaled Climate Projections, this dataset is described as follows:
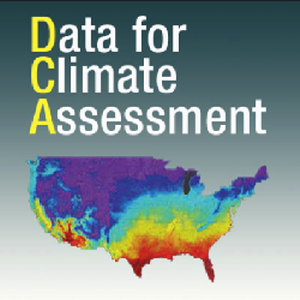 The NASA Earth Exchange (NEX) Downscaled Climate Projections (NEX-DCP30) dataset is comprised of downscaled climate scenarios for the conterminous United States that are derived from the General Circulation Model (GCM) runs conducted under the Coupled Model Intercomparison Project Phase 5 (CMIP5) and across the four greenhouse gas emissions scenarios known as Representative Concentration Pathways (RCPs) developed for the Fifth Assessment Report of the Intergovernmental Panel on Climate Change (IPCC AR5). The dataset includes downscaled projections from 33 models, as well as ensemble statistics calculated for each RCP from all model runs available. The purpose of these datasets is to provide a set of high resolution, bias-corrected climate change projections that can be used to evaluate climate change impacts on processes that are sensitive to finer-scale climate gradients and the effects of local topography on climate conditions. Each of the climate projections includes monthly averaged maximum temperature, minimum temperature, and precipitation for the periods from 1950 through 2005 (Retrospective Run) and from 2006 to 2099 (Prospective Run).
You can access this dataset at s3://nasanex/NEX-DCP30. Consult the detail page and the tech note to learn more about the provenance, format, structure, and attribution requirements.
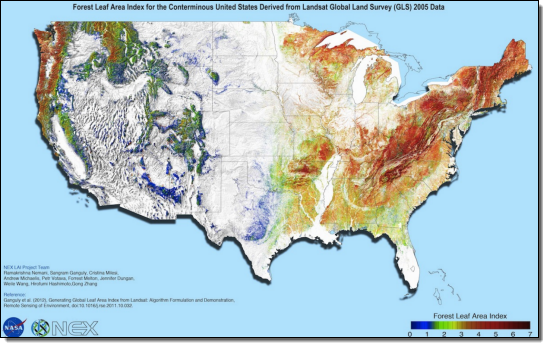
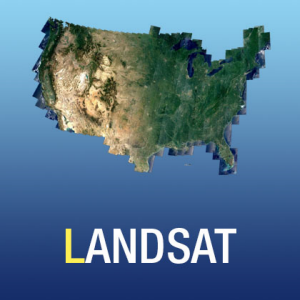
Landsat Global Land Survey
Landsat has been acquiring space-based moderate-resolution land remote sensing data for the past four decades. This is a unique resource for those who work in agriculture, geology, forestry, regional planning, education, mapping, and global change research. The Landsat images are also invaluable for emergency response and disaster relief.
Here’s the official description:
 In the past, the U.S. Geological Survey (USGS) and NASA collaborated on the creation of four global land data sets from Landsat images: one from the 1970s, and one each from circa 1990, 2000, and 2005. Each of these global data sets was created from the primary Landsat sensor in use at the time: the Multispectral Scanner (MSS) in the 1970s, the Thematic Mapper (TM) in 1990, Enhanced Thematic Mapper Plus (ETM+) in 2000, and a combination of TM and ETM+ in 2005.
You can access this dataset at s3://nasanex/Landsat. Consult the detail page and the project description to learn more. You can also use the Landsat tools to access and view the datasets.
MODIS Vegetation Indices
Formally known as MOD13Q1 (Vegetation Indices 16-Day L3 Global 250m), this dataset is described as follows:
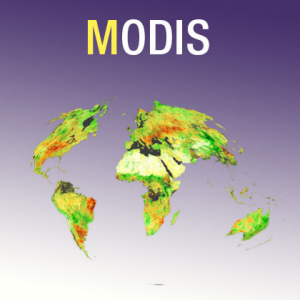 Due to their simplicity, ease of application, and widespread familiarity, vegetation indices have a wide range of usage within the user community. Some of the more common applications may include global biogeochemical and hydrologic modeling, agricultural monitoring and forecasting, land-use planning, land cover characterization, and land cover change detection. Global MODIS vegetation indices are designed to provide consistent spatial and temporal comparisons of vegetation conditions. Blue, red, and near-infrared reflectances, centered at 469-nanometers, 645-nanometers, and 858-nanometers, respectively, are used to determine the MODIS daily vegetation indices. The MODIS Normalized Difference Vegetation Index (NDVI) complements NOAA’s Advanced Very High Resolution Radiometer (AVHRR) NDVI products and provides continuity for time series historical applications. MODIS also includes a new Enhanced Vegetation Index (EVI) that minimizes canopy background variations and maintains sensitivity over dense vegetation conditions. The EVI also uses the blue band to remove residual atmosphere contamination caused by smoke and sub-pixel thin cloud clouds. The MODIS NDVI and EVI products are computed from atmospherically corrected bi-directional surface reflectances that have been masked for water, clouds, heavy aerosols, and cloud shadows. Global MOD13Q1 data are available every 16 days at 250-meter spatial resolution as a gridded level-3 product in the Sinusoidal projection. Lacking a 250m blue band, the EVI algorithm uses the 500m blue band to correct for residual atmospheric effects, with negligible spatial artifacts. Vegetation indices are used for global monitoring of vegetation conditions and are used in products displaying land cover and land cover changes. These data may be used as input for modeling global biogeochemical and hydrologic processes and global and regional climate. These data also may be used for characterizing land surface biophysical properties and processes, including primary production and land cover conversion.
You can access this dataset at s3://nasanex/MODIS. Consult the detail page and the data description to learn more. The MODIS tools may also prove to be helpful.
Webification Data Access Framework
In conjunction with today’s AWS/NASA hackathon, NASA has published an open source tool called Webification (w10n for short). This open source tool simplifies access to data sets such as those described above. All data is accessed via URL and returned in JSON or binary format.
The Webification tool is available as a web service, an EC2 AMI (ami-fc0f97cc in US West (Oregon)), and in source code form. Click through the interactive Webification tutorial to get started.
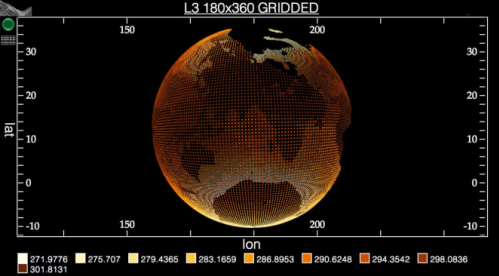
There’s also a visual aspect to the Webification tool. After you extract some data and convert it to JSON, you can create interactive, embedded visualizations that look like this:
AWS CLI Access
The AWS Command Line Interface (CLI) can also be used to access the datasets. Install and configure it, and then review the datasets like this:
$ aws s3 ls s3://nasanex Bucket: nasanex Prefix: LastWriteTime Length Name ------------- ------ ---- PRE Landsat/ PRE MODIS/ PRE NEX-DCP30/
Issue a series of ls commands to explore the bucket, and then download the file or files of interest:
$ aws s3 cp s3://nasanex/NEX-DCP30/NEX-quartile/rcp26/mon/atmos/tasmax/r1i1p1/v1.0/CONUS/tasmax_quartile75_amon_rcp26_CONUS_209601-209912.nc . download: s3://nasanex/NEX-DCP30/NEX-quartile/rcp26/mon/atmos/tasmax/r1i1p1/v1.0/CONUS/tasmax_quartile75_amon_rcp26_CONUS_209601-209912.nc to tasmax_quartile75_amon_rcp26_CONUS_209601-209912.nc $ ls -l tasmax_quartile75_amon_rcp26_CONUS_209601-209912.nc -rw-rw-r-- 1 jbarr jbarr 1088838203 Sep 29 08:03 tasmax_quartile75_amon_rcp26_CONUS_209601-209912.nc
Learn More
You can learn more about the OpenNEX project at the NASA OpenNEX page and on the AWS Public Data Sets page.
— Jeff;