Containers
Amazon Elastic Container Service Anomaly Detector using Amazon EventBridge
This post was contributed by Ugur KIRA and Santosh Kumar. This concept originated from discussions with Skyscanner UK regarding to manage ECS clusters at large scale.
Amazon EventBridge is a serverless event bus that makes it easy to connect applications together using data from your own applications, integrated Software-as-a-Service (SaaS) applications, and AWS services. EventBridge delivers a stream of real-time or near real-time data from event sources, such as Amazon Elastic Container Service (Amazon ECS), and routes that data to targets like AWS Lambda, Amazon Simple Notification Service, etc. It enables you to automate your AWS services and respond automatically to system events such as application availability issues or resource changes. You can use Amazon ECS events for EventBridge to receive near real-time notifications regarding the current state of your Amazon ECS clusters. If your tasks are using the Fargate launch type, you can see the state of your tasks. If your tasks are using the EC2 launch type, you can see the state of both, the container instances and the current state of all tasks running on those container instances.
Using the ECS integration with EventBridge, ECS customers can keep track of all ECS events such as container instance state changes, task state changes, and service scaling activities at very granular level. Additionally, ECS users can detect any unusual events in any ECS service immediately.
Often times customers deploy their mission critical workload in a single large ECS cluster with multiple ECS services. One operational challenge of this approach is that due to high number of service events occurring at the same time, it usually takes significant time to distinguish the services that misbehave or scale abnormally. Not being able to detect anomalies in such complex production environments in timely manner limits their ability to respond to an incident immediately and that increases the impact on production workload running on an ECS service.
The task placement and instance health events generated by the Amazon ECS service scheduler are displayed in AWS console. However, to ensure that this event view is helpful, ECS only shows the 100 most recent service events and for many ECS clusters, having only the last 100 events is not enough to analyze service activities properly. In large ECS clusters, it may become impossible to detect the root cause of an issue or pinpoint the service that experienced the problem, scaled abnormally or determine if the scaling activity triggered by a particular service is legitimate or not. This reduces your ability to operate your production ECS clusters at scale. Therefore, we are introducing ‘ECS Anomaly Detection powered by Amazon EventBridge,’ which will allow you detect common anomalies across ECS services in near real time and generate on-demand reports on events that occurred on your ECS services even after long period of time.
In this blog, we will discuss the ECS Anomaly Detection architecture, which will stream all ECS events into CloudWatch logs and use multiple targets triggering Lambda functions, sending SNS notifications to allow you:
- detect anomalies such as abnormal scaling activities and task placement failures across multiple ECS services by analyzing ECS events provided by Amazon EventBridge
- generate on-demand reports using CW Logs Insights Queries and perform resource usage analysis at task level
- get notified through SNS whenever an anomaly is detected within your services or a deployment started/failed for your ECS services.
This approach can be used with new as well with existing ECS clusters. For existing clusters, ECS events will be available for query only after enabling it.
Overview
As of today, Amazon ECS can send four types of events to Amazon EventBridge in three different event categories: Info, Warning, and Error. These events are container instance state change events, task state change events, service action events, and service deployment state change events. With ECS Anomaly Detector, we will capture these ECS events to provide near real-time insights into ECS service activities by using a serverless architecture.
As part of ECS Anomaly Detection, first, all those events for the ECS cluster will be ingested and stored into CloudWatch Logs. Afterwards, using multi-target capabilities of EventBridge rules, we will leverage CloudWatch Log Insights and Lambda functions to analyze the events and notify whenever required, such as alerting on SERVICE_TASK_PLACEMENT_FAILURE events using SNS.
Prerequisites
- An active AWS Account.
- An ECS cluster with at least one service running.
- AWS CLI with the IAM user having admin permission or has all the permissions to execute the setup.
- jq – command line JSON processor
- ECS Anomaly Detection workflow will consider one ECS cluster with multiple ECS services for the configuration. For multi-cluster support, please review considerations given in the conclusion
Solution details:
At a high level, ECS Anomaly Detector detects all the events using multiple EventBridge rules and store all of them into CloudWatch logs for later analysis using CloudWatch logs insights. While doing so, depending on the event type and category, it also leverages supported targets like SNS and Lambda functions. Here are the details of EventBridge Rules and the targets configured at a high level:
- All ECS service events and ECS task state change events are detected by an EventBridge rule named ‘ECS_AD_ServiceActivity’ and saved into a CloudWatch log group called ‘/aws/events/ECS_ANOMALY_DETECTOR’ for on-demand analysis using CloudWatch Log Insights
- The second EventBridge rule ‘ECS_AD_ServiceAction_ERROR’ is used to detect only ERROR and WARN type ECS service events and alert using a configured SNS topic via email
- The third EventBridge rule ‘ECS_AD_StoppedTask_Detector’ is used to detect failed/problematic tasks and alert using a configured SNS topic via email
- The fourth EventBridge rule ‘ECS_AD_DeploymentStateChange_Event’ is used to detect all ECS Deployment State Change events and send them into two different targets: CloudWatch logs and SNS topic. CloudWatch logs target save the events into CloudWatch log group called ‘/aws/events/ECS_ANOMALY_DETECTOR’ and SNS topic target sends an alert via email.
- The fifth EventBridge rule ‘ECS_AD_UpdateService_CTEvent’ is used to detect ‘UpdateService’ API calls through CloudTrail logs and send them into two different targets: CloudWatch logs and Lambda functions. This rule mostly focuses on scaling activities per ECS service.
Here is a diagram that shows individual components of the ECS Anomaly Detection architecture:

Capturing all relevant ECS events through Amazon EventBridge
Amazon ECS sends all important events related to ECS services to Amazon EventBridge as listed in Service Action Events, ECS Task State Changes, and Deployment State Change.You can follow steps below to set up a set of EventBridge rules to filter events specific to one or more ECS services and log those events in an Amazon CloudWatch log group for anomaly detection.
Step 1: set up the CloudWatch logs policy to allow log ingestion by an Amazon EventBridge rule
For publishing ECS events to a CloudWatch log, SNS topic, or to a Lambda function, EventBridge relies on resource-based policies. Use the following command to check if there is any resource based policy exists for CloudWatch logs to allow EventBridge to CreateLogStream and to PutLogEvents.
Note: by default, this post creates all AWS resources in us-west-2 region. Change the REGION variable to a region where your ECS cluster is located and would like to create the resources for Anomaly Detection.
export REGION='us-west-2'
export ACCOUNTID=$(aws sts get-caller-identity --region $REGION --output text | awk '{print $1}')
aws logs describe-resource-policies --region $REGION --output json
If there is no policy to allow EventBridge to create log streams (logs:CreateLogStream) and to put log events (logs:PutLogEvents) in CloudWatch Logs, use below command to create one:
POLICY_DOCUMENT="{\"Version\":\"2012-10-17\",\"Statement\":[{\"Sid\":\"TrustEventsToStoreLogEvent\",\"Effect\":\"Allow\",\"Principal\":{\"Service\":[\"events.amazonaws.com\",\"delivery.logs.amazonaws.com\"]},\"Action\":[\"logs:CreateLogStream\",\"logs:PutLogEvents\"],\"Resource\":\"arn:aws:logs:$REGION:$ACCOUNTID:log-group:/aws/events/*:*\"}]}"
aws logs put-resource-policy --policy-name TrustEventsToStoreLogEvents --policy-document $POLICY_DOCUMENT --region $REGION
Step 2: create an SNS topic for sending notifications via Amazon EventBridge
If you have an existing SNS topic which you would like to use for sending notification, you may provide your SNS topic name in variable “SNS_TOPIC_NAME” and skip to step 3.
If not, use below commands to create an SNS topic:
export SNS_TOPIC_NAME="ECS_AD_Notification_Topic"
export TOPIC_ARN="arn:aws:sns:$REGION:$ACCOUNTID:$SNS_TOPIC_NAME"

aws sns create-topic --name $SNS_TOPIC_NAME --region $REGION
In order to receive notifications sent to an SNS topic, a subscriber must subscribe to the SNS topic. In this example, we will use email notification. For this, an email must be subscribed to the SNS topic created above. Please replace the example email address “myemail@example.com” in below command with the email address to which you would like to get notifications and execute the commands.
export EMAIL_ID='myemail@example.com'
aws sns subscribe --topic-arn $TOPIC_ARN --protocol email --notification-endpoint $EMAIL_ID --region $REGION
AWS immediately sends a confirmation message by email to the address you specified in the subscribe command. Please ensure to check your email and click on the link sent to confirm your subscription.
Step 3: verify if an IAM policy exists that allows Amazon EventBridge to publish events to your Amazon SNS topic
The resource-based policy needed for publishing notification to SNS topics from an EventBridge rule is created automatically when the AWS Management Console is used to create the rule and add SNS as its target, however, it should be done explicitly while creating the rule using CLI or SDK. To check if your SNS topic already has a resource-based policy, execute below commands.
Note: please replace the SNS_TOPIC_NAME below with the SNS topic name that you would like to use for sending notifications.
export TOPIC_ARN="arn:aws:sns:$REGION:$ACCOUNTID:$SNS_TOPIC_NAME"
aws sns get-topic-attributes --topic-arn "$TOPIC_ARN" --region $REGION --output json
If there is no policy allowing EventBridge to publish events to your SNS topic, use below command to create one:
Note: ensure you have jq installed before executing below commands.
aws sns get-topic-attributes --topic-arn "$TOPIC_ARN" --region $REGION --output json --query 'Attributes.Policy' | jq -r '.' | jq --arg TOPIC_ARN "$TOPIC_ARN" '.Statement += [{"Sid":"PublishEventsToMyTopic","Effect":"Allow","Principal":{"Service":"events.amazonaws.com"},"Action":"sns:Publish","Resource": $TOPIC_ARN}]' > /tmp/ECS_AD_SNSTopicPolicy.json
aws sns set-topic-attributes --topic-arn "$TOPIC_ARN" --attribute-name Policy --attribute-value file:///tmp/ECS_AD_SNSTopicPolicy.json --region $REGION
Step 4: create an Amazon EventBridge rule to detect and log ECS service actions and ECS task state change events into CloudWatch logs
Execute below commands to setup EventBridge Rule to log ECS service events and ECS task state change events to a CloudWatch log group. Ensure to replace the ECS_CLUSTER_NAME in the following JSON with the name of your ECS cluster.
export ECS_CLUSTER_NAME='YourECSClusterName'
export CW_LG_NAME='ECS_ANOMALY_DETECTOR'

aws logs create-log-group --log-group-name "/aws/events/$CW_LG_NAME" --region $REGION

cat <<EOF > /tmp/EventRulePattern.json
{
  "source": [
    "aws.ecs"
  ],
  "detail-type": [
    "ECS Service Action",
    "ECS Task State Change"
  ],
  "detail": {
    "clusterArn": [
      "arn:aws:ecs:$REGION:$ACCOUNTID:cluster/$ECS_CLUSTER_NAME"
    ]
  }
}
EOF

aws events put-rule --name "ECS_AD_ServiceActivity" --event-pattern file:///tmp/EventRulePattern.json --region $REGION
aws events put-targets --rule "ECS_AD_ServiceActivity" --targets "Id"="CWLG","Arn"="arn:aws:logs:$REGION:$ACCOUNTID:log-group:/aws/events/$CW_LG_NAME" --region $REGION
If needed, you may remove the “detail” section in above event pattern to get and stream all the events from all your ECS clusters in a designated region of your account.
On the other hand, in order to get and stream events only for specific ECS service(s) in an ECS cluster, you may add your ECS service ARNs in below resources section (comma separated) and replace it with “detail” section in above event pattern.
"resources": [
    "arn:aws:ecs:us-west-2:0123456789:service/main-cluster/ecs-anamoly-detector"
  ]
Step 5: create an Amazon EventBridge rule to detect ECS service events with ERROR and WARN types and send notifications using Amazon SNS
In order to reduce the number of notifications, we will use a new dedicated EventBridge rule to filter only the ERROR and WARN type “ECS Service Action” events and alert using an SNS topic when detected.
Execute the following commands to create a new EventBridge rule for specifically filtering ERROR and WARN type “ECS Service Action” events and send a customized alert when detected.
cat <<EOF > /tmp/SVCActionErrorEventRulePattern.json
{
  "source": [
    "aws.ecs"
  ],
  "detail-type": [
    "ECS Service Action"
  ],
  "detail": {
  "eventType": ["ERROR", "WARN"],
    "clusterArn": [
      "arn:aws:ecs:$REGION:$ACCOUNTID:cluster/$ECS_CLUSTER_NAME"
    ]
  }
}
EOF

aws events put-rule --name "ECS_AD_ServiceAction_ERROR" --event-pattern file:///tmp/SVCActionErrorEventRulePattern.json --region $REGION

cat <<EOF > /tmp/targets.json
[
  {
    "Id": "SNST",
    "Arn": "$TOPIC_ARN",
    "InputTransformer": {
      "InputPathsMap": {
        "ClusterARN": "$.detail.clusterArn",
        "DetailType": "$.detail-type",
        "EventName": "$.detail.eventName",
        "Region": "$.region",
        "Service": "$.resources",
        "Severity": "$.detail.eventType",
        "Time": "$.time"
        },
      "InputTemplate": "\"ECS Service <Service> from Cluster <ClusterARN> emitted an <DetailType> event of severity level <Severity> at <Time>At <Time>.\"\n\n\"Event Details:\"\n\"Time: <Time>\"\n\"Cluster ARN: <ClusterARN>\"\n\"Region: <Region>\"\n\"DetailType: <DetailType>\"\n\"EventName: <EventName>\"\n\"Severity: <Severity>\"\n\"Service: <Service>\""
    }
  }
]
EOF

aws events put-targets --rule "ECS_AD_ServiceAction_ERROR" --targets file:///tmp/targets.json --region $REGION --region $REGION
Step 6: create an Amazon EventBridge rule to detect ECS tasks failures and send notifications using Amazon SNS
An unexpected change in task state may indicate some issue in the cluster and you may need to take actions in case your tasks being stopped or terminated with unexpected reason code. The EventBridge rule that we will create below, will send a notification whenever a task changes its state to STOPPED in your cluster due to any of the following reasons:
- Task failed due to ALB health check
- Task failed due to essential container in the task exited or crashed
- Task failed its container-level health check
Execute below command to create the EventBridge rule and add an SNS topic as target for alerting with customized message.
cat <<EOF > /tmp/TasksStoppedEventRulePattern.json
{
  "source": [
    "aws.ecs"
  ],
  "detail-type": [
    "ECS Task State Change"
  ],
  "detail": {
    "desiredStatus": [
      "STOPPED"
    ],
    "stoppedReason": [
      {
        "prefix": "Task failed ELB health checks"
      },
      "Essential container in task exited",
      "Task failed container health checks"
    ],
    "clusterArn": [
      "arn:aws:ecs:$REGION:$ACCOUNTID:cluster/$ECS_CLUSTER_NAME"
    ]
  }
}
EOF

aws events put-rule --name "ECS_AD_StoppedTask_Detector" --event-pattern file:///tmp/TasksStoppedEventRulePattern.json --region $REGION

cat <<EOF > /tmp/targets.json
[
  {
    "Id": "SNST",
    "Arn": "$TOPIC_ARN",
    "InputTransformer": {
      "InputPathsMap": {
        "ClusterARN": "$.detail.clusterArn",
        "Code": "$.detail.stopCode",
        "DesiredStatus": "$.detail.desiredStatus",
        "Region": "$.region",
        "TaskARN": "$.detail.taskArn",
        "TaskDefinitionARN": "$.detail.taskDefinitionArn",
        "TaskStoppedReason": "$.detail.stoppedReason",
        "Time": "$.time"
      },
      "InputTemplate": "\"At <Time> the ECS Task <TaskARN> running in ECS Cluster <ClusterARN> <DesiredStatus> with reason <TaskStoppedReason> in <Region> region.\"\n\n\"Task Details:\"\n\"Time: <Time>\"\n\"Task ARN: <TaskARN>\"\n\"Task Definition ARN: <TaskDefinitionARN>\"\n\"Cluster ARN: <ClusterARN>\"\n\"Task Desired Status: <DesiredStatus>\"\n\"Status Code: <Code>\"\n\"Task Stopped Reason: <TaskStoppedReason>\"\n\"Region: <Region>\""
    }
  }
]
EOF

aws events put-targets --rule "ECS_AD_StoppedTask_Detector" --targets file:///tmp/targets.json --region $REGION
Step 7: create an Amazon EventBridge rule to log ECS deployment events to Amazon CloudWatch logs and send notifications using Amazon SNS
Amazon ECS also sends service deployment change state events with the detail type “ECS Deployment State Change” to EventBridge with INFO and ERROR severity. Using an EventBridge rule, we will detect the events and log them all in CloudWatch logs.
Use the following command to create an EventBridge rule to monitor all services in your ECS cluster for “ECS Deployment State Change” events and log that in a CloudWatch log group.
Here, it is important to note that since the “ECS Deployment State Change” do not have cluster ARN Field defined, those events can only be detected using the ECS service ARNs. As the ECS service can be short lived in many environments, it brings a new challenge where you would need to modify the event pattern of this rule whenever a new service is added or removed from the cluster. You may also use below command multiple times to update this rule after ECS services are added removed from your cluster.
Services_List=$(aws ecs list-services --cluster $ECS_CLUSTER_NAME  --output text --query 'serviceArns[*]' --region $REGION | tr -s '[:blank:]' ',' | sed -e 's/.*/"&"/g' -e 's/,/","/g')

cat <<EOF > /tmp/ECSAnomalyDetector-DeploymentStateChange-Event.json
{
    "source": [
        "aws.ecs"
    ],
    "resources": [ $Services_List ],
    "detail-type": [
        "ECS Deployment State Change"
    ]
}
EOF

aws events put-rule --name "ECS_AD_DeploymentStateChange_Event" --event-pattern file:///tmp/ECSAnomalyDetector-DeploymentStateChange-Event.json --region $REGION
aws events put-targets --rule "ECS_AD_DeploymentStateChange_Event" --targets "Id"="MyId","Arn"="arn:aws:logs:$REGION:$ACCOUNTID:log-group:/aws/events/$CW_LG_NAME" --region $REGION

cat <<EOF > /tmp/targets.json
[
  {
    "Id": "SNSDEPLOYT",
    "Arn": "$TOPIC_ARN",
    "InputTransformer": {
      "InputPathsMap": {
        "Region": "$.region",
        "Time": "$.time",
        "Service": "$.resources",
        "Event": "$.detail.eventName",
        "DeploymentID": "$.detail.deploymentId",
        "State": "$.detail.reason"
      },
      "InputTemplate": "\"Deployment state for ECS Service <Service> is <State> at <Time> in Region <Region>.\"\n\n\"Service Deployment Detail:\"\n\"Time: <Time>\"\n\"Region: <Region>\"\n\"Service: <Service>\"\n\"Event: <Event>\"\n\"Deployment State: <State>\"\n\"Deployment ID: <DeploymentID>\""
    }
  }
]
EOF

aws events put-targets --rule "ECS_AD_DeploymentStateChange_Event" --targets file:///tmp/targets.json --region $REGION
Monitoring ECS scaling activities via AWS CloudTrail and send notifications using Amazon SNS when a certain threshold is Reached
Step 8: create an Amazon EventBridge rule to detect ‘UpdateService’ API call through CloudTrail and log to CloudWatch logs
To know about scaling activity of an ECS service and detect any anomaly in it, the “UpdateService” APIs through CloudTrail are monitored and analyzed using an EventBridge rule. To set up EventBridge rule and log UpdateService API events to CloudWatch logs, use the following commands:
cat <<EOF > /tmp/ECSAnomalyDetector-UpdateService-CloudTrailEvent.json
{
    "source": [
        "aws.ecs"
    ],
    "detail-type": [
        "AWS API Call via CloudTrail"
    ],
    "detail": {
        "eventSource": [
            "ecs.amazonaws.com"
        ],
        "eventName": [
            "UpdateService"
        ],
        "requestParameters": {
            "cluster": [
                "$ECS_CLUSTER_NAME"
            ]
        }
    }
}
EOF

aws events put-rule --name "ECS_AD_UpdateService_CTEvent" --event-pattern file:///tmp/ECSAnomalyDetector-UpdateService-CloudTrailEvent.json --region $REGION
aws events put-targets --rule "ECS_AD_UpdateService_CTEvent" --targets "Id"="MyCTId","Arn"="arn:aws:logs:$REGION:$ACCOUNTID:log-group:/aws/events/$CW_LG_NAME" --region $REGION
In case you are running a multi-tenant SaaS application on ECS, you have ECS clusters with hundreds of ECS services or you have ECS clusters shared among different internal teams, finding the service or the reason that caused an excessive and unexpected increase in either compute usage or cost is a challenging task. In order to figure out the reason, you need to analyze scaling activities, especially, running count and desired count for each ECS service.
When the ECS Service scheduler updates the computed desired task count of ECS Service or task set, an ECS Service Action event SERVICE_DESIRED_COUNT_UPDATED is emitted with INFO catagory. This Event contains information about the running task count and desired task count of the service. These numbers can be normally used to tack service scaling activities for a ECS Service for a given timeline. However, this event is not sent when the desired count is manually updated by a user. Since in most cases the ECS service desired task count is updated by ASG Scaling policy, which is also considered as manual update by ECS, this event isn’t triggered. Therefore, in order to track changes in service desired task count, rather than ‘SERVICE_DESIRED_COUNT_UPDATED’ event, we will use “UpdateService” API event emitted by AWS CloudTrail to Amazon EventBridge.
Moreover, just as explained in step 8, you can also opt to trigger SNS notifications if the change magnitude crosses a predefined threshold using a Lambda function to calculate the magnitude of change for each scaling event.
Step 9 (optional): set up a Lambda function to alert when the change in capacity for the ECS service is more than a (configurable) defined threshold
All UpdateService events in AWS CloudTrail have information about the running task count and desired task count for the service. We will use this information to find the magnitude of change in ECS service tasks and send an alert when:
- The increase (%) in task is higher than 100% or the decrease (%) in task is lower than 50% when the running task count is between 3 and 6.
- The increase (%) in task is higher than 50% or the decrease (%) in task is lower than 30% when the running task count is higher than 6.
- The magnitude of task change for an ECS Service won’t be evaluated when the running task count is less than 3.
To calculate the change in capacity, below expression will be used by the Lambda function:
% change in capacity = (Desired Task Count - Running Task Count) * 100 / Running Task Count
Note: the above thresholds are for illustration purposes only. Feel free to change that in the Lambda code below as per your requirements.
Use the following commands to create the Lambda function, its IAM role, and add that as target to the EventBridge rule created above for logging ECS scaling activity via AWS CloudTrail.
Lambda_RoleArn=$(aws iam create-role --role-name ECS_AD_Lambda_Role --assume-role-policy-document '{"Version": "2012-10-17","Statement": [{ "Effect": "Allow", "Principal": {"Service": "lambda.amazonaws.com"}, "Action": "sts:AssumeRole"}]}' --output text --region $REGION --query 'Role.Arn')

cat <<EOF > /tmp/LambdaRolePolicy.json
{
    "Version": "2012-10-17",
    "Statement": [
        {
            "Effect": "Allow",
            "Action": [
                "logs:CreateLogGroup",
                "logs:CreateLogStream",
                "logs:PutLogEvents",
                "SNS:Publish"
            ],
            "Resource": "*"
        }
    ]
}
EOF
aws iam put-role-policy --role-name ECS_AD_Lambda_Role --policy-name ECS_AD_Lambda_Role_Policy --policy-document file:///tmp/LambdaRolePolicy.json --region $REGION

cat <<EOF > /tmp/lambda_function.py
import json
import boto3
import os

def Send_Notification(CapacityChange, ServiceName, ClusterName, runningCount, desiredCount):
    snsClient = boto3.client('sns')
    sns_topic_arn = os.environ['SNS_TOPIC_ARN']
    if CapacityChange > 0:
        text = 'increased'
    if CapacityChange < 0:
        text = 'decreased'
    SNSMessage = 'Task Count for ECS Service {} in Cluster {} {} by {}%.\n\nRunning task count before UpdateService API: {}\n\nDesired Task Count Set by UpdateService API: {}\n'.format(ServiceName, ClusterName, text, abs(CapacityChange), runningCount, desiredCount)
    print('SNSMessage: {}'.format(SNSMessage))
    Resp = snsClient.publish(
                TargetArn=sns_topic_arn,
                Message=SNSMessage
            )
    print('Resp: {}'.format(Resp))

def lambda_handler(event, context):
    Running_Count_Threshold = 3
    if event['detail']['eventName'] == 'UpdateService':
        try:
            if event['detail']['errorCode']:
                print("This event contains ErrorCode: {}. CloudTrail requestID: {}. Skipping script execution.".format(event['detail']['errorCode'], event['detail']['requestID']))
        except KeyError:
            runningCount = event['detail']['responseElements']['service']['runningCount']
            desiredCount = event['detail']['responseElements']['service']['desiredCount']
            if runningCount >= Running_Count_Threshold:
                Change_in_Task_Count = desiredCount - runningCount
                CapacityChange = (Change_in_Task_Count / runningCount) * 100
                ServiceName = event['detail']['responseElements']['service']['serviceName']
                ClusterName = event['detail']['requestParameters']['cluster']
                print("Change_in_Task_Count: {}, CapacityChange: {}, ServiceName: {}, ClusterName: {}".format(Change_in_Task_Count, CapacityChange, ServiceName, ClusterName))
                if runningCount >= 3 and runningCount <= 6:
                    if CapacityChange >= 100 or CapacityChange <= -50:
                        Send_Notification(CapacityChange, ServiceName, ClusterName, runningCount, desiredCount)
                if runningCount > 6:
                    if CapacityChange >= 50 or CapacityChange <= -30:
                        Send_Notification(CapacityChange, ServiceName, ClusterName, runningCount, desiredCount)
    else:
        print("This is not UpdateService event, it is {} instead. Skipping function execution.".format(event['eventName']))
EOF

cd /tmp && zip ECS_AD_Lambda_Code.zip lambda_function.py
lambdaArn=$(aws lambda create-function --function-name ECS_AD_Lambda_Function --zip-file fileb:///tmp/ECS_AD_Lambda_Code.zip --handler lambda_function.lambda_handler --runtime python3.7 --role $Lambda_RoleArn --timeout 900 --region $REGION --environment "Variables={SNS_TOPIC_ARN=$TOPIC_ARN}" --output text --query 'FunctionArn')

aws events put-targets --rule "ECS_AD_UpdateService_CTEvent" --targets "Id"="MyLambdaId","Arn"="$lambdaArn" --region $REGION
aws lambda add-permission --statement-id "InvokeLambdaFunction" --action "lambda:InvokeFunction" --principal "events.amazonaws.com" --function-name "$lambdaArn" --source-arn "arn:aws:events:$REGION:$ACCOUNTID:rule/ECS_AD_UpdateService_CTEvent" --region $REGION
Verification
After executing the commands mentioned in preceding sections, check the Amazon EventBridge rule via the AWS Management Console and filter rules with text “ECS_AD_”. This should list five different Amazon EventBridge rules as shown below:

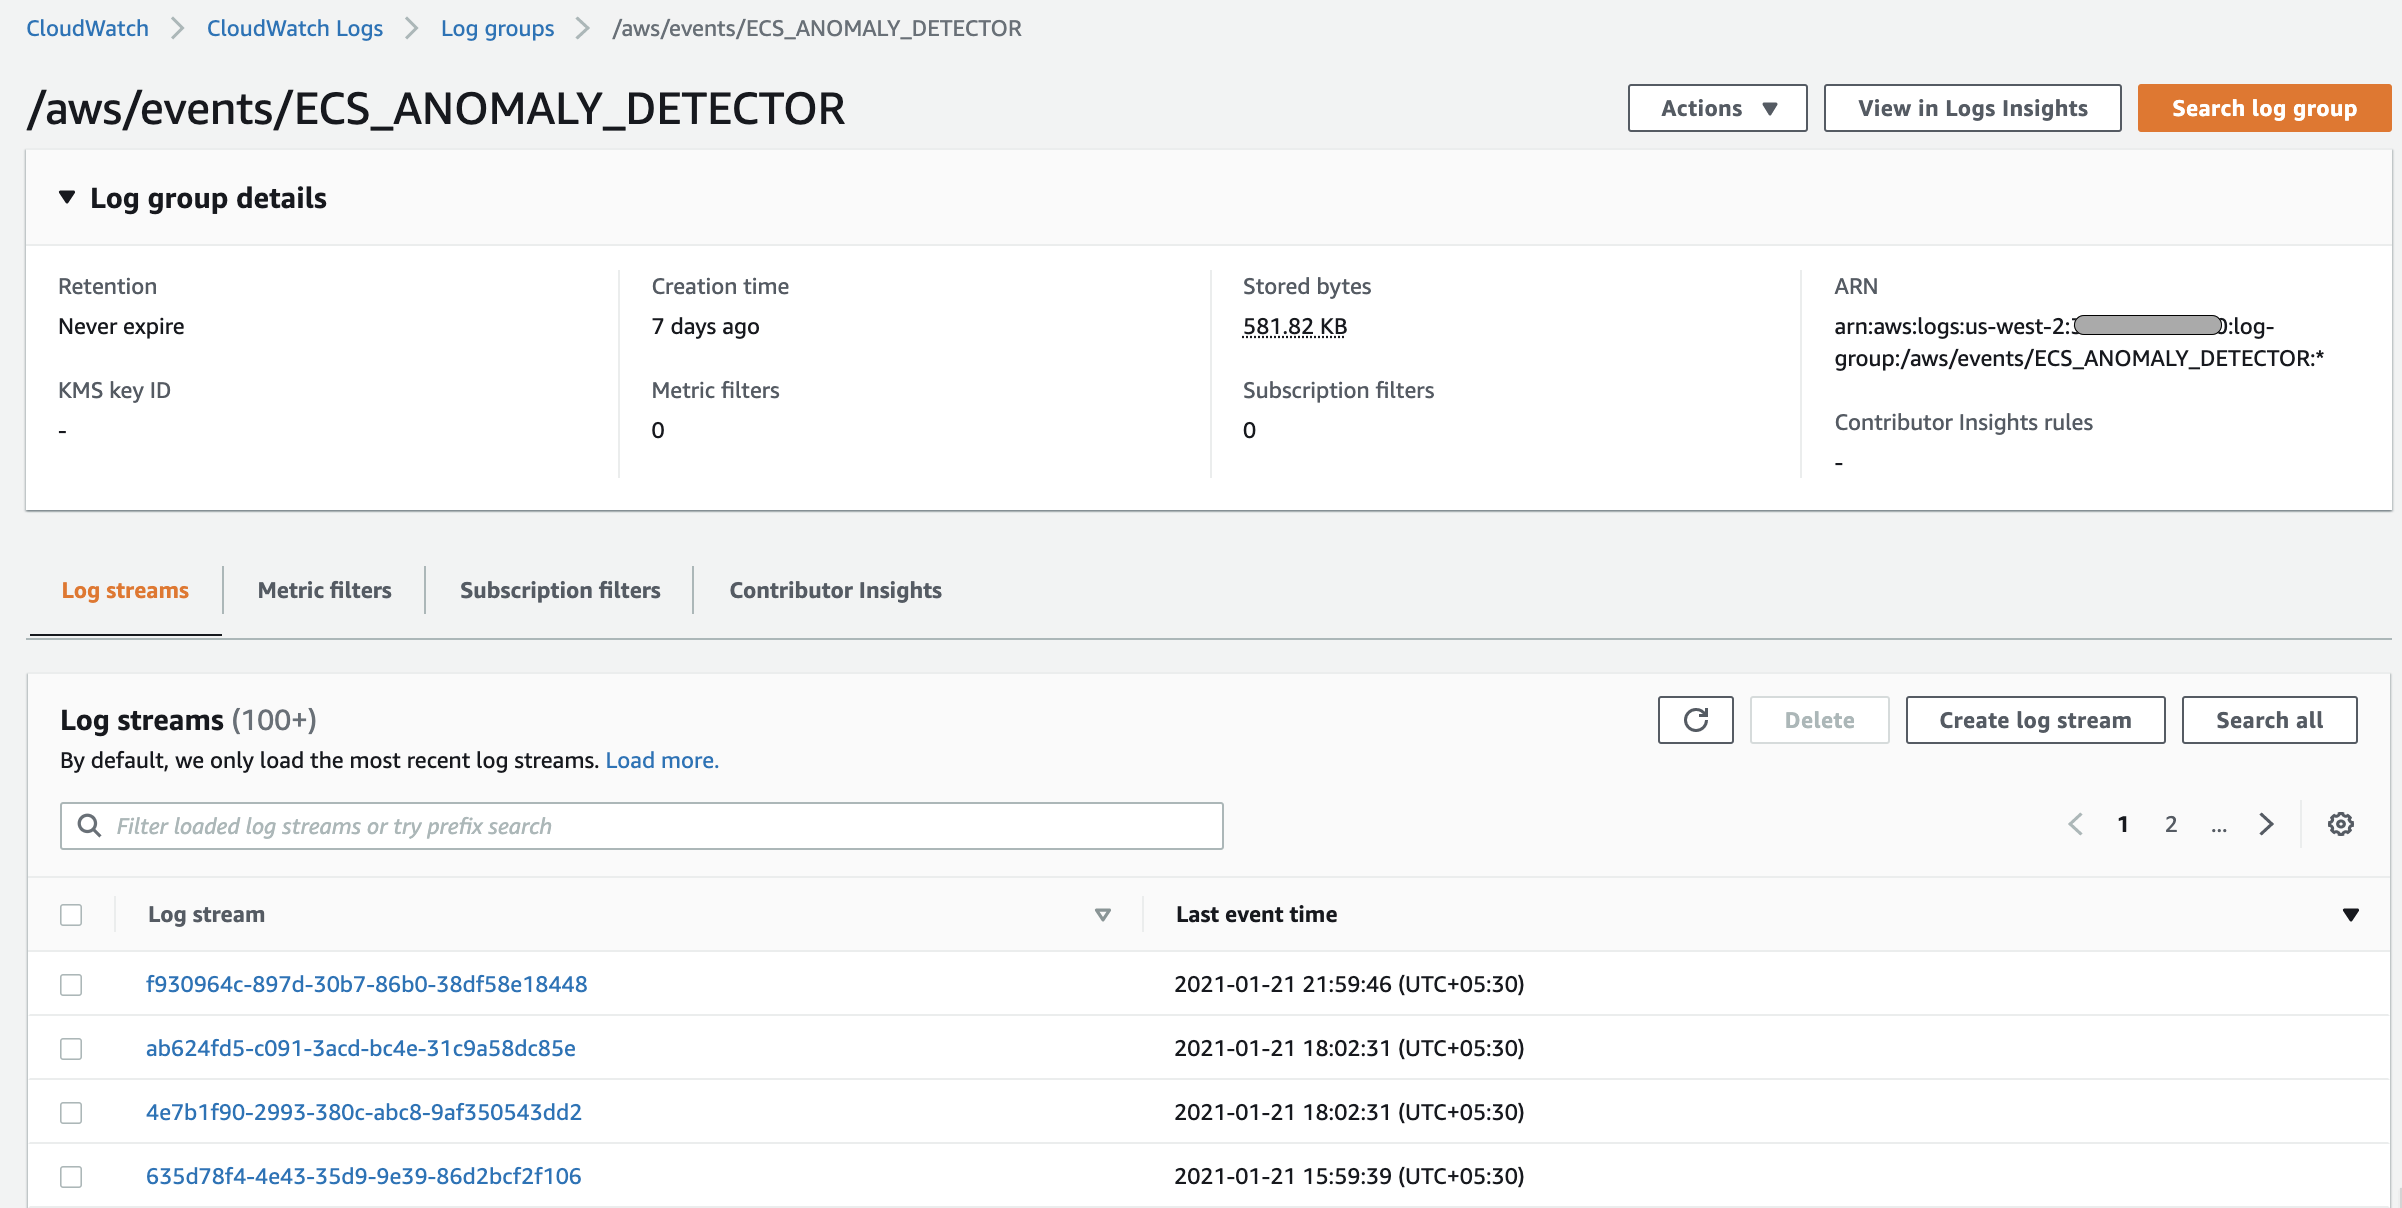
To verify if the Amazon EventBridge rules are detecting ECS events and logging to CloudWatch logs, you may check Amazon CloudWatch in the AWS Management Console. It should have log streams populated (as shown below) after a few minutes or as soon as some relevant events are generated by the ECS cluster:
Event analysis and anomaly detection
After completing Anomaly Detector setup, in this section, we will analyze events generated by your ECS service using CloudWatch Log Insights in three different categories:
1. Capacity change – scaling activities: In this category, you will be able to analyze all scaling activities using the Log Insights query and spot significant change on your container capacity by generating on-demand reports
CloudWatch Log Insights query:
filter `detail-type`="AWS API Call via CloudTrail" and detail.eventName ="UpdateService" and !ispresent(detail.errorCode)
| fields @timestamp as Time,  detail.responseElements.service.serviceName as ServiceName,
detail.responseElements.service.runningCount as RunningCount,
detail.responseElements.service.desiredCount as DesiredCount,
(detail.responseElements.service.desiredCount-detail.responseElements.service.runningCount) as Change_in_Task_Count,
floor(((detail.responseElements.service.desiredCount-detail.responseElements.service.runningCount)/detail.responseElements.service.runningCount)*100) as `CapacityChange (%)`,
abs(`CapacityChange (%)`) as `Absolute_Change (%)`
| sort `Absolute_Change (%)` desc, @timestamp desc
| limit 20
CloudWatch Log Insights query output:

2. Analyzing Amazon ECS service events: In this category, you will be able to analyze all service events such as “SERVICE_TASK_PLACEMENT_FAILURE” and the reason/trigger of the events by generating on-demand reports. Additionally, you can also find detailed information about ECS task failures and reasons, such as a failed ELB health check here.
CloudWatch Log Insights Query for analyzing ECS service failures:
filter `detail-type`="ECS Service Action"
|fields @timestamp, `detail-type` as Type, detail.eventName as Event,detail.reason as Reason , resources.0 as ServiceName
| sort @timestamp desc
| limit 200
CloudWatch Log Insights query output:

CloudWatch Log Insights query for analyzing ECS task failures:
filter `detail-type`="ECS Task State Change" and detail.desiredStatus="STOPPED"
|fields  detail.stoppingAt as stoppingAt  ,detail.stoppedReason as stoppedReason,detail.taskArn as Task
| sort @timestamp desc
| limit 200
CloudWatch Log Insights query output:

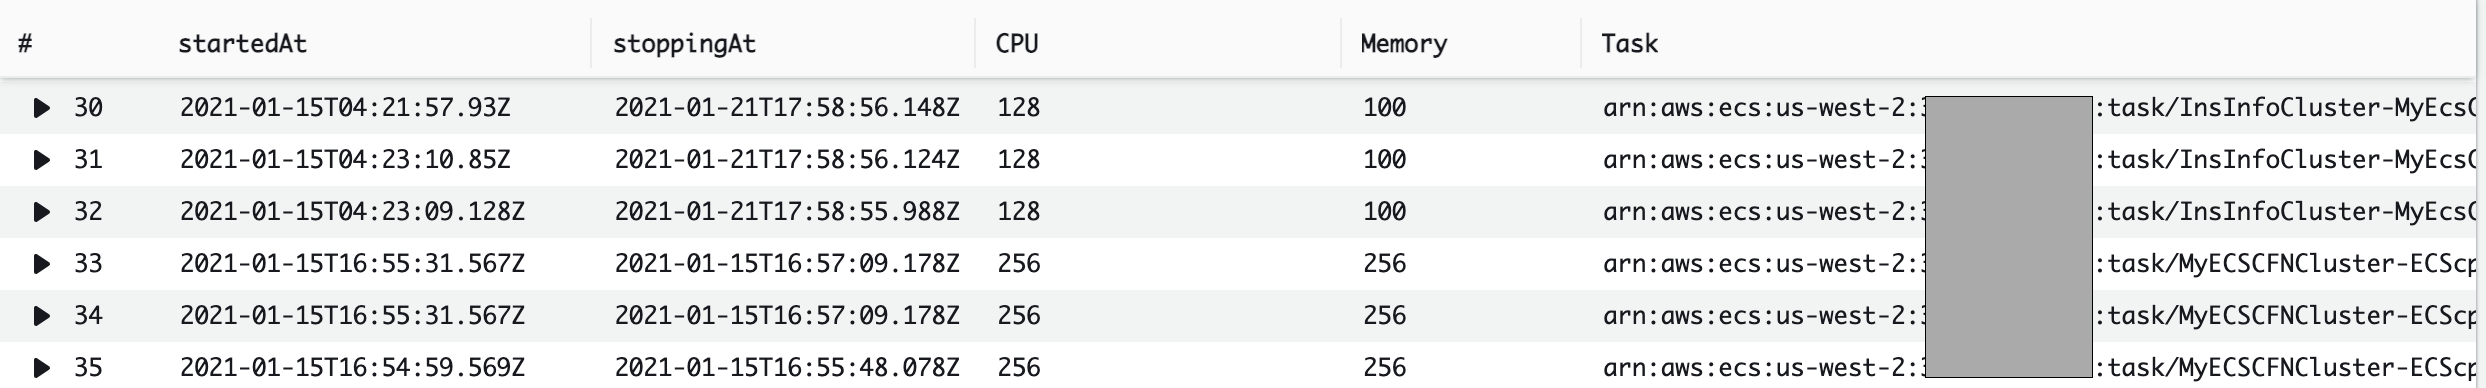
3. Resource usage analysis at the task level: In this category, you will be able to analyze CPU and memory reserved at the task level for each ECS service, as well as, the start and end time of each individual task, and generate on-demand report about those usages. Using such reports simplify service chargebacks or cost analysis at task level.
CloudWatch Log Insights query for resource usage task level:
filter `detail-type`="ECS Task State Change" and detail.desiredStatus="STOPPED"
|fields  detail.startedAt as startedAt ,detail.stoppingAt as stoppingAt ,detail.cpu as CPU,detail.memory as Memory, detail.taskArn as Task
| sort @timestamp desc
| limit 200
CloudWatch Log Insights query output:
Conclusion
Amazon EventBridge events emitted by Amazon ECS can provide visibility into the ECS cluster for efficient management of the cluster and for operation excellence which is particularly beneficial for a large ECS cluster. While enabling and using ECS Anomaly Detection mechanism, based on the size and event numbers within the cluster, it is important to consider CloudWatch Log charges; not only Store (Archival) charges but also Collect (Data Ingestion) charges. For more information about Amazon CloudWatch pricing see Amazon CloudWatch Pricing. However, you can easily lower associated costs significantly by defining Log Data Retention Policy in CloudWatch Logs, while continuing to take advantage of the anomaly detection and improve your observibility for ECS Clusters.
In this post, we have focused on the setup for one ECS cluster and all the services running on the cluster. In other words, enabling ECS Anomaly Detection per cluster. However, this can be easily extended to multiple clusters in the same region by following the steps below:
- To make below EventBridge Rules detect events from multiple ECS clusters, add the Cluster ARNs as comma separated list in the event pattern and update the EventBridge rule using “aws events put-rule” command:
- ECS_AD_ServiceActivity
- ECS_AD_ServiceAction_ERROR
- ECS_AD_StoppedTask_Detector
- To make EventBridge rule “ECS_AD_UpdateService_CTEvent” detect events from multiple ECS clusters, add the Cluster Names as comma separated list in the event pattern and update the EventBridge rule using “aws events put-rule” command.
- To make EventBridge rule “ECS_AD_DeploymentStateChange_Event” detect events from multiple ECS clusters, add the ECS service ARNs of all service in the “resources” section of the event pattern as command separated list and update the EventBridge rule using “aws events put-rule” command.
For more information about Amazon EventBridge see the EventBridge user guide. For more information on ECS events which are emitted to EventBridge see Amazon ECS events.

Santosh Kumar
Santosh is a Cloud Support Engineer. Learning is his passion and he holds various AWS certifications. He provides customers with technical guidance to implement Linux and Containers related best practices. Outside of work, Santosh loves cooking and spends time with his family.