AWS Developer Tools Blog
Remote Debug an IIS .NET Application Running in AWS Elastic Beanstalk
In this guest post by AWS Partner Solution Architect Sriwantha Attanayake, we take a look at how you can set up remote debugging for ASP.NET applications deployed to AWS Elastic Beanstalk.
We love to run IIS websites on AWS Elastic Beanstalk. With Elastic Beanstalk, you can quickly deploy and manage applications in the AWS Cloud without worrying about the infrastructure that runs those applications. Elastic Beanstalk reduces management complexity without restricting choice or control. You simply upload your application, and Elastic Beanstalk automatically handles the details of capacity provisioning, load balancing, scaling, and application health monitoring.
How can you remote debug a .NET application running on Elastic Beanstalk? This article describes a one-time setup of Elastic Beanstalk that enables you to remote debug in real time. You can use this approach in your development environments.
First, we create an Amazon EC2 instance from a base Elastic Beanstalk image. Next, we install Visual Studio remote debugger as a service and create a custom image from it. Then, we start an Elastic Beanstalk environment with this custom image. To allow communication with the Visual Studio remote debugger, we set up proper security groups. Finally, we attach the Visual Studio debugger to the remote process running inside the EC2 instance started by Elastic Beanstalk.
How to identify which Elastic Beanstalk image to customize
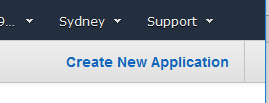
- Open the Elastic Beanstalk console and create a new application by choosing Create New Application.
- Create a new Web server environment.


- On the Create new environment page, choose .NET (Windows/IIS) as the preconfigured platform.

- Choose Configure more options.

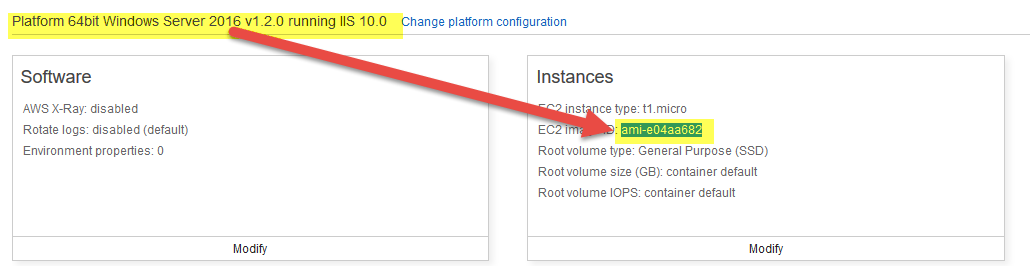
- Under Instances, you’ll find the default AMI that Elastic Beanstalk will use. This is determined by the selected platform and the region. For example, for the Sydney region, for the 64bit Windows Server 2016 v1.2.0 running IIS 10.0 platform, the AMI ID is ami-e04aa682. Make a note of this AMI ID. This is the base image you’ll customize later.

Customize the image
- Now that you know the base AMI used by Elastic Beanstalk, start an EC2 instance with this base image. You can find this image under Community AMIs.

- Once the EC2 instance is started, remotely log in to it.
Install Remote Tools as a Service. The installer depends on the Visual Studio version you use for development. See Remote Debugging for the steps to install the remote debugger. - When the installation is complete, run the Visual Studio remote debugger configuration wizard.

Note: If you do not want to create a custom image another approach you can use to install the Visual Studio remote debugger is to use .ebextensions. As detailed in Customizing Software on Windows Servers an .ebextension file can include commands that can run the installation when Elastic Beanstalk deploys the application.
Whichever approach you use, be sure of the following:
- You run the remote debugger as a service. The service account has to have permissions to run as a Windows service and must be a member of the local Administrators group.
- You allow network connections from all types of networks.
- The remote debugger service has started.
- Windows firewall doesn’t block the remote debugger.
Create an image from a customized EC2 instance
- When the installation is complete, Sysprep the machine using EC2 launch settings. You can find the EC2 launch settings at C:\ProgramData\Amazon\EC2-Windows\Launch\Settings\Ec2LaunchSettings.exe. Choose Shutdown with Sysprep.
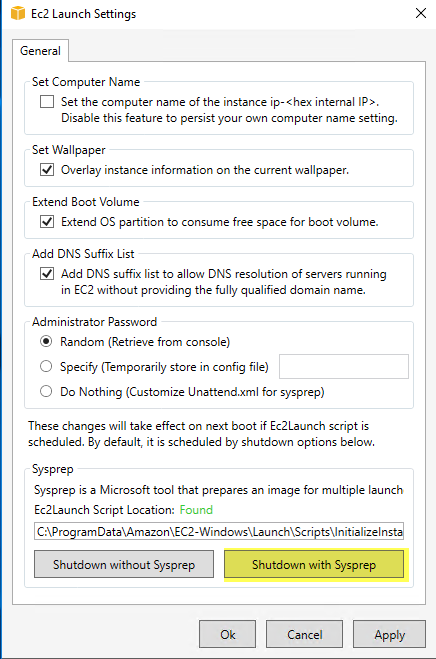
For a detailed explanation, see Configuring EC2Launch. - After the instance shuts down, you can create an image from it. Make a note of this AMI ID. The next time you start an Elastic Beanstalk environment, use this custom image ID.
Connecting to your Elastic Beanstalk environment
- When you start your Elastic Beanstalk environment, be sure you configure your security groups in a way that opens remote debugger ports to your development machine. Which ports to open depends on which Visual Studio environment you’re running. In the following example, port 4022 is for Visual Studio 2017, and port 4016 is for Visual Studio 2012.

See Remote Debugger Port Assignments to learn about the ports used in different Visual Studio environments. In the previous example, I have opened remote debugger ports corresponding to different editions of Visual Studio to any network. This poses a security risk. Please ensure you open only the ports necessary for your edition of Visual Studio to the development networks you trust. Once you are done with debugging, you can remove these security groups. - Be sure you specify a key pair for the Elastic Beanstalk EC2 instance, so that you can retrieve the autogenerated Administrator password for remote access.
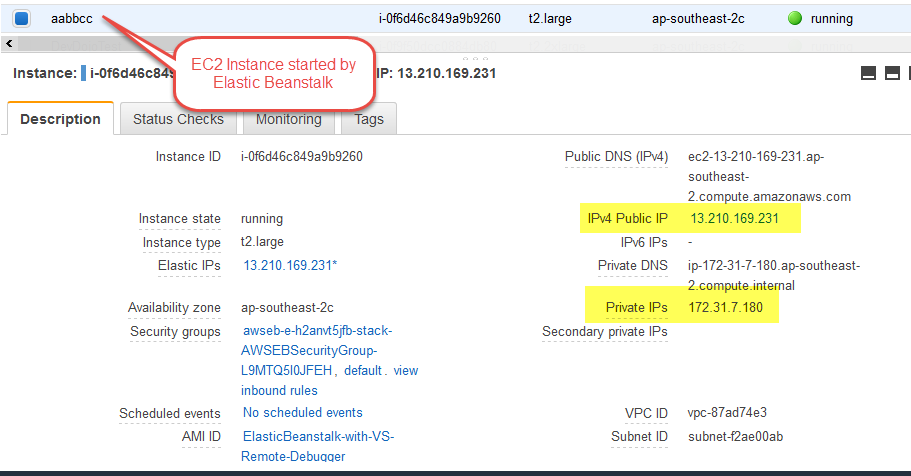
- Make a note of the IP address (public/private) of the EC2 instance started by the Elastic Beanstalk environment.
- Once you open the Visual Studio project (e.g., ASP.NET application) that is being deployed to Elastic Beanstalk, select Debug, Attach to Process.

- For Connection Target, enter the IP address of the EC2 instance started by Elastic Beanstalk. For example, if your development machine is in a private network with network reachability to the EC2 instance, use the private IP address. Depending on where your development machine is, you can use the public IP address. Finally, choose Show processes from all users.

- In the popup window that appears, you can enter your login information to the EC2 instance. Enter the Administrator user name and password of the EC2 instance that Elastic Beanstalk has started. The reason we started the Elastic Beanstalk EC2 instances with a key pair is to retrieve this password.

- If the login succeeds, you will see all the processes running inside the EC2 instance started by Elastic Beanstalk. If you don’t see the IIS worker process (w3wp.exe), ensure you have viewed your website at least once, and then choose Refresh. Choose Attach to attach the remote IIS worker process to Visual Studio and then confirm the attachment.

- You can now live debug the .NET application running inside Elastic Beanstalk. You will get a hit on a debug point when you execute the relevant code fragment.


Conclusions
In this post, we showed how you can remote debug a .NET web application running on Elastic Beanstalk. .NET remote debugging on Elastic Beanstalk is no different from .NET remote debugging you would do on a Windows server. Once you have an AMI with your custom tools installed, you can use it as your preferred Elastic Beanstalk image.
As noted earlier, another way to install the Visual Studio remote debugger is through an .ebextensions file. Using this approach, you don’t need to create a custom image. See Customizing Software on Windows Servers for details about advanced environment customization using Elastic Beanstalk configuration files.
Although you have the option of doing remote debugging on Elastic Beanstalk, don’t enable this feature on a production environment. In addition, don’t open the ports related to remote debugging on a production environment. The proper way to analyze issues on a production environment is to do proper logging. For example, in an ASP/MVC .NET application, you can catch all the unhandled exceptions in Global.asax and log them. For a large-scale complex logging solution, you can explore the best practices in Centralized Logging.