AWS DevOps & Developer Productivity Blog
Getting Started with CloudWatch Logs
Amazon CloudWatch Logs lets you monitor your applications and systems for operational issues in near real-time using your existing log files. You can get started in just minutes using the Amazon CloudWatch Logs agent for Amazon Linux, CentOs, Redhat Linux and Ubuntu.
In this blog post, we’ll show you how easy it is to get started by walking through the installation process on Linux-based systems. Cloudwatch Logs is also supported on Windows Server, which we’ll cover in another post (for more information, see Configuring a Windows Instance Using the EC2Config Service.)
Step 1: Permissions
CloudWatch uses the Identity and Access Management (IAM) service for authentication and authorization. In this blog post, we’re using a feature of IAM called IAM Roles for EC2, which lets us associate specific permissions with an Amazon EC2 instance when you launch it.
In this case, we have an instance we launched with the permissions for the IAM role for all logs actions with the following policy (to learn more about adding a policy to an existing IAM role, see IAM Users and Groups and Managing IAM Policies in Using IAM:)
|
{
“Version”: “2012-10-17”,
“Statement”: [
{
“Effect”: “Allow”,
“Action”: [
“logs:*”
],
“Resource”: [
“arn:aws:logs:*:*:*”
]
}
]
}
|
Step 2: Agent Installation & Configuration
With the right permissions set, we can connect to our EC2 instance with an SSH client and run the CloudWatch Logs Agent interactive setup. For more information about how to connect to your EC2 instance, see Connect to Your Instance in the Amazon Elastic Compute Cloud User Guide.
First, we’ll retrieve the agent with a simple wget command and then start running the installer. Note that CloudWatch Logs is is currently available in three regions including us-east-1, us-west-2 and eu-west-1. In this example, we used the us-east-1 region (this will be where the logs are processed and stored.)
wget https://s3.amazonaws.com/aws-cloudwatch/downloads/latest/awslogs-agent-setup.py
sudo python ./awslogs-agent-setup.py –region us-east-1
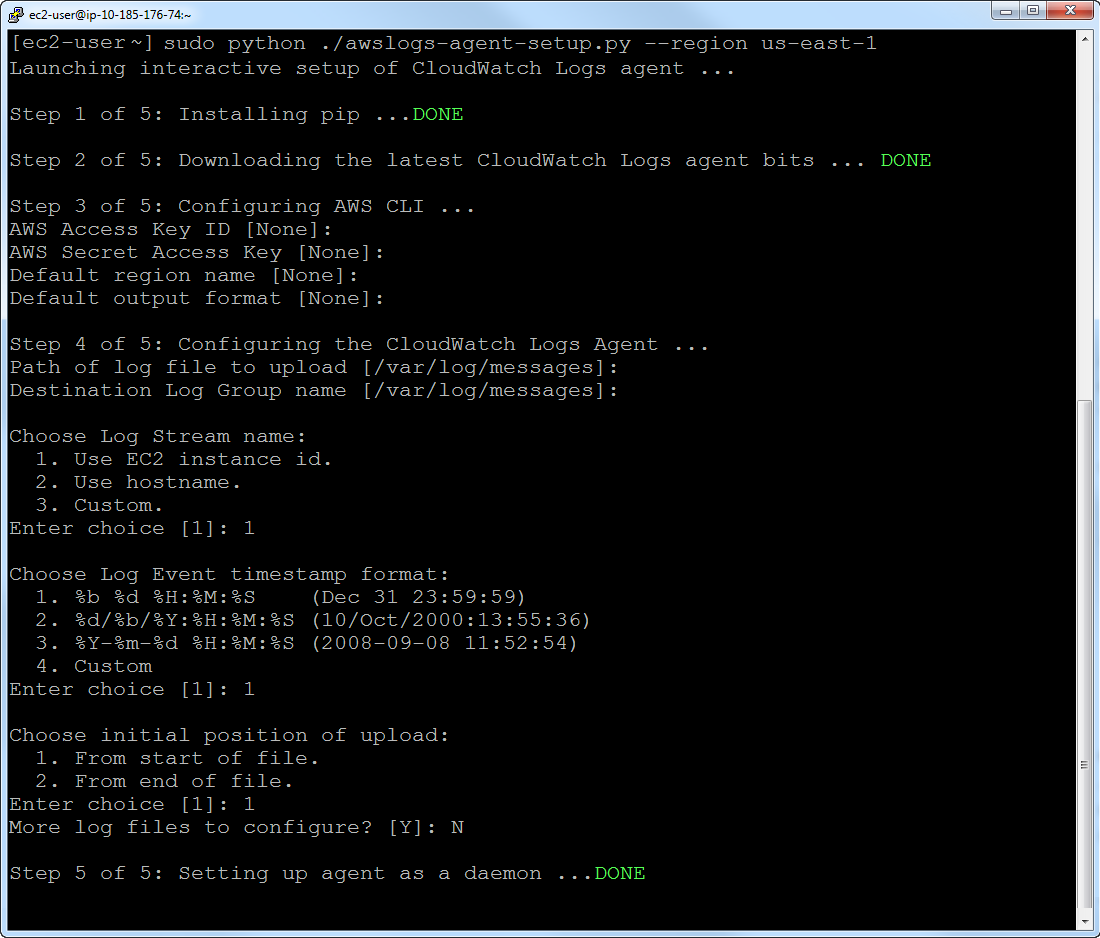
The installer will walk you through a set of questions to get you up and running:
Credentials
The CloudWatch Logs agent first asks for credential information. Since we’re using the IAM role associated with our running instance, we can just press “Enter” when prompted for the AWS Access Key and ID (otherwise, we would have provided the keys).
Default Region Name & Output Format
The default region name will show as the region you pass as the region argument to the setup (us-east-1, in our case); we just press “ENTER” to accept. The default output format determines output of the related CLI commands. You can also press “ENTER”.
Log File to Send
The installer now asks what log file you would like for the agent to send to CloudWatch for monitoring. By default, the installer suggests /var/log/messages but you can choose any file you like. In this example, we’ll use the default value of /var/log/messages and just press “ENTER”.
Log Group
We’re asked what log group we want the log data to be in. By default, the setup process suggests a log group with the same name as path and file being sent to CloudWatch. Again, we’ll press “ENTER” to accept the default.
Log Stream Name
Next, we need to give this source, or log stream, a name. The installer makes it easy to choose the host name, the instance ID (if running on EC2) or a name of your choosing (custom.) Again, we’ll use the default name derived from the instance ID.
Timestamp
Most log data includes a timestamp. CloudWatch Logs will use the timestamp embedded in each event if you provide the format. In our case, we chose the default by pressing “ENTER” but you can always provide a custom time stamp (for more info see the CloudWatch Logs Agent reference.)
Initial Upload Position
CloudWatch Logs can begin uploading data from the beginning of a log file or start “tailing” it from the end as new events are added. If you have existing log data that you want to have sent to CloudWatch, you can choose the first option which will send log data starting at the beginning of the file. In both options, the agent will continue to monitor the file for any new log events.
After you have completed the CloudWatch Logs agent installation steps, the installer asks if you want to configure another log file. For the sake of this example, we’re just going to monitor /var/log/messages, but you can run the process as many times as you like for each log file. For more information about the settings in the agent configuration file, see CloudWatch Logs Agent Reference. Once the installer is complete, it will start the agent with the new configuration. You can see what this entire process will look like, below.
Step 3: Access Log Data in CloudWatch Logs
With the agent started, the agent will begin sending log data to CloudWatch. We can now visit the console to see any new data that is showing up at https://console.aws.amazon.com/cloudwatch/home?region=us-east-1#logs. In our case, we can see the newly created log group and log stream in the CloudWatch console after the agent has been running for a few moments:

From here, you can setup metric filters to start monitoring for events you’re interested in. For more information on setting up metric filters, see the Creating Metric Filters documentation.
Related Resources
Of course, the CloudWatch Logs Agent can also be deployed with other technologies such as CloudFormation, Elastic Beanstalk and AWS OpsWorks. You can find related blog posts on these topics, below.
Using Amazon CloudWatch Logs with AWS Elastic Beanstalk
View CloudFormation Logs in the Console
Using Amazon CloudWatch Logs with AWS OpsWorks