The Internet of Things on AWS – Official Blog
Create insights by contextualizing industrial equipment data using AWS IoT SiteWise (Part 1)
Introduction
More and more customers in the manufacturing industry want to collect data from machines and robots located in different facilities into a centralized AWS cloud-based IoT data lake. But the data produced by industrial equipment is often raw data points like temperature and pressure time series. Feeding those raw data streams directly into your industrial data lake, will make it difficult for your data analysts to get insights out of the ingested equipment data. A data analyst might need information that is not directly contained in the raw data streams to analyze the performance of industrial equipment. Metadata like the construction year, location or the manufacture of an equipment could have an impact on the performance metrics.
AWS IoT SiteWise is a managed AWS service that simplifies collecting, organizing, and analyzing industrial equipment data and can help to contextualize the raw data streams captured from your industrial equipment using the AWS IoT SiteWise asset modeling capabilities. In part 1 of this blog series, and based on a fictional industrial use case, we will showcase how customer can use the asset modelling feature of AWS IoT Sitewise to manage such industrial equipment meta-data. And we will see how to use the AWS IoT SiteWise built-in library of operators and functions to perform real-time analytics to compute aggregated metrics. In part 2, we will show how we can export the ingested data to AWS IoT Analytics to perform complex batch analytics by combining the raw, meta and aggregated data to understand the root cause of an observed performance degradation.
Sample use case
To get you started, let’s consider a simple industrial scenario where the goal is to remotely monitor industrial furnaces. Your company owns furnaces across different production sites that perform the same industrial process like e.g. annealing metal workpieces. You’ve noticed a difference in manufacturing time and quality across your production sites.
You want to model your furnace in AWS IoT SiteWise with the following properties, and you use AWS IoT SiteWise Edge to collect those data points e.g over Modbus TPC from your furnaces.
| Furnace Asset Model | ||||
| Property Name | Property Type | Property Value Type | Unit | Sample Data |
| Furnace location | ATTRIBUTE | STRING | none | Paris factory, Chicago factory |
| Furnace manufacturer | ATTRIBUTE | STRING | none | Furnace Corp, Heat&Metal Corp |
| Furnace temp set point | ATTRIBUTE | INT | C˚ | 760 |
| Furnace construction year | ATTRIBUTE | INT | Year | 1999 |
| Current Kw Power Consumption | MEASUREMENT | DOUBLE | kW | 51 |
| Current furnace temperature | MEASUREMENT | DOUBLE | C˚ | 399 |
| The Furnace state | MEASUREMENT | STRING | none | IDLE, HEATING,HOLDING, COOLING |
| Last HOLDING cycle duration | TRANSFORMATION | DOUBLE | Duration in s | 4h5m3s |
| Avg Holding cycle last 24h | METRIC(1day) | DOUBLE | Duration in s | 4h5m3s |
You have a suspicion that the efficiency issue is linked to the heterogeneous machine park, so you want to compare the heating and holding duration across all furnaces grouped by manufacture and construction year. The next section shows you step-by-step instructions on how to use AWS IoT SiteWise and AWS IoT Analytics to generate the desired report.
Model and create an industrial asset in AWS IoT SiteWise
The first section explains on a high level how to create the furnace asset model in AWS IoT SiteWise. For details on how to model industrial assets in AWS IoT SiteWise, see Modeling industrial assets.
Create a furnace asset model
Sign in to the AWS Management Console and navigate to the AWS IoT SiteWise console.
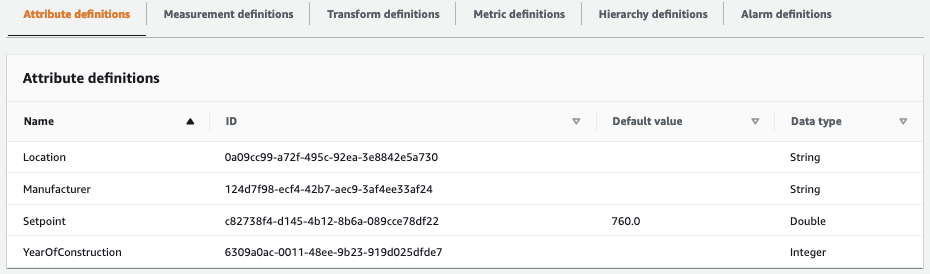
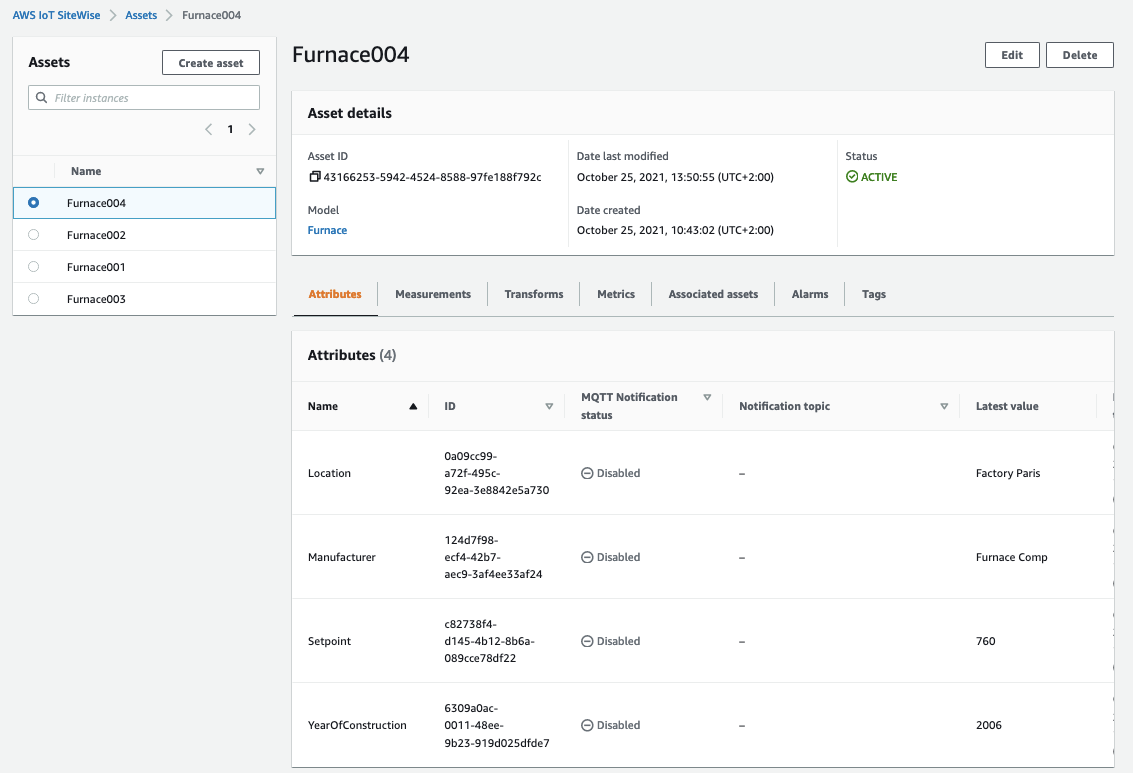
On the navigation bar, choose Build, Model to create a new Model, call it Furnace and define the static attributes and default value as describe in the table before:
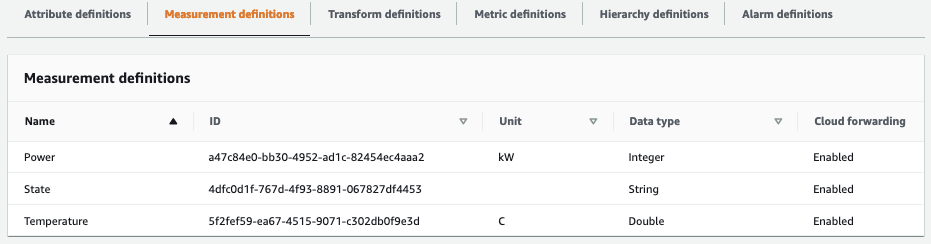
Next define the asset model measurement as depicted below. The furnace operates in four different processing states State moving from IDLE to HEATING, over HOLDING and COOLING. The Temperature measurement shows the current furnace temperature and Power the current power consumption in kW.
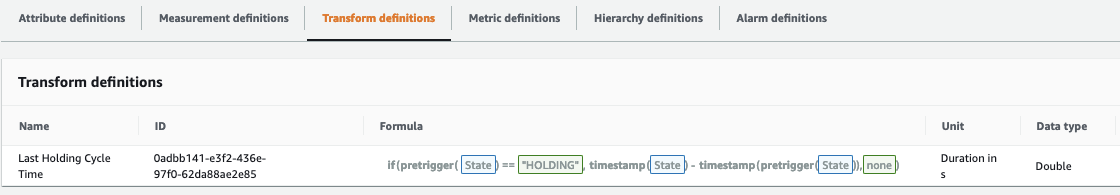
The next step is to define AWS IoT SiteWise transforms to perform computation on the raw measurements. We use some advanced temporal AWS IoT SiteWise functions here to detect the state change from HOLDING to COOLING and store the HOLDING cycle duration into the Metric Last Holding Cycle Time . The formula below is triggered when the State measurement changes value and the previous value was HOLDING: if(pretrigger(State)=="Holding", ... . In this situation, it computes the duration of the holding time by subtracting the current change timestamp from the previous change timestamp: timestamp(State) - timestamp(pretrigger(State). To learn more about AWS IoT SiteWise temporal functions, see Temporal functions
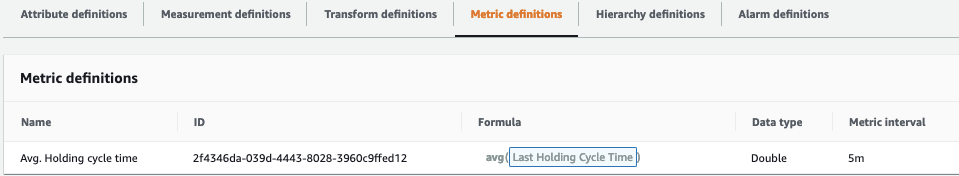
A furnace operator might be interested in monitoring the evolution of the holding cycle duration over time. To do so, let’s create a last metric to calculate the average Last Holding Cycle Time for a time window of 5-minute, in a real scenario a daily roll-up might be more appropriate to compare variations over a longer time period.
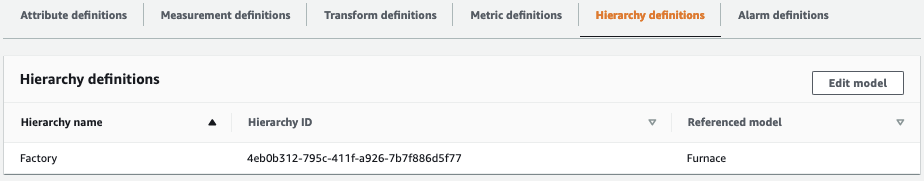
AWS IoT SiteWise allows users to define asset model hierarchies to create logical associations between the asset models in your industrial operation. As a last step, create a model named Factory to represent a factory and create a hierarchy definition pointing to the Furance model. A factory will later on, through a hierarchical structure, represent a group of furnaces placed in one production site. We will use this hierarchy later in AWS IoT SiteWise Monitor to visualize furnace performance metrics within a factory on a dashboard.
Create the furnace assets
Create assets based on the Furnace model by choosing Build, Assets in the navigation bar and choose Create asset. Create for example one Factory Asset named Paris Factory and 4 attached Furnace assets and populate the static asset attributes with random data of your choice.
This concludes the Asset modelling and creation part, and we can now start analyzing the data captured by AWS IoT SiteWise. In the next section, we will show you how to leverage the built-in AWS IoT SiteWise time-series optimized data store to monitor our furnaces in real-time.
Analyzing the near-real time data using AWS IoT Sitewise
To test our AWS IoT SiteWise assets, we need to generate some sample data for the furnace temperature, power and state measurements. In this blog post we don’t connect to a real Modbus data source but use a Python based data simulator that you can run on your laptop: https://github.com/aws-samples/sitewise-iiot-data-simulator . Follow the instructions in the README file to install and run the simulator.
AWS IoT SiteWise Monitor is an easy way to visualize the measurements, transformations and metrics we defined in our Asset Model. The following screen capture shows what an operational dashboard could look like to compare the performance of two Furnaces in a Factory. AWS IoT SiteWise Monitor allows you to create no-code fully managed web applications by using drag and drop the asset model properties onto the dashboard. This blog post leaves it to the discretion of the reader to design their own dashboard. To get you started, here are some of the widgets we used to create the dashboard depicted below. The dashboard uses the timeline widget to visualize the current and previous state transitions, the line chart to plot the temperature and power consumption and a bar chart to depict the last HOLDING cycle time duration. Several KPI widgets allow operators to have quick glance at key Furnace KPIs. To learn more on how to set up an AWS IoT SiteWise Monitor Dashboard, see Getting started with AWS IoT SiteWise Monitor.
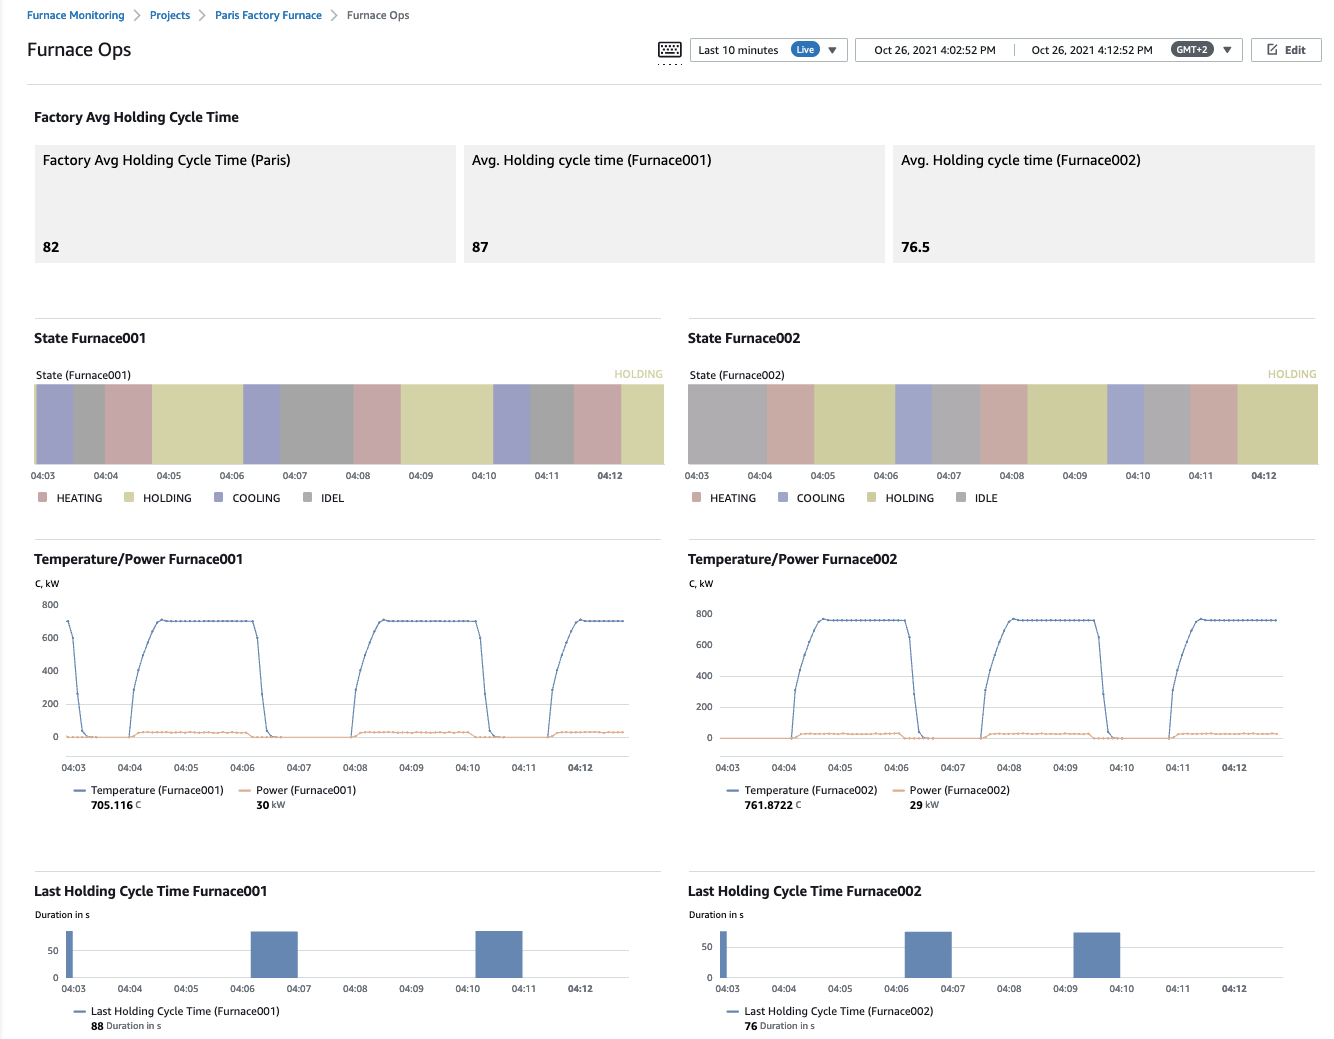
Using the AWS IoT SiteWise Monitor dashboard, we can clearly identify that the Avg. Holding Cycle time metric for Furnace001 is longer (87s vs 76.5s) than for Furnace002.
The holding time is also higher compared to the average (82s) across all furnaces in the Paris factory. But a more in-depth analysis is needed to understand the root cause of this discrepancy.
Clean up
Make sure you stop the furnace data simulator to avoid incurring ongoing charges.
Conclusion
This concludes the first part of this blog series. In this part we reviewed how AWS IoT SiteWise can be used to enrich raw industrial data streams, perform real-time analytics to detect industrial process boundaries and compute process level metrics like cycle duration and moving averages. Since the dashboard doesn’t allow for direct insights into the cause for the difference in the Avg. Holding Cycle time, we will use the second blog post in this series to dive deeper. In the second part of this blog, we will showcase how we can leverage the AWS IoT SiteWise cold tier storage feature to export the collected historical data to Amazon S3 and use AWS IoT Analytics to perform the root cause analysis and understand what contributes to the low performance of Furnace001.
About the author

Jan Borch is a Principal Specialist Solution Architect for IoT at Amazon Web Services (AWS) and has spent the last 10 years helping customers design and build best-in-class cloud solutions on AWS. The last 5 years, he has focused on the intersection of Cloud and IoT, leading the AWS IoT Prototyping Team to co-develop innovative connected IoT solutions with AWS customers in Europe, Middle East and Africa and recently his focal point shifted to customers with strategic IoT workloads on AWS.